
A breakout can look perfect and still be one of the worst trades of the day.
Price clears resistance.
Volume suddenly jumps.
The breakout candle looks powerful.
Everything on the chart appears to say, “Go.”
You buy.
Then the next candle reverses back through the breakout level.
The volume was real. The trading activity was real. The breakout happened.
But the conclusion you drew from the volume was wrong.
This mistake is one of the most costly mistakes in day trading.
Traders frequently use volume as a confirmation switch:
Weak breakout = low volume.
High volume = true breakout.
That’s far too easy.
Volume tells you that participation increased. It does not tell you whether that participation produced sustainable directional control.
A large amount of buying can meet an even larger amount of selling.
A huge volume candle can represent aggressive continuation, absorption, profit-taking, liquidation, trapped traders, or a violent transfer of positions.
The important question is not:
“Did volume increase?”
It is:
“What did the market accomplish with that volume?”
That question creates a much more useful way to analyze breakout volume.
What “Real” Breakout Volume Actually Means
When traders ask how to know if breakout volume is real, they usually mean something more specific.
They want to know whether the increase in participation is likely to support continued movement beyond the breakout level.
That requires separating three different concepts.
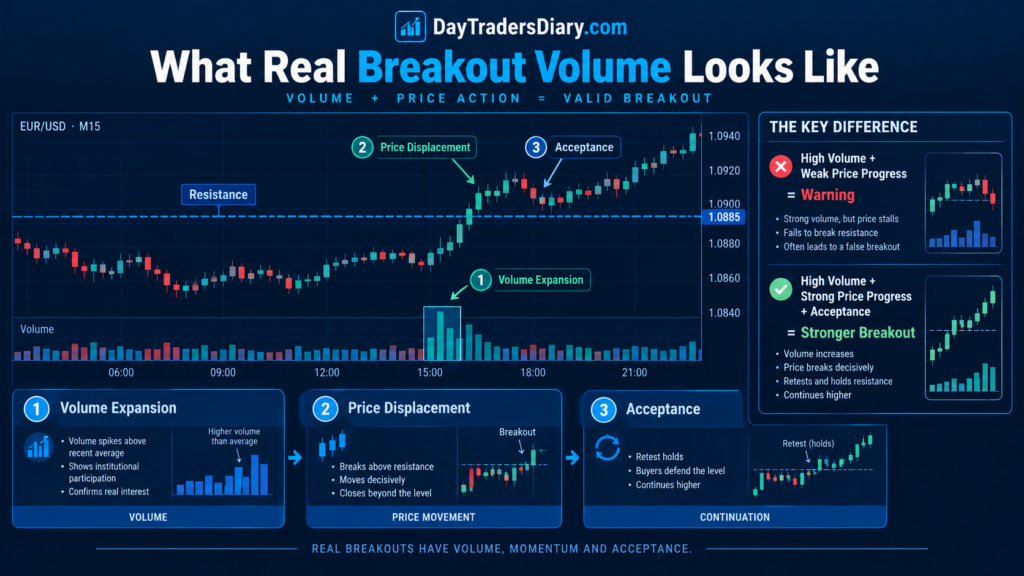
There is volume expansion.
There is price displacement.
And there is acceptance.
Volume expansion tells you that participation increased.
Price displacement tells you whether that participation actually moved the market.
Acceptance tells you whether the market was willing to remain at the new price area after the initial breakout.
The strongest breakout usually has all three.
Suppose EUR/USD breaks above a resistance level.
The breakout candle trades significantly more volume than recent candles, closes near its high, holds above resistance, and the following candle continues higher without immediately falling back through the level.
That is much more convincing than a candle that produces twice as much volume but closes near its midpoint and immediately returns below resistance.
Both have high volume.
Only one demonstrates efficient directional progress.
That distinction is the foundation of a useful breakout volume real forex strategy.
The Biggest Mistake: Reading Volume Without Reading Price
I have seen traders spend enormous amounts of time comparing volume bars while barely looking at what price actually accomplished during those bars.
That reverses the priority.
Volume is effort.
Price movement is the result.
The relationship between the two is what matters.
Imagine a resistance level at 1.0850.
EUR/USD breaks to 1.0870.
The breakout candle trades 250% of its recent average volume.
At first glance, this looks excellent.
But the candle eventually closes at 1.0854.
Price traveled 20 pips above resistance but retained only 4 pips by the close.
That should immediately change your interpretation.
There was enormous participation.
But the market did not retain much of the upward displacement.
Now imagine another breakout where volume reaches only 170% of average, price moves 12 pips through resistance, closes near the high, retests the level, holds, and continues.
The second breakout may be healthier even though its volume spike is smaller.
This is why I prefer volume efficiency over raw volume.
A simple conceptual measurement is:
Volume Efficiency = Price Displacement ÷ Relative Volume
You do not need to treat this as a perfect mathematical indicator. It is a way of forcing yourself to ask a better question.
How much price progress did the market produce, given the level of participation?
What Research Says About Volume and Liquidity
CME Group defines futures volume as the number of contracts traded and notes that traders use volume to gauge market interest and identify periods when a futures contract is more liquid. In other words, volume provides information about participation, but it is not itself a directional prediction.
That distinction matters enormously for breakout traders.
If volume meant “buyers are winning,” every major volume spike would produce continuation.
Markets do not behave that way.
CME’s research on liquidity also makes an important point: volume and order-book depth should not be treated as identical measurements of liquidity. During periods of extreme volatility, CME found situations where volume increased substantially while displayed order-book depth declined dramatically.
For a day trader, this is a valuable warning.
More activity does not automatically mean easier execution or stronger directional conviction.
A market can become extremely active precisely because participants disagree aggressively about value.
The FX market makes this even more important.
The BIS describes spot FX as an over-the-counter, decentralized, and fragmented market rather than a single centralized exchange. Its 2025 research also notes that dealers execute a large share of customer trades through internal liquidity pools.
So if you trade forex, you need to be careful with the phrase “real volume.”
There is no single centralized volume number that represents all EUR/USD transactions worldwide.
Depending on your platform, you may be looking at tick volume, broker-specific activity, futures volume, or another proxy.
That does not make the data useless.
It means you need to understand what your volume measurement actually represents.
Forex Volume Is Different From Futures Volume
This is one of the most important points for anyone searching for breakout volume real forex strategies.
On a centralized futures exchange, contract volume is directly tied to transactions recorded by that exchange.
Spot forex is different.
The global FX market is decentralized.
Your retail platform may show tick volume, which measures changes in quoted prices rather than a complete count of global transactions.
That means you should not say:
“EUR/USD volume increased, therefore institutions bought EUR/USD.”
You do not have enough information to make that conclusion from ordinary retail forex volume.
A better interpretation is:
“Activity on my data feed increased significantly while price broke the level.”
That is useful.
Then you validate the breakout through price behavior.
This is one reason traders using forex volume should combine volume with structure, range expansion, candle closes, retests, and follow-through rather than treating a volume histogram as proof of institutional participation.
The Five-Part Real Breakout Volume Test
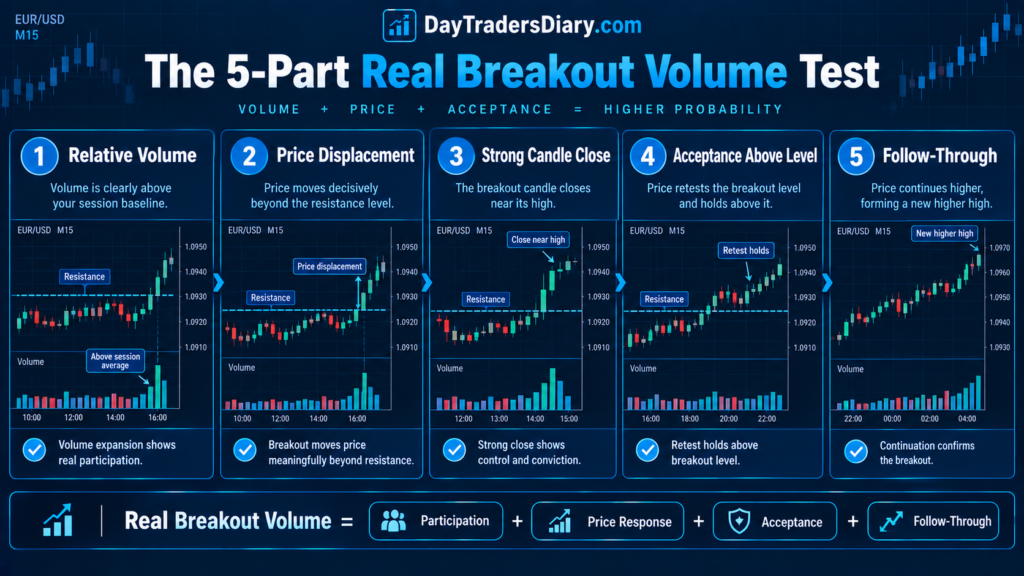
A useful breakout volume filter should answer 5 questions.
First, was there a real increase in participation over usual conditions?
Second, was there a real displacement effect of price?
Third, did the breakout candle close in the direction of the breakout?
Fourth, did price remain beyond the broken level?
Fifth, did the following price action confirm or reject the initial move?
The fifth question is often the one traders skip.
And that is where much of the information is.
The initial breakout is an event.
The reaction immediately afterward is evidence.
Step One: Measure Relative Volume, Not Raw Volume
A volume number means almost nothing without context.
Suppose today’s breakout candle has 80,000 units of volume.
Is that high?
You cannot know.
Perhaps the previous candles averaged 20,000.
Then it is significant.
Perhaps they averaged 150,000.
Then it is actually below normal.
This is why relative volume is more useful.
A simple measurement is:
Relative Volume = Current Volume ÷ Average Recent Volume
Suppose the current breakout candle produces 180,000 units, while the previous 20 comparable candles averaged 90,000 units.
Relative volume is:
180,000 ÷ 90,000 = 2.0
The breakout occurred with approximately twice the normal activity.
That is meaningful information.
But it is still not a confirmation.
It is only the beginning of the analysis.
Step Two: Ask What the Volume Produced
Now, examine the price.
Suppose the relative volume is 2.0.
The market breaks resistance and travels 15 pips.
That sounds good.
But if the candle has a huge upper wick and closes only 2 pips above resistance, the quality of the breakout is questionable.
Now consider another 2.0 relative-volume candle that travels 15 pips and closes within the top 10% of its range.
That is a different event.
The volume was similar.
The price response was different.
This is why I like to compare volume expansion with range expansion.
The practical measurement is:
Relative Volume = Breakout Candle Range / Range Efficiency
Again, this is not intended to be a miraculous indicator.
It’s a structure.
“Volume doubles but candle range hardly changes? Investigate.
If volume doubles and range increases a lot with a powerful candle closure, continuation becomes more likely.
Step Three: Study Closing Location
Closing location is one of the simplest breakout clues and one of the most ignored.
A candle that breaks resistance and closes near its high demonstrates something very different from one that breaks resistance and closes near its midpoint.
You can quantify this.
For a bullish breakout:
Close Location = (Close − Low) ÷ (High − Low)
A result close to 1 means the candle closed near its high.
A result close to 0 means it closed near its low.
Suppose a breakout candle has:
High = 1.0875
Low = 1.0845
Close = 1.0872
The close location is:
(1.0872 − 1.0845) ÷ (1.0875 − 1.0845) = 0.90
The candle closed near the top of its range.
Now imagine another candle with the same high and low but a close at 1.0853.
Its close location is approximately 0.27.
Both candles broke the same resistance.
Both traveled the same range.
But their closing behavior tells very different stories.
This is the kind of detail that separates useful breakout analysis from simply watching volume bars.
Step Four: Look for Acceptance Above the Level
A breakout is not proven simply because the price crosses resistance.
The market needs to demonstrate that participants are willing to transact above that old boundary.
This is what I call acceptance.
Suppose EUR/USD breaks 1.1000.
It reaches 1.1012.
Then the price returns to 1.1001.
Buyers step in.
Price pushes to 1.1020.
That retest has provided useful information.
The old resistance is behaving like support.
Now consider the opposite.
Price breaks 1.1000.
Volume explodes.
Price reaches 1.1015.
Then falls back to 0.9995.
The breakout has been rejected.
The high volume did not save it.
In fact, the combination of high volume and failed acceptance can make the rejection more informative.
That is why DayTradersDiary.com’s guide on identifying fake breakouts with a volume filter is a natural companion to this framework.
The basic premise is simple:
Volume indicates that participation grew. Acceptance tells you whether the market accepted the new price.
Step Five: Watch the Next Two or Three Candles
This is where I disagree with the common idea that traders must enter immediately when volume confirms the breakout.
Sometimes the best information arrives after the breakout candle.
Imagine a bullish breakout.
The first candle has strong volume.
The next candle continues higher.
The third candle pulls back slightly but remains above the breakout level.
That’s good.
Now consider the following:
Large volume on the first candle.
The next candle has an even greater volume.
But the price hardly budges.
The third candle closes back under resistance.
That sequence is telling you something altogether different.
The market needed increasing participation to produce less and less progress.
That is declining efficiency.
And declining efficiency near a breakout can be an early warning.
The Effort-to-Result Test
This is one of the most powerful ways to understand breakout volume.
Think of volume as effort.
Think of price displacement as a result.
When effort increases, and results increase, the move is functioning efficiently.
When effort increases, and results decrease, something is changing.
Consider a three-candle breakout sequence.
The first candle trades 1.5 times average volume and moves 12 pips.
The second trade has an average volume of 2 times and moves 9 pips.
The third trades 2.5 times average volume and moves only 4 pips.
Participation is increasing.
Price efficiency is declining.
That does not automatically mean reversal.
But it tells you that the breakout requires increasingly more participation to achieve increasingly less progress.
That is information.
Real Breakout Volume Usually Changes the Market Structure
A strong breakout should change something.
It might create a new higher high.
It might break a range.
It might convert resistance into support.
It might expand the market’s accepted trading area.
If volume increases but the market structure barely changes, be careful.
Imagine price spends 30 minutes below the resistance.
Volume suddenly doubles.
Price breaks resistance by 3 pips.
Then returns to the same range.
The volume was real.
The activity was real.
But the market did not establish a new structure.
This is why I prefer structural confirmation over volume confirmation.
The question is not:
“Was volume high?”
The question is:
“Did the high-volume event change the market’s behavior?”
A Real Breakout Has a Cost
This is an overlooked concept.
For the price to escape a well-established range, aggressive orders need to consume available liquidity around the boundary.
If there is insufficient participation to sustain the move, the price often reverts toward the previous balance area.
This is why breakouts from important levels should be analyzed in terms of both participation and available liquidity.
CME’s work on liquidity reinforces the broader idea that trading activity, price impact, and available liquidity are related but distinct measurements.
For a day trader, that means a volume spike should make you curious, not automatically bullish or bearish.
Why Volume Spikes Can Appear at the Worst Possible Time
A large-volume spike near resistance can indicate aggressive buying.
But it can also represent buyers entering at exactly the level where existing holders are happy to sell.
That creates a classic trap.
Price rises through resistance.
Breakout traders buy.
Earlier buyers take profits.
Countertrend traders initiate shorts.
The resulting transactions produce huge volumes.
The breakout trader sees the volume and thinks:
“Confirmation.”
But the volume may actually be evidence of a major inventory transfer.
Again, the solution is not to guess which participant is “smart money.”
You cannot reliably know that from a volume bar.
Instead, watch the result.
Does price hold?
Does the level become accepted?
Does the market continue?
Or does all that activity produce a failed breakout?
Price answers those questions better than the volume bar itself.
The Breakout Volume Sequence I Trust Most
Here’s what a cleaner sequence for a bullish breakout looks like:
Price is going toward a clear resistance.
Activity begins to increase.
“Price breaks the level.
The volume is increasing compared to its recent baseline.
The breakout candle closes strong.
The price does not simply go back to the old trading range.
Re-tests are on.
The follow-through creates another higher peak.
This is not a guarantee.
But it is a coherent chain of evidence.
The key is that every stage supports the previous one.
The Breakout Volume Sequence I Distrust
The opposite sequence is equally valuable.
Price approaches resistance.
Volume explodes.
Price breaks above resistance.
The breakout candle develops a large upper wick.
The candle closes near the middle of its range.
The next candle cannot extend higher.
Price falls back through resistance.
The following candle accelerates lower.
That is not simply “a breakout that failed.”
It is a case where substantial participation failed to produce acceptance.
That is much more informative.
Do Not Compare Volume Across Sessions Blindly
Volume has a time-of-day pattern.
A volume spike during the first active hour of a major session may be normal.
The same volume reading during a normally quiet period may be extraordinary.
This is why comparing current volume to the previous five candles can sometimes lead to misleading conclusions.
You want to compare like with like.
A London session breakout should ideally be compared with similar London-session observations.
A New York open breakout should be evaluated against the normal activity profile around that time.
This is where your work on session heatmaps for entry timing becomes relevant.
Session context can determine whether a volume increase is genuinely unusual or simply normal market participation.
Volume and Breakout Timing
A breakout occurring at the beginning of a high-liquidity session has a different context from one occurring during a quiet midday period.
This does not mean session-open breakouts are automatically better.
It means the volume needs to be interpreted relative to the environment.
Suppose your normal 5-minute volume around London open is 200,000 units.
A breakout candle produces 250,000.
That is only 1.25 times normal.
Now imagine a midday candle producing 250,000 when the average is 60,000.
That is more than four times normal.
The raw number is identical.
The information is not.
This is why relative volume by session can be much more useful than raw volume.
News Can Completely Distort Breakout Volume
Major economic announcements create another problem.
A huge volume spike during CPI, NFP, FOMC, or central-bank decisions does not necessarily mean a normal breakout setup is receiving healthy confirmation.
“Maybe the market is just repricing fast.
That difference makes a difference.
News can produce:
Big volume.
Big candle.
Wide spreads.
Big slip up.
Rapid reversals.
Temporary liquidity shifts.
If you trade breakouts on important events, you need to differentiate regular breakout participation from event driven activity.
DayTradersDiary.com’s guide on quantifying news volatility before entry is useful here because it treats news as a change in the trading environment rather than merely another item on an economic calendar.
If a volume spike occurs immediately after major news, ask:
Is this breakout volume, or is this information-processing volume?
That single question can prevent many bad entries.
The Volume Confirmation Score
You can turn this into a repeatable decision process.
Imagine giving the breakout five checks.
Relative volume is clearly above its session baseline.
Price displacement is meaningful relative to recent volatility.
The candle closes strongly beyond the level.
The breakout level holds on the first retest.
The next move produces follow-through.
A breakout that satisfies most of these conditions is structurally different from one that only has a large volume bar.
The exact threshold should come from your own testing.
Do not unthinkingly decide that volume must be 150%, 200%, or 300% of the average.
Different instruments behave differently.
The useful threshold is the one that improves your expectancy after costs.
A More Advanced Metric: Volume-to-Range Divergence
Here is a useful idea for experienced traders.
Instead of simply asking whether volume increased, compare the percentage change in volume with the percentage change in range.
Suppose volume increases 100%.
But the candle range increases only 20%.
The market is generating dramatically more activity for relatively little additional movement.
Now consider volume increasing 80% while range increases 100%.
The price response is keeping pace with the increase in participation.
These are different conditions.
You can define a simple conceptual measure:
Volume-Range Divergence = % Change in Volume − % Change in Range
If volume grows significantly faster than range the number becomes extremely positive.
This does not necessarily predict a reversal.
It tells you to check whether absorption or opposing liquidity is blocking additional price displacement.
This is particularly useful near major support and resistance.
Do Not Use Volume as a Directional Indicator
This sounds obvious.
It is not.
A volume bar has no inherent bullish or bearish meaning.
Every transaction involves both sides.
Someone is buying.
Selling is happening.
The rise in volume suggests there were more contracts or quote activity engaged, depending on the market and data source.
Participation and pricing interact to derive the directional interpretation.
This is why “the statement high volume means buying pressure” is incomplete.
High volume means high participation.
The price response tells you which side appears to be controlling the auction.
Even that conclusion should remain probabilistic.
The Retest Is Often More Valuable Than the Breakout Candle
One of the biggest improvements you can make is to stop treating the breakout candle as the entire setup.
The breakout candle tells you the market crossed the level.
The retest shows you whether the level has changed function.
If resistance was 1.3000.
Volume Pricing Available at Discount.
Then the price goes back to 1.3002.
If sellers can’t push it down below 1.3000 and buyers take control soon then you have proof of acceptance.
That is often more useful than staring at the original volume spike.
It also gives you a better risk location.
Instead of entering at the most emotional part of the breakout, you may be able to enter closer to the retest with a structurally defined invalidation level.
That can improve the reward-to-risk relationship.
The Danger of Entering on the Largest Volume Candle
The largest volume candle often attracts the most attention.
That is exactly why it can be dangerous.
If the breakout candle is already exceptionally large, you may be entering after a substantial portion of the expected movement has already occurred.
This directly relates to how to measure entry-delay risk in forex.
The trader sees volume confirmation and thinks they are becoming more certain.
But certainty arrives after the price has already moved.
You have to ask:
Did the additional information justify the additional entry cost?
Sometimes it does.
Sometimes the market has already consumed most of the opportunity.
Breakout Quality Versus Breakout Speed
A fast breakout is not automatically a high-quality breakout.
A slower breakout can sometimes be healthier.
Imagine it breaks resistance and goes 20 pips in 30 seconds.
The candle is far from the breakout level.
That can be a strong thing.”
But it might also lead to instant fatigue.
Now envision another breakout that jumps 20 pips in a few minutes, consistently holds above the level, and builds higher lows.
The second breakout may offer better execution even though it looks less exciting.
This is one of the psychological differences between professional trading and reactive trading.
Professionals are not paid for finding the most exciting candle.
They are paid for finding conditions where the expected reward justifies the uncertainty.
Risk Management Starts With the Breakout Structure
Once you believe a breakout is genuine, the next question is not “How much can I make?”
It is:
Where is the breakout actually invalidated?
If the breakout level is 1.1000 and the price retests 1.0998 before recovering, you need to understand whether that is normal noise or a structural failure.
Your stop should be based on the market structure and volatility appropriate to the setup.
It should not be placed at a distance simply because you want to risk a particular dollar amount.
This is where many traders get the sequence backward.
They choose the lot size first.
Then choose a stop that makes the dollar loss comfortable.
Professional risk management works in the opposite direction.
Find the logical invalidation.
Measure the stop.
Then calculate position size.
The Position Size Calculator on DayTradersDiary.com is useful for this exact reason. It connects account risk, stop distance, and position size, rather than leaving sizing to emotion.
What If the Breakout Volume Is Real but the Trade Is Still Bad?
This is an important distinction.
A breakout can be genuine and still be a poor trade.
Suppose resistance breaks on excellent volume.
Acceptance is strong.
Follow-through is strong.
Everything looks legitimate.
But the price has already traveled 90% of your normal target before you enter.
The breakout is real.
Your entry is still poor.
This is why breakout confirmation should never replace reward-to-risk analysis.
You can correctly identify a real breakout and still lose money because you entered too late.
The objective is not merely to identify real breakouts.
It is to participate when the remaining opportunity justifies the remaining risk.
Journaling Real Breakout Volume
If you want to know whether breakout volume actually improves your strategy, you need to journal it.
Do not record only whether the volume was “high.”
Record the numbers.
Note the breakout level down.
Watch the average volume baseline.”
Record relative volume.
Record the breakout candle range.
Location Record Close.
Set a greater-than-the-level distance.
– Whether the first retest was given.
Record follow-through after five, ten, and fifteen minutes.
Record MAE.
Record MFE.
Record the result in R.
Then separate the trades into groups.
You may discover that a volume above 2 times the average does not improve your results.
Perhaps your best trades occur when volume is between 1.3 and 2.0 times average, and price closes strongly.
Or perhaps extreme volume works very well during the London open but poorly during midday.
That is exactly the kind of information that generic trading education cannot give you.
Your own data can.
The downloadable Trade Journal Template provides a useful starting point for tracking execution and performance. DayTradersDiary.com’s journal framework emphasizes using the journal as a feedback loop rather than merely recording wins and losses.
Backtest the Volume Condition Separately
This is where many traders make another mistake.
They backtest their breakout strategy and then assume volume confirmation improves it.
You need to test the filter independently.
Compare:
Breakouts, no volume filter.
Breakouts with moderate relative volume confirmation.
Breakouts with significant relative volume confirmation.
Volume plus acceptance on breakouts.
High volume breakouts + immediate retest failure
Now you are testing a hypothesis.
That is much more useful than simply adding a volume indicator and visually deciding that the chart “looks better.”
DayTradersDiary.com’s guide to backtesting a day trading strategy emphasizes realistic execution, market conditions, and forward validation. Those principles are particularly important when testing volume, as volume behavior can vary dramatically across sessions and market regimes.
Your Most Important Metric May Be Follow-Through
Win rate is useful.
Expectancy is more useful.
But for breakout volume, I would add another metric:
Follow-through probability.
Suppose 100 breakouts occur with relative volume above your chosen threshold.
How many make it to 0.5R at least before coming back through the breakout level?
That is unlike lower-volume breakouts.
Maybe:
68% chance of 0.5R continuation on breakouts on high volume.
It does it 54% of the time on moderate volume breakouts.
Low-volume breakouts achieve it 41% of the time.
That gives your volume filter a practical purpose.
You are not claiming that high volume means the breakout will succeed.
You are measuring whether high volume changes the probability of meaningful follow-through.
That is a much more defensible trading model.
Real Breakout Volume Needs Context
The same volume behavior can mean different things in different environments.
A breakout during a strong trend is different from one within a broad range.
A breakout immediately after news is different from a breakout during normal trading.
A breakout after a prolonged compression is different from a breakout after three already-extended momentum candles.
A breakout at a major daily level is different from one occurring in the middle of nowhere.
This is why volume should be interpreted as one layer of evidence.
The strongest framework combines:
Market structure.
Location.
Session.
Volatility.
Relative volume.
Price displacement.
Closing location.
Acceptance.
Follow-through.
Execution cost.
The more of these you agree with, the more confidence you can reasonably have.
When High Volume Is Actually a Warning
This deserves its own section because it is one of the most useful contrarian ideas.
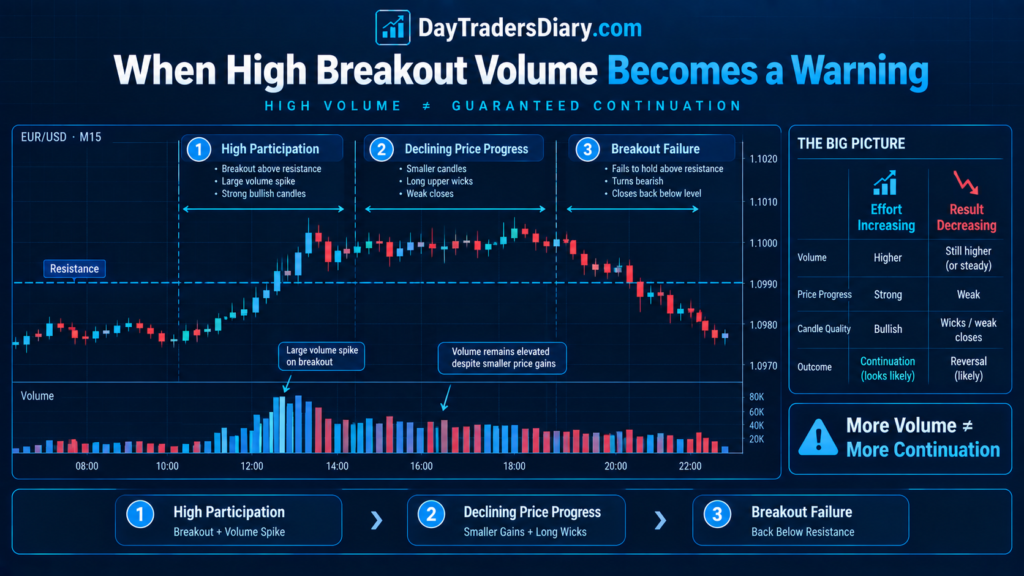
High volume can become a warning when the market repeatedly fails to make proportional progress.
Imagine three bullish candles.
The first move is 15 pips on 1.5 times normal volume.
The second move is 10 pips on 2 times the volume.
The third move is 3 pips on 3 times the volume.
Participation is increasing.
Efficiency is collapsing.
If the third candle also has a long upper wick and closes back near the breakout level, the situation becomes even more interesting.
This does not mean “short immediately.”
It means the market is showing evidence that additional participation is no longer producing equivalent upward progress.
That is often the point where breakout traders should stop becoming more confident and start becoming more selective.
The Psychology Behind Volume Confirmation
There is a psychological reason traders love volume confirmation.
It allows.
The trader sees a break.
They stop.
Then the volume goes wild.
Now they feel vindicated.
They come in.
But confirmation can become a psychological trap. This is because the market sometimes gives the most visually convincing information after much of the move has already taken place.
The trader feels safer precisely when the entry becomes more expensive.
This is why I recommend separating confirmation quality from entry quality.
A breakout can become more convincing while simultaneously becoming less attractive to enter.
Those are not contradictory.
They often happen at the same time.
Scaling the Strategy Beyond Personal Capital
Eventually, a trader with a genuinely repeatable breakout process faces a different problem.
Capital.
You may have a statistically proven approach, meticulous risk management, and years of experience in front of the screen, but the size of your personal account may still limit the dollar impact of your edge.
This is where trading programs based on evaluation can come into play.
The important distinction is that a prop evaluation should not be used to rescue an untested strategy.
The sequence should be:
Build the strategy.
Test the strategy.
Validate execution.
Control risk.
Then consider scaling capital.
The 5ers is one example of an evaluation-based pathway. Its current High Stakes program uses a two-step evaluation, with unlimited time, a 10% Phase 1 target, a 5% Phase 2 target, a 5% maximum daily loss, and a 10% maximum loss under its current published rules. It also requires at least three profitable trading days.
The current program allows scaling up to $500,000, although the rules, spreads, leverage, and other trading conditions can change, so traders should always verify the current terms before participating.
Other firms use different structures, so the right choice depends on your strategy, instruments, drawdown tolerance, and execution style.
For a breakout trader, this matters especially because a strategy that depends on clean execution around volatile moves must be compatible with the firm’s trading rules.
If your breakout volume strategy has survived a meaningful sample of backtests and forward trades, then exploring a The5ers evaluation can make sense as a capital-scaling step.
The goal is not to trade bigger because you feel confident.
The idea is to get that proven edge to a larger portion of capital, with the same percentage discipline.
Frequently Asked Questions
How can I tell if breakout volume is real in forex?
Don’t judge the volume bar. Compare the volume to its regular session baseline. Then look at price displacement, candle closing location, acceptance above the breakout level and subsequent follow through. Also bear in mind that retail spot volume in forex is typically not a full measure of global FX transactions, but rather a proxy.
Does high volume confirm a breakout?
No. More volume means more participation, not directional success. High volume breakouts can nonetheless fail if price cannot hold the broken level or if very little progress is made relative to activity.
What is the best volume indicator for breakout trading?
There is no one best indicator for everyone, everyplace. All of these techniques can be useful but what really matters is how you interpret volume and use it with price structure and follow-through.
What is relative volume in breakout trading?
Relative volume is a comparison of the current volume to some historical average or baseline. For example, if the current breakout candle has volume twice that of comparable recent candles, relative volume is 2.0.
Is tick volume reliable for forex?
Tick volume can be useful as a measure of activity on a particular broker or data feed. Still, it is not equivalent to centralized exchange volume for the entire spot FX market. It should therefore be used as a contextual participation measure rather than proof of global institutional buying or selling.
Can high volume signal a false breakout?
Yes. High volume with bad price advancement Weak closure Long rejection wicks Failure to hold the breakout level Can be a warning that strong participation did not yield durable acceptance.
Should I enter immediately when breakout volume spikes?
Not neccessarily. A volume increase can add to your confidence in the breakout, but the price action at the same time can ruin your entry. Sometimes the retest is a better combination of confirmation and danger location.
How many candles should I wait after a breakout?
There isn’t one-size-fits-all. The correct wait time depends on the plan and time scale. Or, use immediate entry, first-retest entry, or confirmation after follow-through to see which works best for your specific setup, instead of waiting for two or three candles.
Can volume predict breakout direction?
Volume is not a good predictor of direction. It is a measure of involvement. Directional interpretation is based on the relationship between volume, price fluctuation, structure, location, and eventual acceptance.
Final Thoughts
The mistake is not using volume.
The mistake is asking a volume to answer a question it cannot answer on its own.
A volume spike can tell you that something important happened.
It cannot automatically tell you what that something means.
The actual information comes when you link involvement to outcome.
Was the price moving efficiently?
“And did the candle close strong?
“Did the breakout level hold?
Are market prices moving outside of the old range?
Did follow-through appear?
Or did enormous participation produce very little lasting progress?
That is the difference between watching volume and reading volume.
For your next 20 breakout trades, make one change to your journal.
Don’t just say the breakout volume was large, normal or low.
Relative volume, breakout range, closing position, distance beyond level, first retest result and five minute follow through.
Then compare the numbers.
You may discover that the volume threshold you thought mattered is almost irrelevant.
Or you may discover something much more valuable: your best breakouts have a very specific relationship between participation and price displacement.
That relationship is your edge.
And once you can describe it numerically, you can test it, refine it, and eventually scale it.
For your next read, continue with How To Judge Breakout Exhaustion. The two concepts fit together naturally because knowing when volume supports continuation is only half the problem. You also need to recognize when increasing participation is producing less and less price progress.