
You probably know the setup.
Price breaks thru resistance. Breakout candle looks good. Volume surge. You go in since everything seems to be pointing to the move.
Then the next candle closes back below the breakout level.
A few seconds later, the market is moving in the opposite direction, and you’re sitting there wondering how a breakout with “strong volume” could fail so quickly.
This is where many traders misunderstand volume.
High volume does not automatically validate a breakout.
Sometimes, high volume is exactly what makes a failed breakout interesting.
The better question is not, “Did volume increase?”
The more relevant question is:
“What did that volume do to price?”
That difference changes everything.
If a breakout has big volume, breaks thru the resistance, stays above the level, builds acceptance and climbs higher, it’s telling you something completely different to a breakout that has massive volume but can’t stay above the level.
The first is potential acceptance.
The second may be absorption, exhaustion, trapped traders, or simply a failed attempt to attract enough follow-through.
This guide develops a practical fake breakout volume filter around that idea. Rather than treating volume as a green light or red light, we will use the relationship between volume, price displacement, closing location, retests, and follow-through to determine whether a breakout deserves to be trusted.
The method is especially useful for active day traders because it focuses on what happens immediately after the breakout, when the information becomes more valuable than the initial signal.
The Biggest Mistake: Treating Volume as Confirmation
One of the most prevalent breakout rules is straightforward:
Breakout plus big volume = valid breakout.
That makes sense.
And it’s not complete.
Participation is measured by volume. It does not say who is going to win in the end, buyers or sellers.
Imagine a stock trading around $50.
Resistance sits at $50.20.
The stock pushes through $50.20 and trades to $50.45. Volume suddenly becomes three times the recent average.
A breakout trader sees confirmation.
But suppose the candle closes at $50.22 after reaching $50.45.
That is a completely different event.
The market generated substantial activity but retained very little of the upward price movement.
That should make you curious.
If buyers were truly in control, why did the market give back most of the breakout?
The answer may be that aggressive buying met substantial selling.
This is why I prefer thinking about volume efficiency rather than volume alone.
The question becomes:
How much price progress did the market produce for the amount of volume traded?
That is much more useful.
What Research Tells Us About Volume and Price
The relationship between price and volume has been studied for decades.
Research conducted by the CFA Institute indicated that substantial price moves with inadequate volume support were more likely to partially revert, while strong volume support was associated with greater persistence. The practical takeaway isn’t that high volume guaranties continuance, but volume might give you information about the strength underlying a price move.
That distinction is important for breakout traders.
Volume is evidence.
It is not a verdict.
The CFA Institute’s material on market microstructure also emphasizes that prices and volumes are the result of underlying buying and selling demands interacting through market structure.
For a day trader, this means that a breakout candle should be interpreted as an auction rather than a simple pattern.
Price moves upward because buyers are willing to transact at increasingly higher prices.
But if sellers absorb that demand near the breakout, the market may discover that higher prices are not being accepted.
That is where failed breakouts become particularly interesting.
The SEC has also documented cases where artificial trading activity produced sharp increases in both volume and price, demonstrating an important point for traders: unusually high volume does not, by itself, prove genuine underlying demand.
This does not mean ordinary breakout volume is manipulation.
It means you should stop treating volume as a simple “smart money confirmation” indicator.
Read what price does with the volume.
The Core Idea: Volume Must Produce Acceptance
A legitimate breakout needs more than penetration.
It needs acceptance.
This is one of the most useful concepts you can add to a breakout strategy.
Suppose resistance is at $100.
Price trades to $100.30.
That is penetration.
But if the price quickly falls back below $100, there was no meaningful acceptance above the resistance.
Now suppose price breaks $100, reaches $100.30, pulls back to $100.08, finds buyers, and then pushes toward $100.60.
That sequence tells you something different.
The market has demonstrated that participants are willing to transact above the old resistance.
This creates a simple framework:
Penetration asks whether the price crossed the level.
Acceptance asks whether the market was comfortable staying there.
Continuation asks whether buyers could build on that acceptance.
A fake breakout often fails at the second stage.
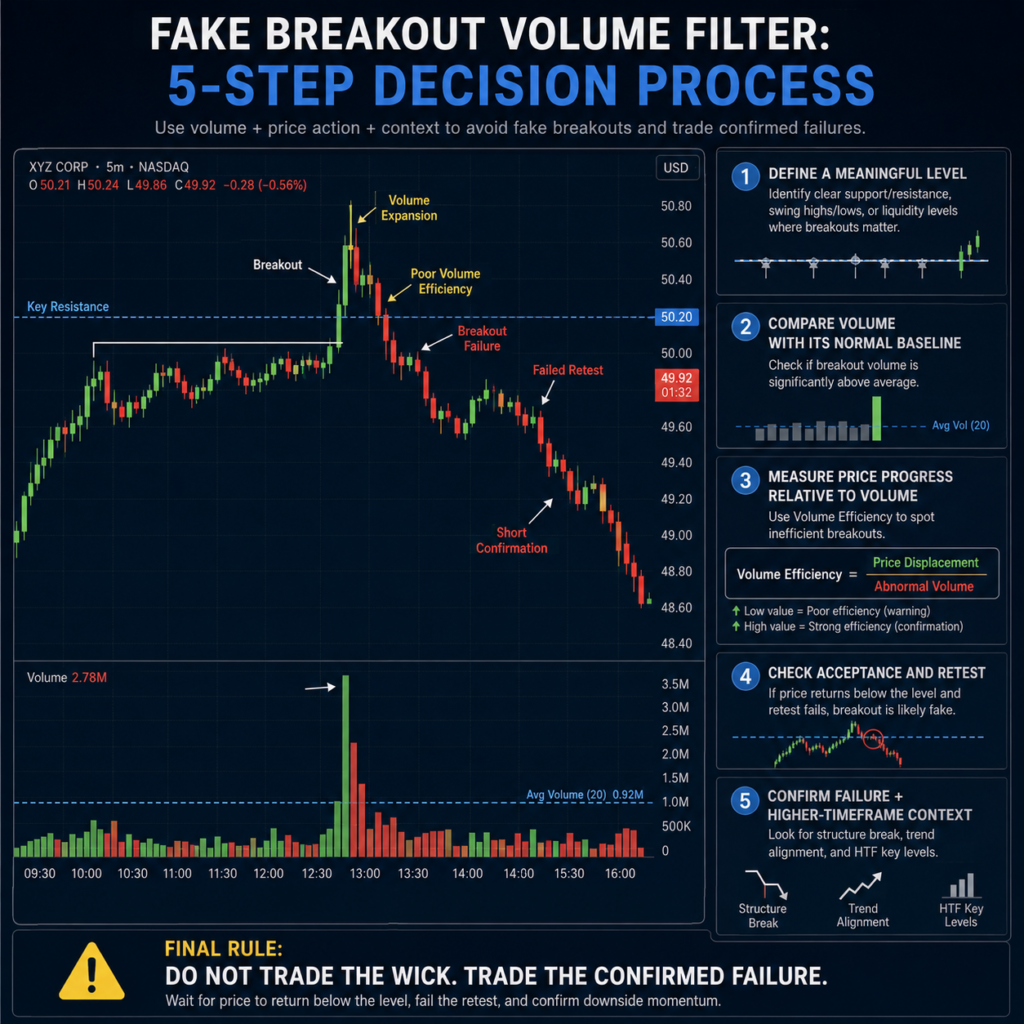
The Fake Breakout Volume Filter
Here is the foundation I would use to label a breakout as authentic.
Begin with the level.
Then assess five things:
Where Was The Price Break?
How much volume did come out?
What kind of price movement did that volume create?
Where did the breakout candle close?
What happened immediately afterward?
The last two questions are often more valuable than the first three.
Let’s look at them individually.
Step One: Define a Meaningful Breakout Level
Not every intraday high deserves to be treated as resistance.
This is where many false breakout strategies start going wrong.
If your level is arbitrary, your definition of failure will also be arbitrary.
A noteworthy breakout level could be a prior session high, starting range high, established intraday resistance, premarket high, consolidation boundary, VWAP-related structure or a strongly defended swing point.
The more obvious the level, the more useful the subsequent behavior can become.
Why?
Because more traders are likely watching it.
That creates a potentially important interaction between liquidity and expectations.
When everyone sees the same resistance, breakout orders, stop orders, profit-taking orders, and fresh short positions can cluster around the same area.
That makes the breakout reaction more informative.
Step Two: Compare Volume With Its Own Baseline
Never ask whether volume is “high” in isolation.
Ask whether the volume is high relative to what is normal for that specific time and instrument.
A volume spike at the market open means something different from a volume spike at 1:30 p.m.
Likewise, a stock that normally trades millions of shares cannot be evaluated using the same volume thresholds as a thinly traded stock.
For practical use, compare breakout volume with a recent moving average or the typical volume for the same period of the session.
The goal is not to find a magical number.
The goal is to identify abnormal participation.
For example, imagine the average five-minute volume is 200,000 shares.
A breakout occurs on 450,000 shares.
That is meaningful participation.
But now examine the result.
If the price moves only 10 cents beyond resistance before closing back near the breakout level, the volume has not produced much directional progress.
That is where the setup becomes interesting.
Step Three: Measure Volume Efficiency
This is the part most breakout strategies overlook.
Consider two breakouts.
Breakout A trades 500,000 shares and advances 50 cents.
Breakout B trades 500,000 shares and advances 8 cents before reversing.
Both have identical volume.
They clearly do not have identical information.
You can think of this informally as:
Volume efficiency = price displacement ÷ abnormal volume
You do not need a complicated mathematical formula.
You want to notice when enormous participation produces surprisingly little directional progress.
That often indicates that the market encountered resistance.
Sometimes that resistance is temporary.
Sometimes it is the beginning of a reversal.
The next price action tells you which.
Step Four: Study the Closing Location
The breakout candle’s close tells you who controlled the auction at the end of that period.
A candle that breaks resistance and closes near its high is different from one that breaks resistance and closes near its low.
Suppose resistance is at $25.
Price reaches $25.60.
Volume explodes.
But the candle closes at $25.08.
That is a warning.
The market traded significantly higher but could not maintain those prices.
The wick is not automatically a short signal.
That is another mistake.
A wick is information, not an entry.
You still need confirmation.
Step Five: Demand a Failure Event
This is where the fake breakout becomes tradable.
Do not short simply because a breakout candle has a large upper wick.
Wait for evidence that the breakout has failed.
A simple example is:
Price breaks resistance.
Volume expands sharply.
Price pushes further above the level.
Buying momentum slows.
Price closes back below resistance.
A subsequent candle fails to reclaim the level.
Now the breakout has changed character.
The trader who bought the breakout is potentially trapped.
The trader who was waiting for confirmation now has a defined invalidation point.
That is a much better trade structure.
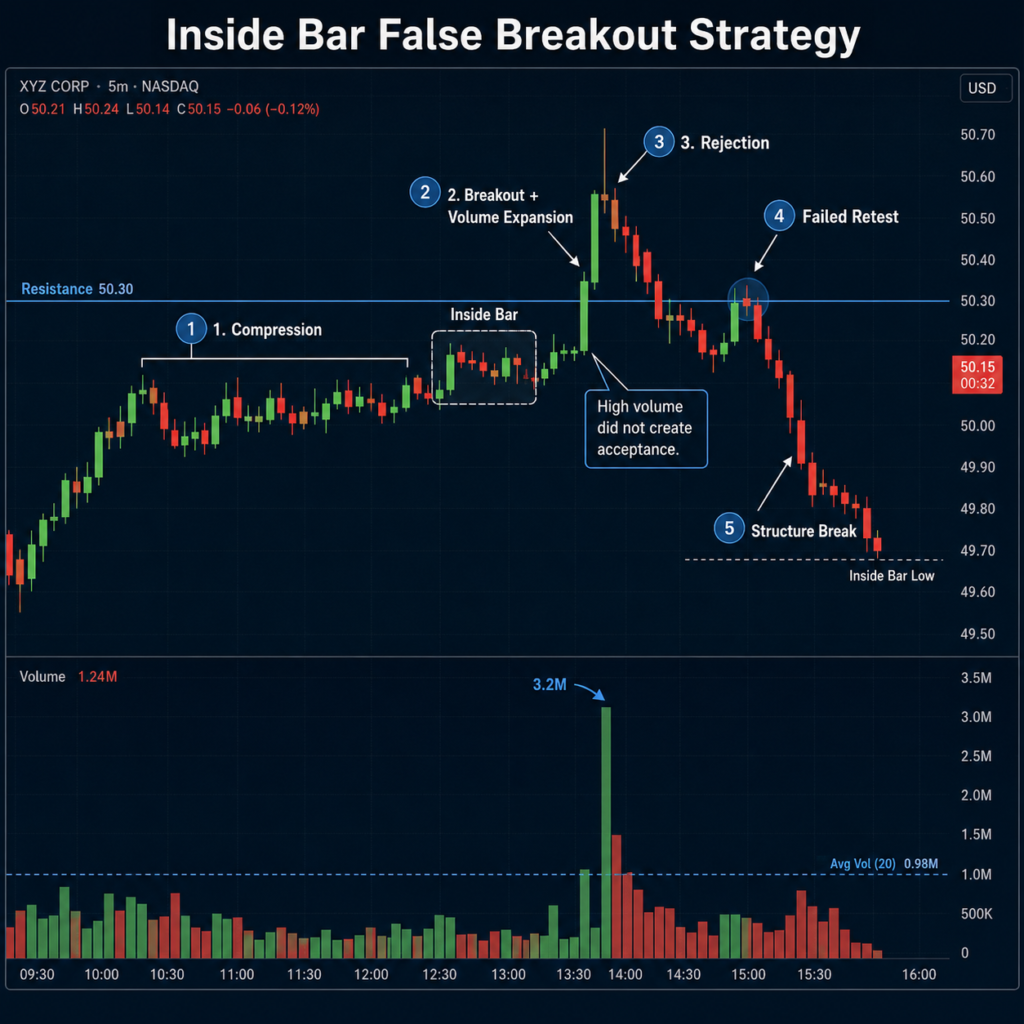
The Inside Bar False Breakout Strategy
The inside bar can be particularly useful in this framework because it creates a compact area where traders are waiting for expansion.
Imagine an inner bar under resistance
Next candle breaks resistance and inside bar simultaneously.
Volume goes up.
Breakout traders come in.
Price then recedes within the range.
That is the first warning.
If price subsequently breaks the inside bar’s low, the failed breakout becomes much more interesting.
Why?
Because the market has now failed in both directions of the original bullish thesis.
The breakout above resistance attracted buyers.
The market rejected that price.
Then, sellers pushed the price back through the internal structure.
This creates a cleaner expression of the inside bar false breakout strategy than simply shorting the first rejection candle.
The secret is sequence.
Compression → break-out → volume growth → rejection → loss of structure
That sequence has a narrative.
A Practical Example
Let’s say a stock is trading for twenty minutes between $48.80 and $49.10.
The high at $49.10 has been tested three times.
Volume gradually declines as the range tightens.
Then the stock breaks $49.10.
Volume jumps to 2.5 times the recent average.
Price reaches $49.35.
At first glance, everything looks bullish.
But then something changes.
Price falls back to $49.05.
The breakout candle closes near its lower third.
The next candle attempts $49.15 but cannot hold.
Then the price trades below $48.95.
This is no longer a breakout entry.
It is potentially a failed breakout setup.
The important observation is that volume did not fail.
The breakout failed despite the volume.
That distinction is the entire strategy.
The “High Volume Trap” Problem
Sometimes, the biggest volume candle is the most dangerous candle to chase.
This happens because breakout traders tend to cluster around obvious levels.
When the level breaks, orders trigger simultaneously.
That creates acceleration.
Acceleration attracts more traders.
More traders create more volume.
Then, early participants begin taking profits.
If there is insufficient new demand, the price reverses.
This is why volume can increase during both continuation and reversal.
The difference is what happens after the volume arrives.
Think of volume as fuel.
Fuel can power a car forward.
But fuel consumption does not tell you whether the driver is actually reaching the destination.
Price progress does.
Three Types of Breakout Volume
It is useful to classify breakout volume into three broad categories.
Expansion Volume
Volume increases and price makes a clean directional progress.
The candle closes strongly.
Follow-through continues.
This is the healthiest breakout condition.
Absorption Volume
Volume becomes unusually large, but price struggles to continue.
Wicks expand.
The candle closes poorly relative to the extreme.
Repeated attempts produce little additional progress.
This is where caution should increase.
Exhaustion Volume
Volume becomes extreme after an already extended move.
Price makes a final push.
Then momentum disappears.
The market reverses sharply.
This is often where late breakout traders become trapped.
These categories are not predictions.
They are observations.
Your trade should be based on what happens next.
The Retest Is More Important Than the Breakout
One of the biggest improvements you can make is to stop treating the initial breakout as the primary decision point.
Instead, pay more attention to the retest.
A legitimate breakout often gives the market an opportunity to test the old resistance.
If resistance becomes support, the breakout thesis strengthens.
If price retests the level and immediately falls back below it, the breakout thesis weakens dramatically.
Consider this sequence:
Resistance: $75.
Breakout: $75.40
Retest: $75.05.
Buyers defend
Price back to $75.50.
That’s constructive.
Now contrast:
Resistance: $75.
breakout $75.40.
Re-Test-$74.95.
Price seeks to recover $75.
No.
Then trades at 74.70.
That is a completely different structure.
The retest has exposed the failure.
Do Not Short Every Failed Breakout
This is another trap.
Once traders learn how fake breakouts work, they often become obsessed with fading them.
That creates a new problem.
Not every failed breakout becomes a large reversal.
Sometimes the price briefly falls below the resistance and then recovers.
Sometimes the breakout is simply consolidating.
Sometimes the broader trend is so strong that sellers cannot create a meaningful downside.
Therefore, the question is not:
“Did the breakout fail?”
It is:
“Did the failed breakout create enough opposing pressure to justify a trade?”
That distinction keeps you out of many low-quality reversals.
The Higher Timeframe Filter
A fake breakout against a strong higher timeframe trend is not automatically a short.
Suppose the five-minute chart shows a powerful uptrend.
The one-minute chart is also making higher highs.
Price breaks a minor intraday resistance level, falls back below it, and creates a small failed breakout.
You might have a textbook-looking fake breakout.
But the broader market is still aggressively bullish.
That failure could be a liquidity sweep before continuation.
Now imagine the same pattern occurs at a major daily resistance level while the five-minute trend is already losing momentum.
The context is completely different.
This is why the best fake breakout volume filter is not a volume indicator.
It is a context-plus-volume framework.
A Simple Decision Tree
When price breaks resistance, ask:
Did volume expand relative to normal activity?
If not, be skeptical of the breakout.
If yes, ask whether the price made efficient progress.
If the price moved strongly and closed near the extreme, allow the breakout to prove itself.
If the price went bad on big volume, wait.
Then ask if the price can remain above the level.
If it is, the breakout is real.
If not, seek a failure framework.
Finally, verify whether the bigger market is confirming the reversal.
If the answer is yes, the failed breakout becomes a candidate.
If the answer is no, stand aside or wait for additional confirmation.
This prevents the common mistake of turning one signal into an automatic trade.
When the Volume Filter Fails
No volume filter works in every market condition.
During major news events, volume can become enormous while price moves violently in both directions.
During the market open, volume is naturally elevated, making historical averages less useful.
In thinly traded stocks, a relatively small number of transactions can create dramatic volume changes.
In futures and forex, volume also requires additional interpretation because the data source and market structure differ. Spot forex, for example, does not have one centralized exchange reporting all global transactions. CFA Institute material on trade strategy and execution highlights the fragmented nature of spot currency markets and the widespread use of electronic execution.
This means you should adapt the filter to the instrument.
Do not unthinkingly copy a volume threshold from a stock strategy into forex.
Risk Management: The Fake Breakout Should Give You a Defined Invalidation
A good failed breakout setup naturally provides a logical stop location.
If you are shorting after price loses the breakout level, your thesis should become invalid if price reclaims the level and holds.
That gives you something valuable:
A clear point where you are wrong.
Do not place the stop at an arbitrary dollar amount simply because it produces a particular position size.
The market structure should determine the invalidation first.
Then, the position size should be calculated from that risk.
This is where most traders miscalculate risk. Using a Position Size Calculator removes guesswork and lets you adjust the number of shares or contracts while keeping account risk consistent.
The important sequence is:
Structure first. Stop second. Position size third.
Never reverse that process.
Why Fake Breakouts Can Produce Attractive Risk-to-Reward
Failed breakouts can offer unusually clean asymmetry because the market has already revealed where the original thesis went wrong.
Suppose the resistance is $100.
Price falls to $101
Then drops again below $100.
Enter short at $99.80 on confirmation.
Your invalidation might be above the failed breakout structure at $100.50.
If the next major support sits at $98.50, you have potentially defined a trade where the risk is relatively small compared with the available downside.
But this only works if the market actually has room to move.
Do not assume every failed breakout will travel to the opposite side of the range.
Measure the available space before entering.
Execution Discipline Matters More Than Pattern Recognition
The pattern is easy to recognize after the fact.
Execution is where traders struggle.
You see a resistance break.
You know it could fail.
But instead of waiting for the reclaim failure, you short immediately because you are convinced the breakout is fake.
Then the price squeezes another 50 cents higher.
Your analysis may eventually become correct.
Your trade is still wrong.
That is the difference between analysis and execution.
A good trader does not need to predict failure.
They need to participate after the probability has shifted.
If you have been working on entry delay risk, this setup provides a useful application. Waiting for confirmation can improve information quality, but waiting too long can destroy the reward-to-risk relationship. The objective is not maximum confirmation. It is sufficient confirmation while the trade still offers an acceptable asymmetry.
Journaling Fake Breakouts Properly
Do not simply record “fake breakout: win” or “fake breakout: loss.”
That is not enough information to improve the strategy.
Record the breakout level.
Record the relative volume.
Record the breakout candle’s range.
Record where the candle closed within its range.
Record the maximum extension beyond the level.
Record whether the price was reclaimed or rejected at the level.
Record the higher timeframe trend.
Record whether there was an obvious catalyst.
Then record the result in R rather than simply dollars.
After 50 or 100 examples, you can start answering questions that matter.
Does the setup perform better during the first hour?
Does it work better at previous-day highs?
Does a two-times-volume spike outperform a one-and-a-half-times spike?
Does the retest produce better entries than the first rejection?
Does the setup perform differently in trending and ranging markets?
That is how a pattern becomes a tested trading process.
The Trade Journal Template on DayTradersDiary.com can be used to structure this review instead of relying on memory.
Your journal should eventually tell you not only what works, but under what conditions it works.
The Metric I Would Add: Maximum Breakout Excursion
There is another metric worth tracking.
Call it Maximum Breakout Excursion, or MBE.
Measure how far the price travelled beyond the breakout level before failing.
If the market breaks at $50 and then goes to $50.80 before reversing, the MBE for a resistance breakout is $0.80.
Why is this significant?
Because a breakthrough that barely breaks resistance before it fails is not the same as a breakout that runs much higher before it collapses.
The second may indicate stronger initial demand followed by exhaustion.
The first may indicate that the breakout never achieved meaningful acceptance.
After enough samples, this metric can help you refine where your entry belongs.
Another Useful Metric: Failure Speed
Measure how long the market takes to return below the breakout level.
A breakout that remains above resistance for fifteen minutes before returning may represent a different phenomenon from one that breaks resistance and collapses within thirty seconds.
Failure speed can help distinguish between:
A genuine breakout followed by a normal pullback.
A failed breakout.
A fast liquidity sweep.
An exhaustion reversal.
This is particularly useful for traders working on one-minute, fifteen-second, or five-second execution charts.
The Psychology of Getting Trapped
The psychological power of a fake breakout comes from commitment.
Once traders enter a breakout, they do not immediately want to admit the idea failed.
They rationalize.
“Just a pullback.”
“Volume is still strong.”
“It will reclaim the level.”
“Market makers are hunting stops.”
The longer the price remains below the breakout level, the more uncomfortable the position becomes.
Eventually, traders exit.
That creates additional selling.
This is why failed breakouts can accelerate once the failure becomes obvious.
Some mysterious market maker action does not necessarily cause the reversal.
It can be a consequence of traders being positioned incorrectly and then forced to unwind.
Your job is not to blame those traders.
Your job is to recognize the change in positioning.
How to Trade Fake Breakout Without Overcomplicating It
If I had to reduce the entire method to one process, it would be this:
Find a meaningful level.
Wait for the price to break it.
Compare breakout volume with normal volume.
Measure how much price progress the volume actually produced.
Study the breakout candle’s closing location.
Wait to see whether the price accepts the new level.
If the price returns through the level, wait for confirmation.
Then evaluate the higher timeframe context.
Only enter if the failed breakout creates enough room for a worthwhile risk-to-reward relationship.
That is the method.
There is no requirement for ten indicators.
There is no need to predict the exact top.
And there is no reason to short simply because a candle has a large wick.
Scaling the Strategy and Scaling Your Capital
Once you have enough journal data to demonstrate that your setup produces positive expectancy, another problem eventually appears.
Your edge may be real, but your account may limit how much you can reasonably make from it.
This is where evaluation programs can become relevant.
The point is not to use a prop firm as a shortcut around developing an edge.
It is the opposite.
A serious evaluation can force you to demonstrate that your strategy survives predefined risk constraints.
The5ers, for example, currently offers evaluation structures with defined daily and maximum loss limits, profit targets, and minimum profitable-day requirements depending on the program. Its High Stakes program describes a two-step evaluation with a 5% maximum daily loss and 10% maximum loss under the current structure.
That type of environment can be useful for a trader whose fake breakout strategy is already tested because the challenge becomes less about finding another setup and more about executing the existing one without violating risk limits.
Other firms use different structures. FTMO, for example, currently offers one-step and two-step evaluation paths with rules covering profit targets, maximum daily loss, maximum loss, and other trading objectives.
The important point is to compare the rules against your actual strategy.
If your fake breakout system sometimes needs wider stops, a firm with restrictive drawdown rules may change your execution.
If your strategy performs best with frequent small trades, minimum-day or consistency requirements can also influence how you trade.
So don’t choose an evaluation because the advertised account size looks attractive.
Choose it only if the rules are compatible with the strategy you have already proven.
If your journal shows stable execution and positive expectancy, you can consider a The5ers evaluation account as a potential professional pathway for scaling. The evaluation should test your discipline, not replace the work required to develop it.
What You Should Not Do
Don’t make a rule that every high-volume breakout is a short.
Institutions sold just because there’s a wick.
Don’t trade against a strong trend just because a small level failed.
Do not enter before the breakout has actually failed.
Do not use a fixed volume multiplier across every instrument and session.
And do not move your stop farther away because you want the reversal to happen eventually.
The last one is especially damaging.
A failed breakout strategy is built around the market, proving the breakout thesis wrong.
If your short thesis is invalidated, exit.
You can always take the next setup.
Frequently Asked Questions
What is a fake breakout volume filter?
A fake breakout volume filter is a way of determining if abnormal trading volume resulted in sustainable price acceptance beyond a key level. High volume is NOT automatic breakout confirmation. Instead, the trader evaluates volume in relation to price advancement, candle closes, retests and follow-through.
Is high volume good for a breakout?
High volume can support a breakout, but it does not guarantee continuation. The important question is what price is accomplished with that volume. Strong volume combined with efficient price progress and acceptance is more constructive than high volume accompanied by rejection.
How can I identify a fake breakout?
Look for a meaningful level being breached, followed by weak price acceptance, a return through the breakout level, and confirmation that the market cannot reclaim it. Volume becomes more useful when it is interpreted alongside these price behaviours.
What is the best fake breakout volume filter?
There is no one perfect filter. A good way to do this is to compare breakout volume to the regular activity of the instrument, look at price displacement, check the location of the candle’s close, and then wait for confirmation via the retest or failure structure.
How does the inside bar false breakout strategy work?
Tight range inner bar. So, if price breaks out of the inside bar at a key level, then pulls in volume, but fails and breaks back into the inside bar structure, then traders can use that failure as confirmation that the original breakout didn’t win acceptance.
Should I short immediately when a breakout fails?
Not normally. A fast move back under resistance can represent a natural pullback. Better confirmation and a more clearly defined invalidation point typically comes from waiting for the market to show that it cannot retake the level.
Does this strategy work on forex?
The underlying price-action concept can be applied to forex, but volume must be interpreted differently because spot forex does not have one centralized exchange representing the entire market. Traders should understand what their broker’s volume data actually represents.
What timeframe is best for fake breakouts?
The pattern can appear on almost any timeframe. For active day traders, higher timeframes are generally more useful for identifying the important level, while lower timeframes can be used to refine the entry and manage execution.
Final Takeaway
The best false breakout traders don’t try to call traps.
They are looking for the market to put in one.
This difference is crucial.
Information is a break out.
Volume = data.
A rejection is information.
A failed retest is information.
The edge comes from combining those pieces in the correct order.
For the next 20 trading sessions, focus on one improvement: stop judging breakout quality from the breakout candle alone.
Record what happened after the breakout.
Did the price accept the level?
Did volume produce meaningful progress?
Did the retest hold?
How quickly did the failure occur?
Where was the higher timeframe trend?
After 20 sessions, review the data.
You may discover that the most profitable part of your strategy is not predicting which breakout will fail.
It is learning to wait until the market has already started proving that it failed.
For your next read, continue with DayTradersDiary.com’s article on breakout exhaustion. The concepts overlap closely, but exhaustion focuses more on the loss of momentum after an extended move, while the framework here focuses on identifying failed acceptance at a specific breakout level.