
A trader can have the right setup, the right direction, the right stop, and still take a bad trade.
The problem may not be the chart.
It may be the spread.
This is especially common with active day traders. They see a breakout forming, notice momentum increasing, and enter immediately. The setup looks clean. But the bid-ask spread has quietly widened.
Five minutes later, the price has moved in the expected direction, yet the position barely makes progress.
The trader thinks the entry was slightly late.
Sometimes it was.
But sometimes the real problem was that the trader entered when the cost of accessing the market was unusually high.
That distinction matters.
A spread is not simply something you pay for and forget. It changes the amount of movement your trade needs before the underlying idea becomes worthwhile.
If you trade a strategy targeting 50 pips, a 1-pip spread may barely matter.
If you trade a strategy targeting 5 pips, that same spread can materially change the economics of the trade.
This is where spread advantage trading becomes useful.
The objective is not to find the absolute lowest spread available every second. That is unrealistic.
The objective is to participate when the current spread is favorable relative to your strategy, expected move, volatility, and execution requirements.
That is a much more useful definition of a good spread in trading.
What Spread Advantage Actually Means
Spread advantage trading means deliberately taking trades when the current bid-ask spread is sufficiently low relative to the expected Opportunity.
The important word is relative.
There is no universal spread that is automatically good or bad.
Suppose EUR/USD is showing a 0.8-pip spread.
For a swing trade targeting 100 pips, that cost is almost irrelevant.
For a scalping strategy targeting 4 pips, it is significant.
The same market condition can therefore be excellent for one strategy and unacceptable for another.
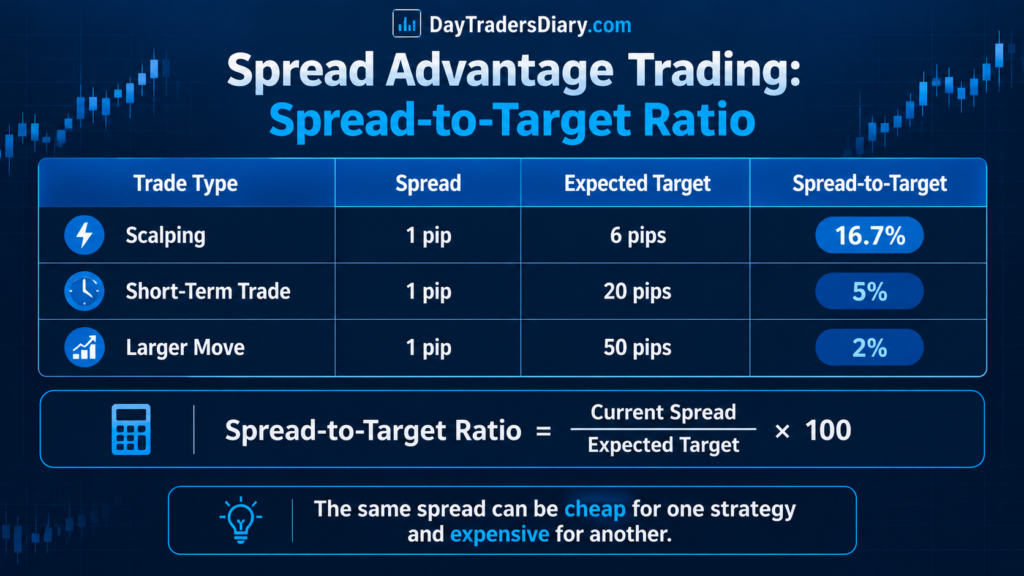
A useful starting measurement is the Spread-to-Target Ratio:
Spread-to-Target Ratio = Current Spread ÷ Expected Price Target × 100
Suppose your EUR/USD setup has a 20-pip target and the spread is 1 pip.
Your ratio is:
1 ÷ 20 × 100 = 5%
Now imagine the same strategy has a 6-pip target.
The ratio becomes:
1 ÷ 6 × 100 = 16.7%
Nothing about the spread changed.
The Opportunity changed.
This is one of the most important ideas in spread advantage trading. Traders often ask, “What is a good spread?”
The better question is:
“Is this spread small enough for the trade I am trying to make?”
Why the Lowest Spread Is Not Always the Best Trading Condition
This is where traders can become too simplistic.
They see a very tight spread and assume the market is safe to trade.
Not necessarily.
A tight spread can occur immediately before an aggressive price move.
A wider spread can sometimes be associated with temporary uncertainty, news, reduced liquidity, or an approaching market transition.
Therefore, spread should never be analyzed independently.
You want to understand the relationship between:
Spread + volatility + liquidity + expected movement + execution method.
Imagine EUR/USD normally trades with a 0.7-pip spread during your preferred session.
You see the spread suddenly drop to 0.4 pips.
That looks attractive.
But if the price is moving violently around a major economic release, the displayed spread at one moment tells you very little about what your actual fill will look like.
The opposite can also happen.
A spread may temporarily widen from 0.7 to 1.2 pips while liquidity is transitioning, then normalize quickly as the market becomes more active.
The professional response is not automatically “trade” or “do not trade.”
It is to understand why the spread changed.
That is what separates spread analysis from simply watching a number on the screen.
The Research Supports the Importance of Spread
The relationship between liquidity and spread is well established.
CME Group describes a tight bid-offer spread as one of the key characteristics traders look for when assessing a market, alongside liquidity and trading hours. It also explains that traders use narrow spreads, volume, open interest, and market depth as indicators of liquidity.
CME’s liquidity tools go further by measuring not only bid-ask spreads but also book depth and cost to trade. This is important because a narrow top-of-book spread does not tell you the entire cost of executing a larger order.
For a day trader, the practical lesson is straightforward.
Spread is one visible measurement of liquidity, but execution quality is larger than the spread alone.
The Bank for International Settlements provides another important perspective. Its research on FX execution describes the foreign exchange market as decentralized and fragmented, with trades occurring across dealers and electronic venues. In its analysis of the 2025 FX market, liquidity conditions remained relatively resilient even during a period of elevated volatility, with bid-ask spreads showing resilience across several FX segments.
That’s important because traders often assume volatility inherently makes spreads ineffective.
The relationship is more complex.
Markets can be quite volatile and liquidity can be relatively functional. What counts is the precise instrument, venue, time of day, news atmosphere and conditions of execution.
CME’s recent analysis of trading costs also separates transaction fees, bid-ask spread, and holding costs. Its analysis reinforces a point active traders often overlook: the spread is one component of total trading cost, not the entire cost of execution.
CME’s research on the true cost of trading in FX markets
The practical implication is powerful.
Do not build a strategy around the assumption that the quoted spread is the only thing you need to control.
You are trying to control the entire execution environment.
Build a Personal Spread Baseline
This is where most spread advantage strategies become much more useful.
Instead of searching Google for a universal definition of a “good spread,” build your own baseline.
Suppose you trade EUR/USD.
You record the spread every few minutes during the hours when you normally trade.
After several weeks, you may discover something like this:
During your preferred London session, the median spread is 0.7 pips.
During the London-New York overlap, it falls closer to 0.5 pips.
Around certain scheduled economic releases, it expands dramatically.
During quieter periods, it becomes less consistent.
Now you have something much more valuable than a generic internet guideline.
You have your market’s normal spread distribution.
That allows you to define a spread advantage condition.
For example, you might decide that your strategy only trades when the current spread is below the 60th percentile of your historical spread observations for that pair and session.
That is far more intelligent than simply saying:
“I only trade when spread is below 1 pip.“
A fixed threshold ignores time of day.
A percentile adapts to the instrument’s normal behavior.
The Spread Percentile Method
A simple framework is to compute:
Current Spread Percentile = The position of the current spread in the historical spread distribution
Let’s say in your trading window you have 1000 spread observations.
The current spread is 0.6 pips.
Your historical data tells you that 0.6 pips is better than 75% of the observations.
That is a genuine spread advantage.
Now imagine the current spread is 1.4 pips.
Perhaps that is worse than 90% of your historical observations.
The market may still produce a profitable trade.
But your execution environment is statistically unfavorable.
This gives you a decision rule:
Do not ask whether the spread is “small.” Ask whether it is unusually favorable for this market and session.
That is a much stronger framework.
The Spread-to-Risk Ratio Is Even More Important
Target distance is only part of the equation.
You should also compare the spread with your initial risk.
Consider a trade with a 20-pip stop.
If the spread is 1 pip, then the spread represents:
1 ÷ 20 = 5% of planned stop distance
Now imagine a scalping setup with a 6-pip stop.
The same 1-pip spread represents:
1 ÷ 6 = 16.7%
That is a very different trading environment.
This is why the Spread-to-Risk Ratio can be more useful than looking at the spread by itself.
Spread-to-Risk Ratio = Current Spread ÷ Planned Stop Distance × 100
A trader might decide through backtesting that their strategy becomes significantly less attractive once spread consumes more than 10% of the planned risk distance.
That would give them a measurable filter.
Not a feeling.
Not a guess.
A rule.
A Better Spread Advantage Filter
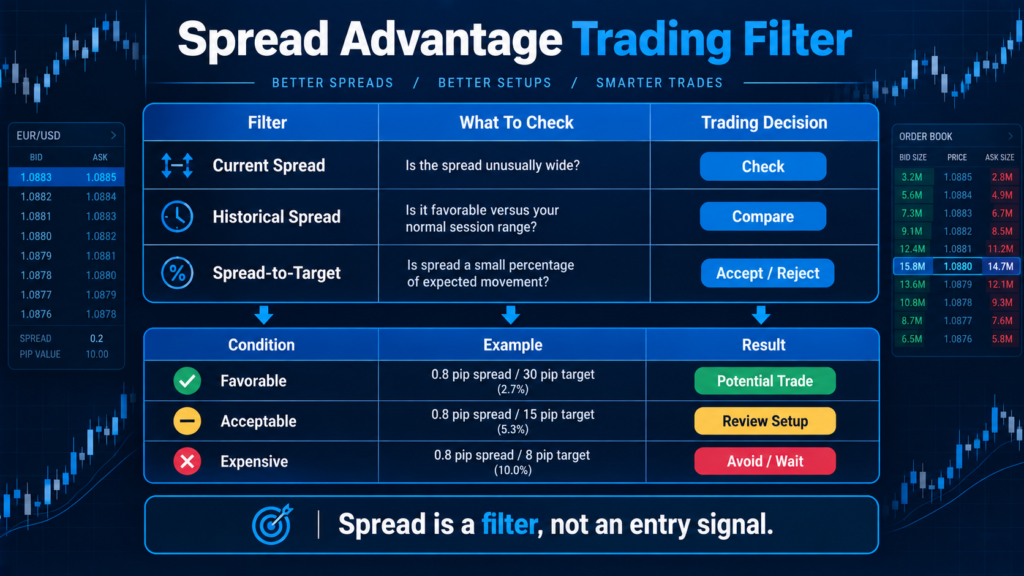
A practical spread advantage framework can combine three measurements.
The first is the current spread.
The second is the spread relative to historical conditions.
The third is the spread relative to the trade’s expected movement.
Imagine you are considering a EUR/USD breakout.
The expected move is 30 pips.
Your stop is 15 pips.
The spread is 0.8 pips.
The spread consumes 2.7% of the expected target and 5.3% of the stop distance.
That is potentially acceptable.
Now imagine another setup targeting 8 pips with a 6-pip stop.
The spread remains 0.8 pips.
It now consumes 10% of the target and 13.3% of the stop distance.
The second trade requires much more precision.
The setup may look identical on the chart.
The trading economics are not identical.
Spread Advantage Should Change Your Entry Decision
This is where the concept becomes actionable.
Suppose your normal breakout system produces an entry at 1.0850.
You are ready to buy.
But the spread suddenly expands.
Instead of acting instantly, you question why.
If the widening is due to a transitory liquidity event and your approach has historically performed poorly in such times, you wait.
You can re-evaluate if the spread normalizes and the arrangement still is architecturally valid.
But there is an important psychological trap here.
Waiting for spread improvement can turn into chasing.
You should never allow “I am waiting for a better spread” to become an excuse for entering after the price has already moved too far.
This is where spread advantage and entry delay risk become connected.
DayTradersDiary.com’s guide on how to measure entry delay risk in forex is particularly relevant because a better spread is not automatically worth a worse entry.
You are balancing two forms of friction.
Execution cost versus price deterioration.
Sometimes waiting saves 0.5 pips in spread but costs 5 pips in entry price.
That is not an advantage.
It is a bad trade-off.
The Spread-Delay Trade-Off
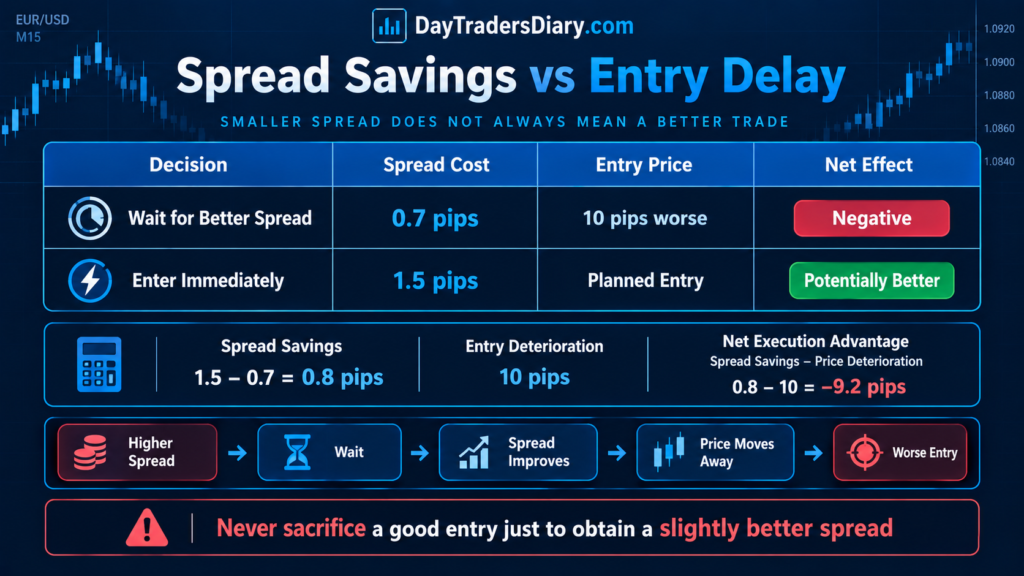
Take the following example.
Your scheduled entrance is at 1.1000 in EUR/USD.
The spread at the minute is 1.5 pips.
You wait.
After ten minutes the spread is 0.7 pips.
That’s better.
But EUR/USD has already moved to 1.1010.
You saved 0.8 pips in spread and sacrificed 10 pips in entry quality.
The trader who focuses only on the spread thinks they have improved execution.
They did not.
That’s why I like to think about net execution quality and not just spread.
A good mental model to have is:
Net Execution Advantage = Spread Savings – Price Deterioration
If the wait saved 0.8 pips but created entrance deterioration of 3 pips then the decision had a net negative advantage of 2.2 pips.
This is a simple calculation, but it prevents a surprisingly common mistake.
When Spread Advantage Is Most Valuable
Spread filtering becomes particularly valuable for strategies with small expected moves.
Scalpers are the obvious example.
If your average winner is 5 to 10 pips, even modest changes in spread can significantly alter the relationship between transaction cost and expected reward.
Short-term breakout traders also need to be careful because they often enter during rapidly changing liquidity conditions.
News traders face another problem.
The spread visible immediately before a major release may be completely different from the execution conditions seconds later.
This is why your guide on how to quantify news volatility before entry fits naturally into a spread-based trading framework.
News does not simply create larger candles.
It can change the execution environment surrounding those candles.
Session Timing Can Create a Natural Spread Advantage
The easiest way to improve spread conditions is often not technical at all.
It is timing.
Liquidity varies throughout the trading day.
The most active periods frequently provide more competitive pricing, although the exact relationship depends on the instrument and market.
This is why session analysis should be part of your spread strategy.
If your journal shows that EUR/USD normally has a tight spread during the London-New York overlap but becomes less attractive during your late-session trading window, you have discovered something useful.
You do not need another indicator.
You need better participation timing.
DayTradersDiary.com’s article on using session heatmaps for entry timing can help extend this idea by combining session behavior with actual trading performance.
The objective is not to memorize that one session is always better.
The objective is to discover when your strategy gets the best combination of liquidity, volatility, and Opportunity.
The Hidden Problem With Broker-Advertised Spreads
Another mistake is assuming the advertised minimum spread represents the spread you actually trade.
It does not necessarily.
A broker may advertise an extremely low minimum spread.
That tells you very little about the spread you experience at the exact moment your strategy generates signals.
Your actual spread depends on the instrument, time, market conditions, broker model, and execution environment.
This is why traders should measure their own live observations.
Suppose your broker advertises EUR/USD from 0.0 pips.
Your journal may reveal that your actual average spread during your trading hours is 0.9 pips.
The second number is the one that matters.
Your strategy does not trade the broker’s marketing page.
It trades the market you actually receive.
Spread Advantage and Market Volatility
A very low spread does not automatically mean low execution risk.
Imagine a quiet market with a 0.5-pip spread.
Price barely moves.
Then imagine a highly active market where the displayed spread is also 0.5 pips.
The second environment can produce much greater slippage and rapid quote changes.
This is why experienced traders look beyond the spread.
The real question is:
Can I execute this trade at a price close enough to my planned price for the setup to remain valid?
That is a much more complete definition of execution quality.
CME’s liquidity research makes this distinction particularly useful because it examines not only bid-ask spreads but also depth and cost to trade. A market can have a competitive top-of-book spread while larger orders face additional execution costs as they consume deeper levels.
For a retail day trader with modest size, depth may not be a major issue in highly liquid markets.
But the principle becomes increasingly important as position size grows.
Do Not Confuse Spread With Slippage
These two costs are related but different.
The spread is the bid-ask differential.
Slippage is the difference between the price you expected or requested and the price at which your order actually executes.
You can have a tight spread and poor execution.
You can also have a wider spread but a controlled execution.
That distinction matters when analyzing your strategy.
Suppose you consistently see a 0.7-pip spread, but your market orders are filled 1.5 pips away from the expected price during volatile periods.
Your effective execution problem is larger than the spread.
This is why your guide to real slippage cost in forex should be read alongside a spread analysis.
You want to measure what the trade actually costs, not what the quote appeared to promise.
A Practical Three-Stage Spread Decision
Before I get into a short-term transaction I boil all this down to three questions.
First:
Is the current spread normal or unusually expensive for this instrument and session?
Second:
Is the spread small relative to my stop and expected target?
Third:
If I wait for a better spread, will the price move enough to destroy my entry advantage?
If the answer to all three is favorable, you have a genuine spread advantage.
If the spread is high but the setup offers an unusually large expected move, the trade may still be valid.
If the spread is tight but the expected move is tiny, the trade may still be poor.
This is why spread should function as a filter, not a standalone entry signal.
Create a Spread Acceptance Zone
One of the best improvements you can make is to stop thinking in terms of one maximum spread.
Create three conditions instead.
Your first condition is an advantage zone.
This is where spreads are historically favorable, and the trade’s expected movement comfortably exceeds execution cost.
Your second condition is an acceptable zone.
The trade can still be taken, but only if the setup quality is unusually strong or the expected reward is sufficiently large.
Your third condition is a no-trade zone.
The spread is statistically expensive relative to the strategy, or the market is behaving in a way that makes execution unreliable.
This creates something important psychologically.
You stop negotiating with yourself.
Instead of saying, “The spread is a little high, but this setup looks really good,” your system already knows what to do.
That reduces discretionary leakage.
Spread Advantage Should Affect Position Size
Spread does not mean you should automatically reduce position size whenever the spread widens.
That can create another problem.
Suppose your strategy normally risks $100.
The spread is slightly wider than normal.
If you simply reduce the position size but keep the same setup, you have reduced dollar risk, but you have not necessarily improved the trade’s expectancy.
Sometimes the correct response is a smaller size.
Sometimes it is a wider structural stop.
Sometimes it is waiting.
Sometimes it skips the trade entirely.
The decision depends on why the spread is unfavorable.
This is where a Position Size Calculator becomes useful.
The calculator should be used after the market gives you a logical stop location, not before.
You determine where the trade becomes invalid.
Then you calculate the position size required to keep risk within your predefined limit.
DayTradersDiary.com’s position sizing framework emphasizes the same principle: account risk, stop distance, and position size should be connected mathematically rather than decided emotionally.
There is another subtle point here.
Do not simply add the quoted spread to each stop distance and believe that is your “true risk”. The exact effect relies on whether you’re long or short, the manner in which the stop is triggered, the quote structure and whether or not the spread changes after entrance.
Instead, use actual execution data from your broker to estimate how much spread and slippage contribute to realized loss.
That produces a much better risk model.
The Real Formula Traders Should Watch
A useful way to think about a short-term trade is:
Net Opportunity = Expected Gross Move − Spread Cost − Slippage − Commission − Other Execution Costs
You do not need perfect precision.
You need enough accuracy to identify when transaction costs become large relative to the Opportunity.
For a strategy with a 5-pip expected move, paying roughly 1 pip of spread is significant.
For a strategy with a 50-pip expected move, it is much less important.
This is why profitable spread advantage trading is fundamentally about cost relative to Opportunity.
Journaling Spread Advantage
Most trading journals do not capture enough execution information.
They record entry, stop, target, and result.
That is useful.
But if you want to determine whether the spread is affecting your edge, your journal needs a little more information.
Record the spread at signal time.
Record the spread at actual entry.
Record the session.
Record the expected target.
Record the planned stop.
Record the actual entry.
Record the actual exit.
Then calculate the spread-to-target and spread-to-risk ratios.
Also, record whether the trade occurred near a major economic release.
After 50 or 100 trades, the patterns become much more interesting.
You might discover that your strategy produces positive expectancy when the spread-to-target ratio is below 8%, but negative expectancy above 12%.
That is valuable.
You have just discovered a strategy-specific execution threshold.
It may be more useful than changing your moving average settings for the tenth time.
The Trade Journal Template on DayTradersDiary.com can be used as the foundation for this process. The site’s trading journal framework emphasizes recording the decision and execution process rather than simply recording whether a trade won or lost.
Turn Spread Data Into an Actual Trading Rule
Suppose you collect 200 trades.
You divide them into three groups.
Trades where the spread-to-target ratio was below 5%.
Trades where it was between 5% and 10%.
Trades >10%.
Now compare expectation.
Maybe you see:
First group gives +0.42R expectancy.
The second gives +0.19R.
The third one gives -0.11R.
Now you have something you can do with.
Your spread filter could become:
Do not enter when the spread consumes more than 10% of the expected target.
Notice what happened.
You did not create the rule because someone on the internet said 10% is ideal.
You created it because your own data showed deterioration beyond that point.
That is how a professional trading rule should be built.
Backtest Spread Conditions, Not Just Price Patterns
This is another major content gap in many trading strategieshttps://daytradersdiary.com/best-day-trading-strategies-for-forex-beginners/.
Traders backtest entries using historical candles.
But many backtests assume unrealistic execution.
A breakout occurs.
The system enters.
The position gets filled exactly where the strategy expects.
That is not necessarily how the live market behaves.
If your strategy is sensitive to spread, your backtesting process should incorporate realistic transaction costs whenever the historical data allows it.
Your article on how to backtest a day trading strategy already emphasizes realistic spreads and slippage.
That principle becomes even more important for a spread-sensitive system.
A strategy that produces 0.10R expectancy before costs may be unusable after realistic execution costs.
A strategy producing 0.80R before costs may have much more room for execution imperfections.
That difference matters when you move from historical testing to live trading.
The Psychological Trap: Waiting for the Perfect Spread
There is another side to this strategy.
Once traders learn that spreads matter, some become obsessed with waiting for the perfect spread.
That creates a new form of hesitation.
The market presents the setup.
The spread is slightly above normal.
The trader waits.
The spread improves.
But the price has already moved.
Then the trader chases.
This is exactly why the spread advantage must have a predefined tolerance.
Your objective is not perfection.
Your objective is positive expected execution.
Suppose your historical research says your strategy remains profitable when the spread consumes up to 8% of the expected target.
If the current ratio is 6%, take the trade if the other conditions are valid.
Do not wait for 4%.
That extra 2% improvement may not justify the risk of losing the entry.
Professionals often lose less money, not because they find perfect conditions, but because they know when conditions are good enough.
Spread Advantage and Trade Frequency
A spread filter will probably reduce the number of your trades.
That is not automatically a problem.
If you normally take 12 trades per day and your spread filter removes four low-quality opportunities, your frequency falls.
But suppose those four trades were responsible for a disproportionate amount of your losses.
Your strategy just improved without changing its entry pattern.
This is one of the most underappreciated forms of strategy optimization.
You are not trying to generate more signals.
You are trying to eliminate situations where your existing edge is being taxed too heavily by execution conditions.
That is a much cleaner approach.
The Connection Between Spread and Trading Psychology
Execution costs can also affect trader behavior.
Suppose a trader expects a position to become profitable quickly.
The trade starts with a visible negative P&L because of the spread.
The trader becomes uncomfortable.
They close early.
Then the price moves in the original direction.
The trader blames the entry.
But the deeper problem may be that the expected trade duration and spread cost were incompatible.
This is why the spread advantage is partly a psychological issue.
If you trade a strategy where the expected movement is tiny, every pip becomes emotionally important.
That encourages micromanagement.
If the strategy has enough room relative to execution cost, small fluctuations become less meaningful.
Better economics can therefore produce better psychological stability.
When You Should Completely Avoid the Trade
There are situations where the correct response is simply no trade.
If the spread is unusually wide relative to historical conditions and your expected move is small, the setup should usually be rejected.
If the spread is increasing rapidly and you can’t see why, be cautious.
If you are trading into a big news event and your system needs tight stops and precise entries you may not get the execution environment you need.
If your broker’s actual spread and slippage during this period have historically destroyed expectancy, there is no reason to keep proving the same lesson with real money.
The important point is that a valid technical setup does not automatically create a valid trade.
The market must also offer acceptable execution economics.
How To Define Your Own Spread Advantage Strategy
A simple process can look like this.
Before the session begins, establish the normal spread range for the instrument.
During the session, compare the current spread with that of the historical baseline.
When a setup appears, calculate the spread-to-target and spread-to-risk ratios.
Check whether volatility or news is changing the execution environment.
Then decide whether waiting for a better spread is likely to improve the trade or create entry deterioration.
Finally, execute only when the setup remains valid, and the execution conditions fall within your predefined tolerance.
That is the entire concept.
It is simple.
The difficult part is having the discipline to skip trades when the conditions are not there.
Why This Matters Even More as You Scale
Small execution inefficiencies become higher financial costs as position size increases.
Suppose a strategy loses an average of 0.3 pips of additional execution quality per trade.
That may seem insignificant.
Now multiply it across hundreds of trades.
Then multiply it again as position size increases.
The absolute dollar impact becomes much more meaningful.
This is one reason serious traders need to understand execution before scaling capital.
A larger account does not fix a weak execution process.
It magnifies it.
This is also where proprietary trading evaluations can become relevant.
The value of an evaluation account is not that it magically creates an edge.
It does not.
The useful concept is capital efficiency.
If you have a tested plan, regulated risk, reliable execution and a proven capacity to work within set limitations, then access to bigger simulated capital allocation offers a systematic way to scale up without simply increasing the amount of personal wealth at risk.
The5ers is one example of this model. Its current High Stakes program is a two-step evaluation with unlimited time, a 10% Phase 1 target, a 5% Phase 2 target, a 5% daily drawdown limit, and a 10% maximum loss limit under its current rules.
Other firms take different approaches. FTMO, for example, currently offers both 1-Step and 2-Step evaluation structures with defined profit targets and loss limits, while its 2-Step process includes a Challenge and Verification phase.
The point is not that one firm is automatically better.
The point is that a serious trader should first build a process that survives realistic execution costs.
Then capital scaling becomes a logical business decision rather than an emotional attempt to make a weak strategy profitable.
If the test results on your own spread filter show an increase in expectancy, consistent risk and repeatability of execution, then a look at a The5ers evaluation account may be a sensible next step to take that strategy to a larger capital base.
Frequently Asked Questions
What is spread advantage trading?
Spread advantage trading is the practice of only taking trades when the current bid-ask spread is favorable compared to the normal spread for the instrument, the projected movement of price, the stop distance, and the parameters of the strategy.
What is a good spread in trading?
There is no universal “good spread.” A spread is good when it is sufficiently small relative to the expected Opportunity. A 1-pip spread may be insignificant for a 100-pip trade but expensive for a 5-pip scalp.
How do I calculate the spread-to-target ratio?
Divide current spread by estimated target distance and multiply by 100.
For example, a 1-pip spread, on a 20-pip target, is a 5% spread-to-target ratio.
Should I avoid trading when spreads widen?
Not at all. First, figure out why the spread widened and whether the predicted change is big enough to justify it. If the approach has performed poorly in the past under those conditions, it could be best to pass on the trade.
Is a low spread always better?
No. A low displayed spread does not guarantee good execution. Slippage, market depth, volatility, and order execution can still affect the actual cost of the trade.
What is the best spread for forex scalping?
The best spread depends on the scalping strategy. Because scalpers usually target smaller movements, spread consumes a larger percentage of expected profit. This makes spread monitoring particularly important for short-term strategies.
Does spread affect stop loss risk?
It can. The impact is dependant on whether the position is long or short, how the broker triggers stops and how the spread performs after entrance. Traders should not blindly add the quoted spread to every stop distance, they rather use actual execution data.
Should spread be included in backtesting?
Yes, especially for scalping and short-term methods. Realistic assumptions of spread, commission and slippage can have a significant effect on strategy anticipation.
Can a spread advantage improve trading psychology?
Yes. Traders who avoid entering under abnormally expensive execution conditions may encounter fewer cases of a little predicted move eaten up by transaction costs. This can help lessen the desire to micromanage the trades.
Final Thoughts
The biggest mistake is treating the spread as a number you glance at before clicking Buy or Sell.
Spread is information.
It tells you something about the current execution environment.
But the number only becomes useful when you put it into context.
A 0.5-pip spread is not automatically good.
A 1.5-pip spread is not automatically bad.
The real question is what that spread represents relative to the Opportunity in front of you.
If your target is 50 pips, 1.5 pips may be manageable.
If your target is 6 pips, the same spread may fundamentally change the trade.
That is the foundation of spread advantage trading.
For the next 30 trading days, record the spread at signal time, the spread at entry, your planned target, your stop distance, and your actual result.
Then calculate your spread-to-target ratio.
Do not change your strategy yet.
Just collect the evidence.
You may discover that your best trades are not simply the ones with the strongest chart patterns.
They may be the trades where the market gave you the right setup at the right time with the right execution conditions.
That is a much more complete definition of an edge.
And once you start thinking that way, you stop asking:
“Should I take this setup?”
You start asking the more professional question:
“Is the opportunity large enough, and is the market cheap enough to access it?”
For the next step, read How To Measure Entry Delay Risk in Forex. Spread advantage, and entry delay are closely connected because waiting for better execution is only useful when the price you sacrifice is smaller than the cost you save.