
A 15-pip stop can be perfectly reasonable at one time of day and completely useless a few hours later.
That is one of the first things traders discover after enough stop-outs.
You enter a clean London breakout.
The setup is valid.
The direction is correct.
Your stop is below the recent swing.
Price moves against you by 12 pips, takes your stop, and then travels exactly where you expected.
Later that day, you take a similar setup during the New York session.
This time, your 15-pip stop is easily survived.
Nothing is wrong with the strategy.
The problem is that you used the same stop-loss assumption in two different market environments.
This is where a session-specific stop loss becomes useful.
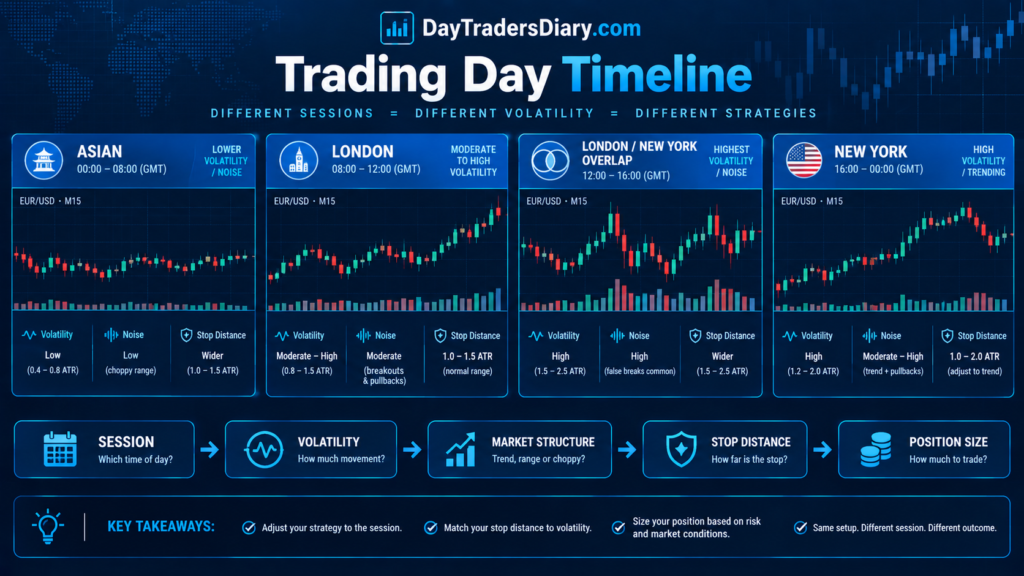
The London session does not behave exactly like the New York session. The Asian session does not behave exactly like London. The overlap between major sessions can produce a completely different combination of volatility, liquidity, and price movement than the quieter periods that follow.
Studies of intraday FX behavior have found strong patterns of time-of-day in activity and volatility. In the case of USD/JPY and EUR/USD, Ito and Hashimoto discovered significant intraday seasonality, including correlations between activity, volatility and bid-ask spreads.
The practical lesson is simple:
If market behavior changes by session, your stop-loss logic should at least be tested on a per-session basis.
That does not mean using a huge stop during volatile hours and a tiny stop during quiet hours.
It means building a stop that reflects the market’s actual behavior you are trading.
What Is a Session-Specific Stop Loss?
A session-specific stop-loss method adjusts the placement and/or size of the stop according to the characteristics of a particular trading session.
The adjustment can be based on several variables.
You might use the average true range during that session.
You might use the typical session swing size.
You might place the stop beyond a session-specific structural level.
You might measure how often normal price excursions reach a certain distance before the trade moves in your intended direction.
You might combine these measurements.
The important point is that the stop is derived from market behavior rather than from an arbitrary number.
A trader who always uses a 20-pip stop is not necessarily disciplined.
They may be consistent in making the same mistake.
A better question is:
How far does price normally move against this type of trade during this session before the original thesis becomes invalid?
That is the question your stop should answer.
Why One Stop Distance Does Not Fit Every Session
Imagine you trade EUR/USD.
During the quieter part of the Asian session, the typical 15-minute candle might have a relatively narrow range.
During the London open, the range expands.
During the London-New York overlap, activity can increase again.
Later in New York, conditions may change once more.
The same 10-pip stop, therefore, has different meanings in each environment.
In a quiet session, 10 pips might represent a large structural move.
During a volatile session, 10 pips might be ordinary market noise.
This is not just a theoretical distinction.
The Bank for International Settlements has described FX liquidity as concentrated in major financial centers, with trading activity and liquidity particularly strong in London and New York.
For a day trader, that means the market’s behavior around a session transition can be fundamentally different from the behavior several hours later.
Your stop should be designed around that reality.
The Biggest Mistake: Changing Stops Without Changing Risk
There is an important distinction between stop distance and dollar risk.
Suppose your normal risk is $100.
You use a 10-pip stop.
If the session requires a 20-pip structural stop, you do not automatically increase your risk to $200.
You decrease the location size.
This is where many traders get the process backward.
They decide:
“I need a bigger stop.”
They then preserve the same lot size.
The trade now risks twice as much.
That is not risk management for the session.
That is simply increasing exposure.
CME Group’s guidance on proper position sizing makes the sequence clear: determine the logical stop location first, then size the position according to the amount of account capital you are willing to risk. CME also specifically warns against placing stops at random levels that can be triggered by normal market movement.
This distinction should sit at the center of your entire stop-loss method.
The market determines the stop distance. Your risk rule determines the position size.
Session Volatility Is the First Variable to Measure
Before designing a session-specific stop, measure the session.
Do not begin with ATR settings.
Begin with data.
Suppose you trade EUR/USD and divide your trading day into Asian, London, and New York periods.
Record the average 5-minute range for each.
You might discover something like this:
Asian session average 5-minute range: 3.5 pips.
London session average 5-minute range: 6.8 pips.
London-New York overlap: 7.5 pips.
Late New York: 4.2 pips.
These numbers are hypothetical, but the principle is important.
A 7-pip stop means something completely different when the typical 5-minute range is 3.5 pips compared with when it is 7.5 pips.
This gives you your first useful session variable:
Typical adverse movement.
That is more relevant to stop placement than simply knowing the average daily ATR.
Use Session-Specific ATR Instead of Blind ATR Multiples
It’s useful because it adjusts for volatility.
But a typical mistake is using the same ATR multiple for any session.
For instance:
“Use 1 ATR per trade.”
That sounds methodical.
It might not be an adaptation.
If your ATR includes periods from several different sessions, it can blend volatility regimes that behave very differently.
A better approach is to calculate ATR from the timeframe and session relevant to your strategy.
Let’s say your 5 minute ATR for EUR/USD during London is 6 pips.
Your setup has to have the stop 1.3 ATR beyond the structural invalidation point.
Which means about 7.8 pips of volatility allowed.
But if the same setup occurs during a much more active overlap where the comparable ATR is 10 pips, unthinkingly using 7.8 pips could place the stop inside ordinary noise.
The important word is comparable.
Compare London with London.
Compare New York with New York.
Compare your chosen timeframe with the timeframe that actually controls the trade.
But ATR Alone Is Not Enough
This is when a lot of articles become overly mechanical.
A stop should not be simply:
Entry − ATR multiplier times
That overlooks the market structure.
If EUR/USD breaks resistance at 1.1000.
You have determined your volatility stop to be 8 pips.
But the nearest meaningful structural invalidation level is 1.0988.
An 8-pip stop would sit at 1.0992.
That may fall within the normal retest range.
Your ATR calculation is not wrong.
Your stop location is wrong for the setup.
The better process is:
Structure first. Volatility second.
Use market structure to determine where the trade idea becomes invalid.
Then use volatility data to determine whether that location is realistic for the current session.
The Three-Layer Stop Framework
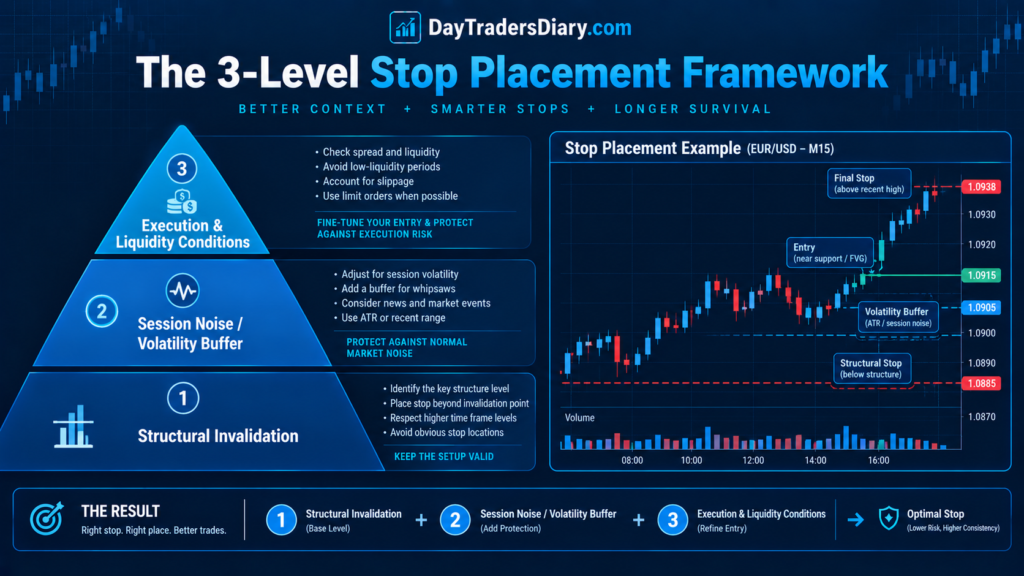
A robust session-specific stop can be built from three layers.
The first layer is structural invalidation.
Where would the original trade thesis be wrong?
The second layer is session noise.
How much adverse movement is normal before a continuation is expected in this session?
The third layer is the actuality of execution.
What are the spread, slippage and volatility conditions around the entry?
Your stop should accommodate all three without exceeding your predefined monetary risk.
That is much more robust than simply saying:
“I use a 15-pip stop.”
Structural Stop Versus Volatility Stop
Consider a London breakout.
EUR/USD breaks above a morning range.
Your entry is 1.0855.
The breakout level is 1.0848.
The nearest meaningful swing low is 1.0839.
The London-session ATR suggests that a normal pullback can easily reach 5-7 pips.
If you put the stop at 1.0848, you are placing it directly on the breakout level.
That might be too tight.
If you place it at 1.0838, the trade has more room to breathe.
But now your stop is 17 pips.
The solution is not necessarily to reject the trade.
Calculate the position size for a 17-pip stop.
If that produces acceptable risk and the expected reward remains attractive, the trade may still qualify.
If the larger stop destroys the reward-to-risk relationship, the trade may not be worth taking.
This is a crucial professional habit:
Do not shrink the stop to fit your desired position size.
Shrink the position size so the correct stop fits your risk budget.
Build a Session Noise Band
One useful method is to estimate the normal adverse movement of your setup during each session.
Imagine you have 200 London-session trades.
For each trade, record the maximum adverse excursion before the trade either hit its target or failed.
Now examine the distribution.
You might discover that 70% of successful trades experience less than 6 pips of adverse movement.
90% experience less than 10 pips.
That gives you useful information.
A stop below 6 pips may be too tight.
A stop around 10 pips may survive most normal fluctuations.
But this does not mean 10 pips is automatically your ideal stop.
You still need structure.
The data tells you how much room your strategy historically needed.
This is a much more powerful way to build a stop than choosing 10 pips because it “looks right.”
MAE Is One of Your Best Stop-Design Tools
Maximum Adverse Excursion, or MAE, measures how far a trade moves against you before it eventually reaches its outcome.
It answers a very practical question:
How much pain does a winning trade normally experience before becoming profitable?
Suppose your London breakout strategy has 100 winning trades.
Their MAE distribution looks like this:
Most winners experience 3 to 8 pips of adverse movement.
A smaller group experiences 9-12 pips.
Very few winners experience more than 14 pips.
That information can help you identify a stop zone.
Perhaps 6 pips is too tight.
Perhaps 10 pips captures most normal noise.
Perhaps beyond 15 pips, the trade is often no longer behaving like a healthy winner.
Now you have evidence.
Your stop is no longer based purely on intuition.
The Important Difference Between MAE and ATR
ATR tells you about market volatility.
MAE tells you about your strategy’s behavior.
That distinction matters.
The market may normally move 10 pips during London.
But your particular setup may only need 5 pips of adverse room before continuing.
Or perhaps your setup routinely experiences 12 pips of adverse movement.
ATR tells you what the market is doing.
MAE tells you what your strategy experiences inside that market.
For stop design, the second measurement can be extremely valuable.
Session-Specific Stop Rules Should Be Strategy-Specific Too
Do not create a one-stop model for every setup.
A London breakout and a New York pullback can have completely different MAE profiles.
A trend continuation trade may tolerate a deeper retracement than a momentum scalp.
A range-reversal trade may require the stop to sit beyond the range extreme.
A news breakout may need an entirely different framework because volatility and slippage can change dramatically.
This is why the phrase “session-specific stop-loss strategy” should never be interpreted as:
“Use one stop size for London, another for New York.”
The more useful interpretation is:
Use session-specific market behavior to calibrate the stop for each setup.
That is much more sophisticated.
London Session Stop-Loss Method
Consider a trader specializing in EUR/USD London breakouts.
The trader discovers that London creates a sharp expansion shortly after the session opens.
The breakout itself can be fast.
Retests are common.
A fixed 5-pip stop is frequently taken before the trend resumes.
After studying 150 trades, the trader finds that winning trades have a median MAE of 4 pips, and the 80th percentile is 8 pips.
The trader could test a stop model in which the stop sits beyond the breakout structure, with a minimum volatility buffer equal to the session’s typical noise.
Now the position size changes according to that stop.
The goal is not to make every trade use the same Distance.
The goal is to ensure that every trade carries approximately the same monetary risk while allowing the market enough room to behave normally.
New York Session Stop-Loss Method
Now imagine the same trader trades EUR/USD during the New York session.
The strategy is a pullback after an impulsive move.
The market may already have completed a significant portion of the move in London.
The volatility profile is different.
A stop based on the London breakout’s MAE would not necessarily make sense.
Instead, the trader measures the MAE of the New York pullback separately.
Perhaps successful pullbacks normally retrace 8 to 14 pips before continuation.
A 5-pip stop would repeatedly fail.
A 12-pip stop may fit the strategy better.
But again, position size must fall to keep dollar risk stable.
This is the core principle of session-specific risk:
Change the Distance without automatically changing the risk.
The Asian Session Requires a Different Question
The Asian session creates another interesting problem.
Many traders assume that because the session is quieter, stops should be tighter.
That can be wrong.
A quieter market can spend long periods rotating inside a narrow range.
A stop placed just outside a minor swing can be vulnerable to repeated range tests.
If you trade an Asian range-reversion strategy, your stop may need to sit outside the actual range structure rather than simply a fixed number of pips beyond your entry.
In other words, lower volatility does not automatically mean tighter stops.
It means the shape of normal price movement is different.
That distinction is important.
Session Transitions Are Their Own Environment
One of the most overlooked periods is the transition between sessions.
Suppose you trade during the final part of Asia and into London.
Your Asian range has formed.
Liquidity begins to change.
London opens.
Price suddenly expands.
A stop based on the Asian range’s typical movement may become too tight once London participation enters.
This is why a session-specific method should also identify transition periods.
Your stop model might have three states:
Pre-London.
London expansion.
London-New York overlap.
This is much more realistic than dividing the day into three fixed boxes and assuming market behavior is constant throughout each.
Session Volatility Should Influence Entry Quality Too
There is another important insight.
Sometimes the correct response to increased volatility is not a wider stop.
It is no trade.
Suppose your normal strategy expects a 12-pip stop.
A sudden expansion in volatility means the logical structural stop is now 25 pips.
You can reduce position size.
But what if the target remains only 30 pips?
Now your reward-to-risk relationship has deteriorated dramatically.
The market has not merely changed your stop.
It has changed the economics of the trade.
This is why stop-loss design and trade selection cannot be separated.
A session-specific stop method should be able to say:
The stop is technically valid, but the trade is no longer attractive.
That is a sign of a mature risk framework.
Use R-Multiples Instead of Comparing Pip Stops
Suppose your London strategy normally incurs a 10-pip risk.
Your New York strategy risks 18 pips.
It would be a mistake to conclude that the New York strategy is “riskier” simply because the stop is wider.
If both trades carry a 0.5% risk to the account, their monetary risk is equivalent.
This is why R-multiples are useful.
A loss is:
−1R
regardless of whether the stop was 5 pips, 10 pips, or 25 pips.
The stop distance changes.
The predefined risk does not.
This makes performance comparisons between sessions much cleaner.
You can then ask:
Does London produce a higher expected return per unit of risk than New York?
That is a much more meaningful question than:
“Which session has smaller stops?”
The Session Stop Formula
There is no universal formula, but a good framework is:
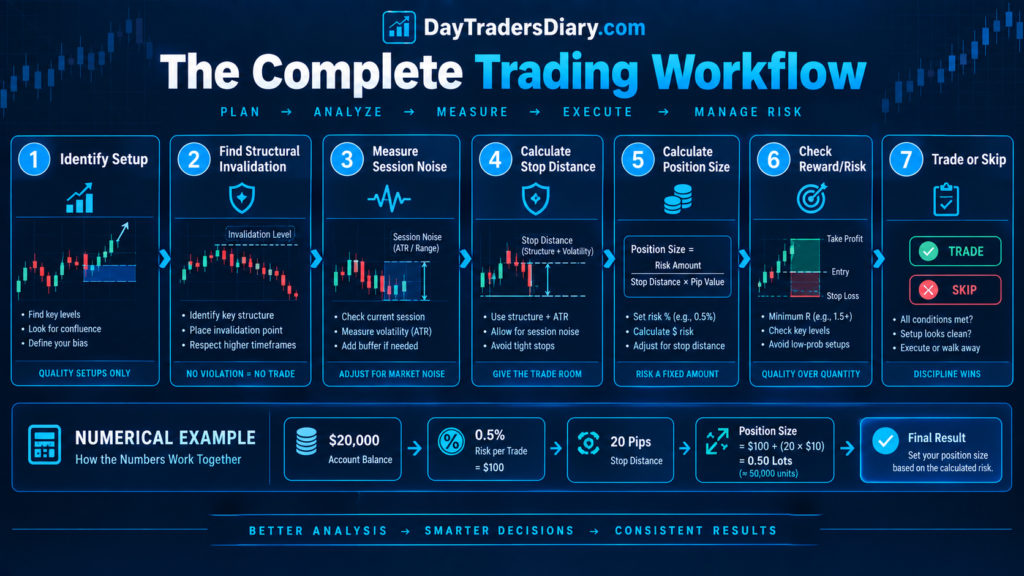
Stop Distance = Structural Invalidation Distance + Session Noise Buffer
The noise buffer can be built on ATR, MAE, recent session range or any other measure of volatility.
For instance:
Entry = 1.1000.
Structural invalidation = 1,0988.
Structural Distance = 12 pips
Session noise buffer = 3 pips.
Stop Distance = 15 pips.
Now determine the position size based on the 15 pip stop and your pre-determined account risk.
This approach allows the market to determine where to place the stop-loss, while your risk framework determines how much you trade.
Do Not Add the Buffer Twice
This is a subtle mistake.
A trader might identify a swing low at 1.0988.
Then calculate an ATR-based stop that already places the stop at 1.0985.
Then add another 5-pip “safety buffer.”
Now the stop sits at 1.0980.
The trader believes they are being conservative.
But they may simply be adding multiple volatility allowances on top of each other.
Your stop model should have a clear hierarchy.
Structure establishes invalidation.
Volatility determines whether the structure has enough breathing room.
You do not need to keep adding Distance just because a larger stop feels safer.
An unnecessarily wide stop can be just as damaging as one that is too tight.
Research: Why Session-Specific Stops Make Sense
Academic research supports the underlying premise that intraday FX behavior is not uniform.
Ito and Hashimoto’s analysis of USD/JPY and EUR/USD found pronounced intraday seasonality in trading activity and volatility. Their research also found a relationship between trading activity, volatility, and bid-ask spreads.
For a day trader, this means the same price movement cannot be interpreted independently of time.
A 10-pip move during one part of the day may be routine.
The same 10-pip move during another period may represent a much larger volatility event.
BIS research also notes that liquidity in FX is concentrated in major financial centers and tends to be particularly strong around London and the London-New York overlap.
That matters because stops interact with liquidity.
A stop is not executed in a vacuum.
The quality of the market around your stop can influence how cleanly you exit.
The research, therefore, supports a broader principle:
Time of day is part of the market environment, and the market environment should influence how risk is structured.
Stop Placement and Liquidity
There is a dangerous misconception that a stop should sit “where everyone else has their stop.”
That is not a strategy.
Your stop should sit where your trade thesis is invalidated, while accounting for normal market noise.
If the market repeatedly sweeps a level before continuing, your data should reveal it.
That is more useful than trying to predict where other traders’ stops are located.
A session-specific approach helps because liquidity conditions can change throughout the day.
A level that holds during a quieter period may be tested aggressively when a major session opens.
This is another reason to analyze stop-outs by session rather than combining all trades into a single performance bucket.
Your Stop-Out May Be Telling You Something Different
When traders get stopped out, they usually ask:
“Was my stop too tight?”
That is only one possibility.
The stop may have been correctly placed, and the setup failed.
The stop may have been too tight.
The entry may have been too late.
The session may have been inappropriate for the strategy.
The volatility regime may have changed.
The position size may have been too large.
The setup may have been low quality.
You need to distinguish these outcomes.
Otherwise, you will eventually widen every stop to avoid being stopped out.
That is not an improvement.
It is avoidance.
Build a Stop-Out Classification System
For every stopped trade, classify the reason.
If the price hit your stop and immediately continued in the original direction, classify it as a possible noise stop.
If the price hit the stop and continued strongly against you, it may have been a legitimate thesis failure.
If the price moved close to the stop before reversing, but your entry occurred unusually late, you may have an entry-quality problem.
If the stop-out happened during a major volatility expansion, it may be an environment problem.
This classification is much more valuable than simply increasing your stop.
Over 100 trades, patterns emerge.
Maybe 60% of your London stop-outs are legitimate failures.
Maybe 30% are noise sweeps.
Maybe 10% are caused by poor entries.
Now you know what to improve.
The Stop Should Reflect the Trade Thesis
This is one of the most important principles in professional stop placement.
Ask:
What must happen for this trade idea to be wrong?
If you are buying a breakout because resistance should become support, your stop should be connected to the failure of that transition.
If you are buying a pullback because a higher-low structure should hold, your stop should be connected to the invalidation of that higher low.
If you are trading a mean-reversion setup, your stop may need to sit beyond the range or volatility boundary that invalidates the reversion thesis.
Session volatility modifies the stop.
It does not create the thesis.
The Position Size Calculator Belongs at the End of the Process
This is where most traders miscalculate risk.
They see a session that requires a wider stop and think:
“I cannot afford that stop.”
Then they tighten it.
The better solution is to calculate the appropriate position size.
If your account is $20,000 and you want to risk 0.5%, your maximum planned loss is $100.
If the logical stop is 20 pips, your position size must be adjusted so that a 20-pip loss is approximately $100, subject to the instrument’s pip value and execution costs.
If the next trade has a 10-pip stop, the position can be larger while maintaining the same account risk.
That is exactly why the Position Size Calculator is useful.
The tool should not tell you where your stop belongs.
Your market analysis should do that.
The calculator should translate your stop distance into an appropriate position size.
CME Group similarly frames position sizing around two inputs: the logical stop location and the amount of account capital the trader is willing to risk.
Session-Specific Stops and Daily Risk
There is another layer that traders often overlook.
Your stop may be correct for the individual trade, but your overall daily risk may become excessive.
Suppose your London setup normally carries a 0.5% risk.
You take three trades.
All three use valid session-specific stops.
You have still exposed the account to a planned risk of 1.5%.
Now imagine the New York session begins.
You see another high-quality setup.
If you treat the New York session as a completely separate opportunity without considering your existing daily exposure, you can unintentionally compound risk.
CME’s risk-management framework specifically encourages traders to define maximum trade loss, maximum day loss, leverage, and account exposure as part of a trading plan.
Your session-specific stop model, therefore, belongs inside a broader daily risk framework.
The Session Risk Budget
A useful concept is a session risk budget.
Suppose your daily maximum planned loss is 2%.
London gets a maximum of 1%.
New York gets the remaining 1%.
The exact allocation depends on your strategy.
If your data shows that 80% of your expectancy comes from London, perhaps most of the risk budget belongs there.
If you perform better in New York, reverse the allocation.
This is not about predicting which session will win today.
It is about allocating risk according to historical opportunity.
That is a much more rational approach.
Session-Specific Stop Loss and Correlation
You also need to think about correlated trades.
Suppose EUR/USD, GBP/USD, and the dollar index are all giving you signals around the London open.
You might think you have three independent trades.
You may actually have one USD thesis expressed three different ways.
Each trade has its own session-specific stop.
But the combined exposure may be much larger than it appears.
This is another reason why stop-loss methodology should not be evaluated on a trade-by-trade basis only.
Measure total exposure.
Your stop controls individual trade risk.
Your portfolio or daily framework controls combined risk.
Journaling Your Session-Specific Stops
The best stop-loss method will eventually come from your own trade data.
Your journal should therefore record more than the final stop distance.
Record the session.
Record the setup type.
Record entry time.
Record entry price.
Record stop distance.
Record structural invalidation level.
Record session ATR.
Record MAE.
Record MFE.
Record whether the stop was hit before the expected move.
Record whether the price subsequently moved in your original direction.
Record the reason for the stop-out.
After enough trades, compare the distributions.
You may discover that London breakout winners have a 7-pip median MAE while New York pullback winners have a 12-pip median MAE.
That immediately tells you something.
Your stop methodology should probably not treat those setups identically.
The Trade Journal Template can be used as the foundation for this process. The important addition is to make session and stop behavior explicit fields rather than treating them as afterthoughts.
Measure Stop Efficiency
A useful metric is:
Stop Efficiency = Median MAE of Winners ÷ Average Stop Distance
Suppose your winning trades have a median MAE of 6 pips and your average stop is 12 pips.
Your ratio is 0.50.
That means the typical winning trade uses roughly half of the available stop distance before moving in your favor.
Now, suppose your average stop is 20 pips.
The ratio becomes 0.30.
The stop may be unnecessarily wide.
Again, this is not a universal optimization formula.
It is a diagnostic.
A very low ratio can suggest that your stop is wider than necessary.
A ratio near 1 may suggest that your stop is extremely sensitive to ordinary fluctuations.
You need to examine the distribution rather than optimize for a single magic number.
Use MAE Percentiles Instead of Averages
Averages can hide important information.
Suppose your winning trades have MAEs of:
2, 3, 4, 5, 6, 7, 8, 9, and 25 pips.
The 25 pips is an aberration that skews the average.
Percentiles are typically more helpful.
Perhaps 80% of wins have no more than 9 pips of adverse movement.
That gives you a much clearer picture of where the stop needs to be.
You can then test stops around that region.
But always validate them against structural invalidation.
Statistics should inform the stop.
They should not override the market.
The Psychology of Session-Specific Stops
There is a psychological benefit to this method that is easy to underestimate.
A trader who uses one fixed stop often becomes emotionally attached to that number.
If the stop is hit, they think:
“My stop was too tight.”
So they widen it.
Then another loss occurs.
They widen it again.
Eventually, the stop becomes so large that the strategy’s risk-to-reward profile collapses.
A session-specific framework prevents that emotional drift.
The stop is not being changed because you are uncomfortable.
It is being changed because the market environment has shifted, as measured by predefined metrics.
That distinction is enormous.
One is emotional adaptation.
The other is systematic adaptation.
Do Not Optimize Your Stop After Every Loss
This deserves emphasis.
If you lose three London trades with a 10-pip stop, do not immediately change the stop to 15 pips.
Three trades are not enough to prove it.
You need a large sample.
Maybe the whole market regime shifted.
Maybe the setup no longer works.
Your entries are worse, maybe.
Perhaps the losses were more or less normal.
A stop-loss method should be evaluated over a statistically meaningful sample, not rewritten after every frustrating trade.
The purpose of a journal is to stop memory from controlling your decisions.
A Practical Session-Specific Stop Workflow
Before the session begins, establish the expected volatility environment.
When the setup appears, identify the structural invalidation level.
Compare that Distance with the normal adverse movement for that setup during the current session.
Is the current volatility regime normal, compressed or enlarged.
If structural halt is within normal session noise, widen to a logical invalidation point.
Then reduce the position size to keep your pre-defined monetary risk intact.
Finally, check whether the resulting stop still leaves enough reward relative to the expected target.
If not, do not force the trade.
This final step is critical.
Sometimes the market does not offer an attractive trade at your chosen risk level.
That is information, not a problem to solve.
What A Good Session-Specific Stop Should Accomplish
A good stop should accomplish three things simultaneously.
It should sit beyond a level that invalidates your trade idea.
It should provide enough room for normal session-specific noise.
And it should keep the monetary loss within your predefined risk limit.
If one of those conditions fails, the trade needs to be reconsidered.
This is why the best stop is not necessarily the tightest stop.
It is the stop that is correctly positioned relative to the thesis and efficiently sized relative to the account.
Scaling the Method With More Capital
There is another reason this framework becomes more important as you grow.
When capital increases, the temptation is to keep the same lot size and make larger dollar gains.
Professional scaling works differently.
The objective is to preserve the same risk process while increasing the capital available to express the edge.
If your strategy has demonstrated that London breakouts work with a particular MAE distribution, volatility buffer, and risk percentage, you want to preserve those relationships as you scale.
This is where evaluation-based proprietary trading programs can become relevant.
The5ers currently offers a High Stakes two-step evaluation with unlimited evaluation time, a 10% Phase 1 target, a 5% Phase 2 target, a 5% daily drawdown, and a 10% maximum loss under its published August 2026 rules. The program also requires at least three profitable trading days.
Session-aware risk becomes critical especially under the current limitations. If a trader who understands New York volatility needs a broader structural stop they may reduce position size rather than break the risk structure of the account.
The5ers also states that leverage and other trading conditions can vary by asset and may be adjusted in response to market volatility and liquidity conditions.
That is exactly the kind of environment where a trader should think in terms of risk percentage and stop Distance, not fixed lot size.
FTMO provides another example of a structured evaluation model. Its current 2-Step Challenge uses a 10% first-phase profit target, a 5% Verification target, a 5% maximum daily loss, a 10% maximum loss, and a minimum of four trading days.
The point is not that one evaluation provider is automatically superior.
The point is that serious traders can use evaluation programs as a capital-efficiency pathway once they have developed a process that operates under strict risk constraints.
An evaluation should not be where you discover whether your stop-loss method works. 11
You should discover that beforehand.
If your session-specific stop model has been backtested, forward-tested, and demonstrated consistent execution, then considering a The5ers evaluation can be a logical next step toward scaling the same process rather than reinventing it with more capital.
Frequently Asked Questions
What is a session-specific stop loss?
A session-specific stop-loss is a stop-loss methodology that accounts for volatility, liquidity, market structure, and typical adverse movement in the particular trading session in which the trade occurs.
Should the stop-loss distance change between London and New York?
It can, but it should not change simply because the clock changed. The stop should change when your data shows that volatility, structure, or typical adverse movement is sufficiently different to justify a different stop distance.
Should I use ATR for a session-specific stop?
ATR can be helpful, especially if you calculate it on data that is relevant to the session and time frame that you trade. ATR should typically supplement, not replace, structural stop placement.
What is better, ATR or market structure for stop placement?
Neither should be treated as universally superior. Market structure tells you where the trade thesis becomes invalid. ATR or another volatility measure helps determine whether that location provides enough room for normal price movement.
Why do my stops get hit during London and then price moves in my direction?
This can happen when your stop is inside normal London session noise. It can also happen because of poor entry timing or a genuinely failed setup. MAE analysis can help determine which explanation is most common in your data.
Should I use wider stops during volatile sessions?
No, not automatically. If volatility means a broader structural stop, take a smaller position size to keep the same monetary risk. If the broader stop kills your reward to risk ratio, you might be better off passing on the trade.
What is MAE, and why is it useful for stop losses?
Maximum Adverse Excursion measures how far a trade moves against you before its outcome. Studying MAE among winning trades can show how much typical adverse movement your strategy typically needs before it works.
Should every trading session have a different stop-loss rule?
Not always. Some tactics may work in sessions regularly. The idea of doing session-specific analysis is to verify whether substantial changes exist, not to add complexity for the sake of complexity.
Can a session-specific stop improve trading psychology?
Yes. It can help to limit the urge to expand or tighten stops when you are emotionally uncomfortable, because the stop distance is based on pre-determined structural and volatility rules, not how uncomfortable the trade feels.
How do I test a session-specific stop-loss method?
Separate your historical trades by session and set-up. Compare MAE, MFE, stop Distance, expectancy, win rate, and average R. Then test whether different stop structures enhance expectancy without just raising the average loss.
Final Thoughts
The stop-loss is often treated as the least interesting part of a trading strategy.
It should not be.
Your entry tells you when you believe an opportunity exists.
Your stop tells you what evidence would prove you wrong.
And that evidence changes with market conditions.
A 10-pip move in a single session can be normal noise.
The same 10-pip move during another session can represent a meaningful structural failure.
That is why a fixed stop can quietly damage an otherwise good strategy.
But there is an equally dangerous mistake on the other side.
Do not turn “session-specific” into an excuse for constantly widening stops.
Let the data determine the adjustment.
Measure session volatility.
Measure MAE.
Study structural invalidation.
Separate setup types.
Track stop-outs.
Then adjust position size rather than unthinkingly adjusting risk.
For your next 50 trades, make one change.
Keep your account risk percentage fixed, but record the session-specific MAE and structural stop distance for every setup.
At the end of the sample, compare London, New York, and any other session you trade.
You may discover that your biggest problem was never that your stops were too tight.
It appears you were using the wrong stop model for the market environment.
That is a much more valuable discovery.
Because once you understand how much room your strategy actually needs in each session, you can stop guessing where your stop should go.
You can build it.
And that is the difference between placing a stop and having a stop-loss method.
For your next read, explore How To Measure Total Risk Over 3 Consecutive Trades. A session-specific stop becomes even more useful when you understand how several trades can combine into a larger sequence-level risk.