
You see EUR/USD push higher, then a sudden bearish candle wipes out several minutes of gains. You assume the rally is finished and sell. A few candles later, the price reverses sharply and makes a fresh high.
The opposite happens just as often. You buy a sudden dip because the larger trend is bullish, only to watch the decline accelerate.
The problem is not the spike itself. It is entering before you understand what the spike is telling you.
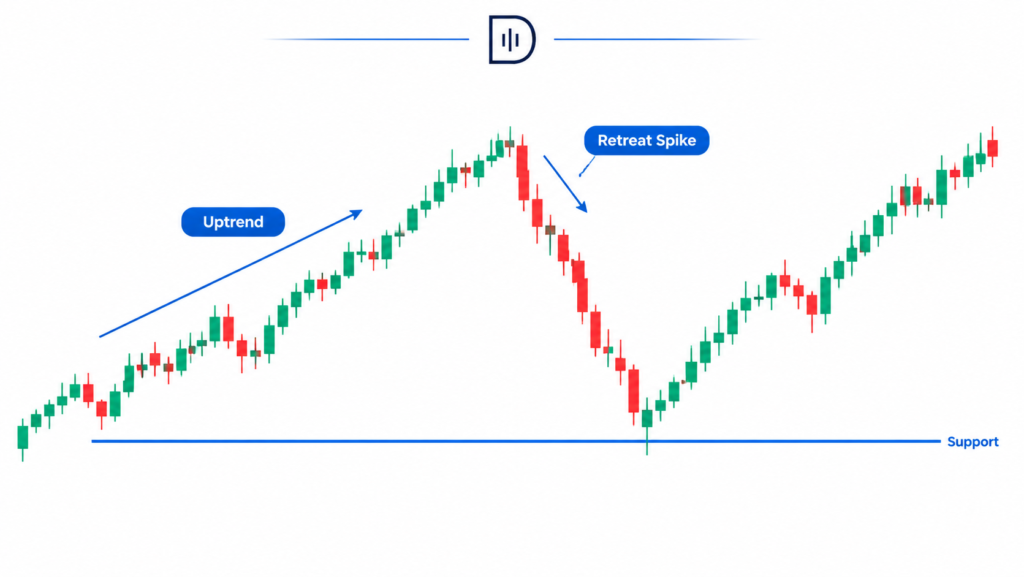
Retreat spikes are sharp counter-moves that interrupt an existing price move. Traders can look to trade them as temporary pullbacks within a trend or as early evidence that the original trend may be weakening. The challenge is distinguishing between those two possibilities before risking money.
This guide explains how to trade retreat spikes in forex, identify higher-quality setups, and avoid the common execution mistakes that turn a useful price pattern into an expensive guessing game.
What Is a Retreat Spike in Trading?
A retreat spike is a sudden move against the prevailing short-term direction. It may appear as a long opposing candle, a rapid cluster of candles, or a sharp move away from a recent high or low.
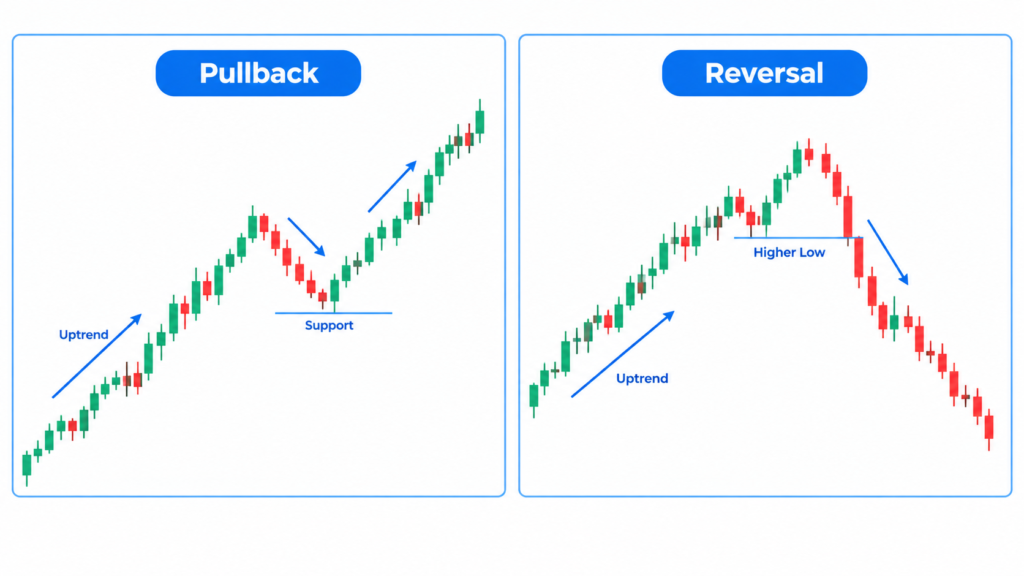
For example, gold rallies aggressively before dropping into a previous support area. If selling pressure fades and buyers reclaim a nearby swing high, the retreat may offer a continuation opportunity. If price instead breaks the last meaningful higher low and fails to recover, the move may be developing into a reversal.
The important point is that a retreat spike is not a complete trading signal on its own.
Its meaning depends on where it occurs, what price it occurs immediately before, and how the market behaves afterward.
What Research Tells Us About Trading Retreat Spikes
The CME Group’s educational guide to trend and continuation patterns explains how retracements and consolidations can precede a continuation of the original move. It also makes clear that these patterns do not always resolve as expected.
That matters for a day trader. Pullbacks in a strong trend are interesting, but not automatically a buy in the direction of the original trend. You still need proof that the counter-move is losing its grip.
The CME Group’s guide to support and resistance offers another useful principle: levels are better treated as zones than as exact prices. A retreat spike may briefly cross a low, stop, then rebound. The level may be a line, so you may enter too early or place stops too close to regular price fluctuations.
Finally, the Bank for International Settlements discusses the relationship between foreign exchange volatility and market activity in its research on FX volatility and liquidity. The conclusions are based on unique market data and should not be applied to all currency pairs or trading sessions. Practice shows that more activity does not guarantee easier execution. Fast markets offer opportunities but make entries, spreads, and price changes tougher to manage.
These sources suggest reading the retreat in context, using significant price zones, and considering execution circumstances before joining.
How To Identify a Tradeable Retreat Spike
Start with the direction of the move before the spike. On a higher timeframe, determine whether the price is making higher highs and higher lows, lower highs and lower lows, or moving sideways. Then use a lower timeframe to examine the retreat.
Suppose GBP/USD rises and breaks a session high. Price drops rapidly toward the breakout area. The market is returning to a buyer-controlled level, so watch that decline.
However, do not buy simply because the price has returned to that area. Look for a behavior change. Are bearish candles becoming smaller? Is price struggling to make fresh lows? Has a short-term swing high been reclaimed?
These indications suggest an entry, not the retreat’s end.
Speed and control aid differentiation. Strong retreats may not change trends. A slower decline may suggest weakness if it breaks swing lows and never recovers.
After-spike structure is usually more informative than spike size.
A Practical Retreat Spike Trading Strategy
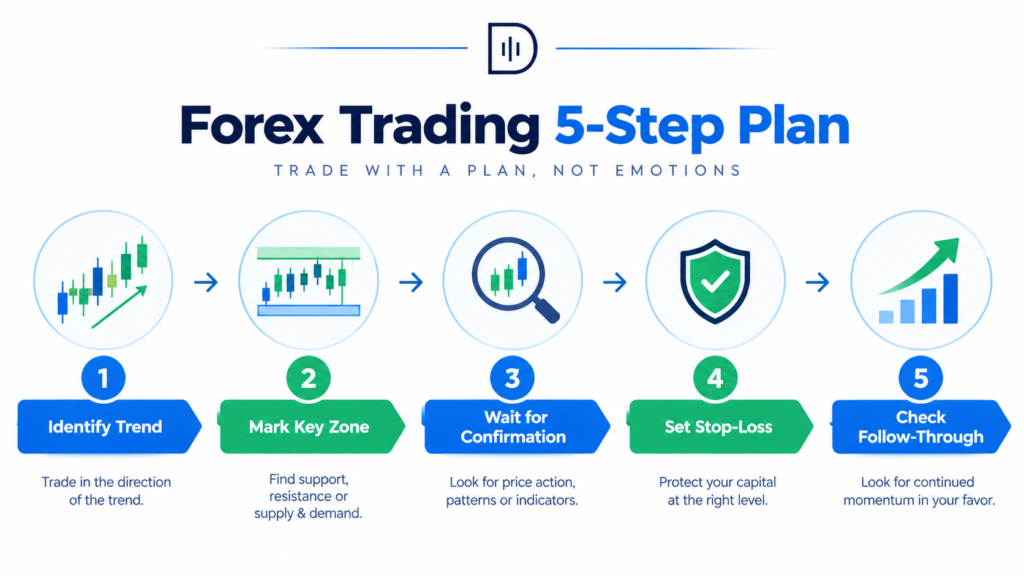
Step 1: Establish the market context
Before starting the session, record the previous day’s high and low, local support and resistance, and recent swing points. Continue or reverse the trend.
Not every spike is a setup. If the price is unpredictable within a narrow range, a counter-move may be directionless.
Step 2: Wait for the price to reach a meaningful area
A retreat spike becomes more interesting when it reaches a location that could change trader behavior. This might be a former breakout level, a previous swing point, or an established support or resistance zone.
For a bullish continuation, look for a retreat toward support after an upward impulse. For a bearish continuation, watch for a rally into resistance after a downward impulse.
The location helps you frame the trade. It does not tell you to enter.
Step 3: Look for evidence that the retreat is losing strength
Let’s assume a bullish case. EUR/USD moves up to 1.0850 then drops to 1.0825. Prices create smaller bearish candles instead of selling all the time. A small lower TF high has been taken out.
That break suggests buyers are regaining short-term control. A trader might wait for a retest of the broken swing area and enter if the level holds.
The figures are illustrative, not a live signal or a claim about typical market behavior.
For a bearish scenario, invert the logic. Price makes an upward impulse into a relevant resistance zone. It stops and breaks a tiny swing down. A failed retest might be an entry.
Step 4: Define the invalidation point before entry
Your stop should sit where the trade idea is no longer valid, not at a distance chosen to make the position size look attractive.
In a bullish continuation, that may be below the retreat’s structural low. In a bearish continuation, it may be above the relevant retreat high. The exact location depends on the setup and the instrument’s volatility.
Reduce the position size or cancel the trade if the logical stop exceeds your risk limit. Avoid a tight stop in a noisy area to maximize benefit.
Step 5: Demand follow-through
Once you’re in, look out for pricing changes. Does it intentionally abandon the retreat zone, or does it continuously return to the entrance zone?
There is a distinction between constant optimism and the pricing that supports the belief. If the move you expect does not develop and the market breaks your entry setup then exit on your exit criteria and do not run the stop.
When a Retreat Spike Is Actually a Reversal
One of the costliest mistakes in day trading is assuming every sharp counter-move is temporary.
A retreat is more likely to develop into a reversal when price breaks a meaningful swing point, fails to reclaim it, and then begins forming a new sequence of lower highs and lower lows after an uptrend. In a downtrend, a reverse structure can signal a bullish reversal.
Keep your eye on the start of the maneuver. A retreat after a significant breakout in the middle of a trend is not the same as a retreat following a long move into a major higher-timeframe resistance zone.
News is important too. A rapid surge around an inflation release, central bank decision, or employment data may be caused by new information, not a regular technical pullback. In such situations, spreads can expand, and prices can break through planned entry and stop levels quickly.
Sometimes the right decision is to wait. Missing a trade is usually less damaging than entering a setup whose original logic has disappeared.
Risk Management and Execution
Retreat-spike strategies can look attractive because the entry point may be close to a recent swing high or low. But a close entry is not automatically a good entry. If the market is moving quickly, the price you expect may differ from the price you receive.
Before placing the order, you should work out your maximum account risk and then determine the position size based on your entry, stop distance, and instrument characteristics. The Position Size Calculator and other trading tools at DayTradersDiary.com will help you structure this process without guesswork.
Also consider the spread and possible slippage. If a surge widens the stop distance or results in terribly poor execution, step back and reconsider the trade rather than adding to your exposure in an attempt to make up for a missed entry.
The aim is not to catch the exact low or high. It is to take a repeatable setup at a risk level that allows you to survive a series of ordinary losses.
How To Journal and Improve the Strategy
A retreat spike may look obvious after the market has moved away from it. Your journal needs to capture what was visible at the time, not what became clear afterward.
Note the market session, the direction of the last impulse, the location of the spike, the entry trigger, the distance of the stop, and whether or not price followed through. Indicate if the conditions were normal or occurred around a major news release. Please provide screenshots before entering and after the trade is closed.
Look at reversal and continuation situations in a big sample of trades. Mid-range spikes are distinct than prior session highs and lows. See fails to trade. Was the problem faulty placement, early confirmation, or execution?
Use the DayTradersDiary.com resources page to locate the Trade Journal Template if available. A consistent template makes it easier to compare trades and spot patterns that memory alone tends to distort.
Do not assess the tactic by a few wins. Track average win, loss, win rate, and post-cost performance. A chart-appealing setup may perform poorly after spreads, slippage, and missed entries.
Scaling Your Trading Capital
A trader can develop a useful edge and still face limitations when personal capital is small. Evaluation programs offered by proprietary trading firms provide one possible route to trading under a larger account allocation, but they add their own rules and costs.
Structured assessment stages and risk parameters are part of The5ers evaluation program. Firms like FTMO offer their own evaluation models and trading conditions. Compare current rules, fees, drawdown calculations, payout terms, and limits before paying for an evaluation.
Consider an evaluation a process test, not a capital shortcut. Any retreat spike method that relies on large positions or frequent discretionary stop changes may fail under severe daily-loss restrictions, even if it occasionally yields big gains.
Make sure to acquire enough journal data to demonstrate that the technique is repeatable and that you can stay within the risk limits when losing before evaluating. Choose a program with guidelines that fit your trading style and never use funds you need for an evaluation fee.
FAQs
What is a retreat spike in forex trading?
Big break from the short-term trend. Traders will look at market structure, location, and follow-through to see if the pullback is transient or a reversal.
What is the best timeframe for trading retreat spikes?
There is no universally best timeframe. Some day traders use the 15-minute or 1-hour chart to establish context and a 1-minute or 5-minute chart for entry confirmation. The combination should match the strategy and be tested on the instrument being traded.
Should I enter as soon as a retreat spike ends?
Not by default. Wait for a clear trigger such as a short term structure break or a test of success If a candle closes then getting in can get you if the retreat resumes.
Can retreat spikes be traded during news?
Around news, abrupt price movements, bigger spreads, and slippage can make execution unpredictable. Understanding your broker’s terms and conditions and avoiding news spikes unless it’s in your tested strategy are important.
How can I tell a pullback from a reversal?
A pullback usually maintains the trend structure. Price’s failure to hold key swing points continually implies a reversal. Until pricing reveals more, no interpretation is certain.
Final Thoughts
Spikes in trading retreats are less about anticipating the next candle and more about knowing who is in power following a quick counter-move.
The next stage is easy: go through 20 historical examples on one currency pair. Mark the earlier impulse, spike position, confirmation signal, and when the setup is no longer valid. Note which cases continued the initial trend and which reversed it.
That exercise will tell you more about your actual edge than adding another indicator to your chart. For your next read, explore the trading education and tools available through DayTradersDiary.com and build your analysis around a process you can measure.