
You spot a strong uptrend, wait patiently for the price to pull back, and finally see it reach a level you have been watching. The price looks attractive, the trend still appears bullish, and you enter a buy trade.
Then the market drops another leg lower.
Now you are wondering whether you entered too early, whether the trend is changing, or whether you should have waited for one more candle.
This is one of the most common problems in day trading. Traders can identify the trend correctly and still lose money because they mistake a temporary pause for the end of a retracement.
The difficulty is that a retracement rarely announces when it is finished. Price can react at support, bounce briefly, and then continue lower. It can also dip below a previous swing low before recovering and resuming the trend.
The solution is not to find a perfect indicator. It is to build a process for judging when the evidence begins to shift back in favor of the original trend.
What Does It Mean When a Retracement Is Finished?
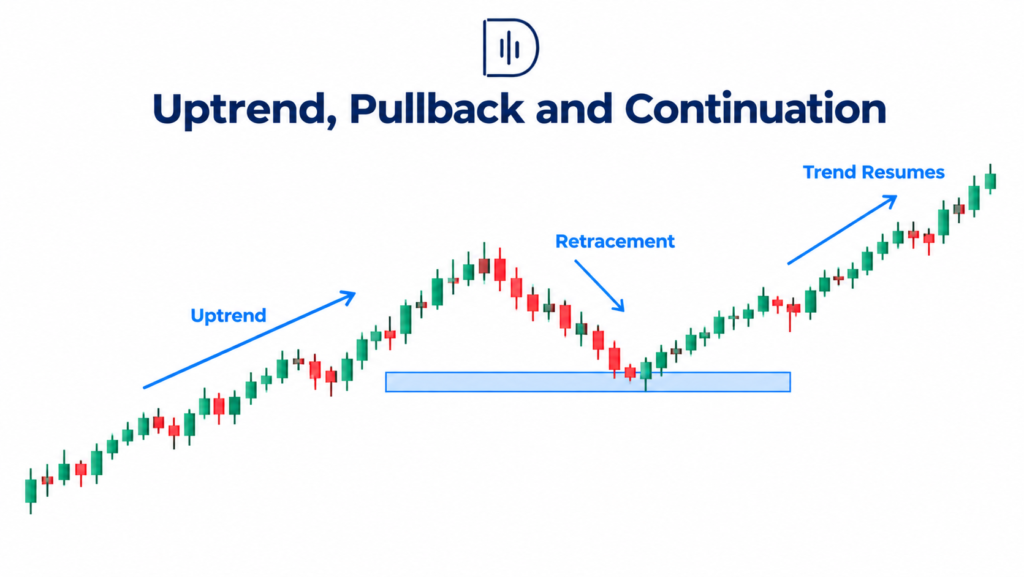
A retracement is a temporary move against the prevailing trend. In an uptrend, the price pulls back from a recent high. In a downtrend, it rallies from a recent low.
A retracement is considered finished when the price begins to show credible evidence that the original trend may resume. The important word is evidence. You cannot know with certainty that the low or high of the pullback is already in place.
Consider EUR/USD moving higher from 1.0800 to 1.0900 before pulling back to 1.0860. Price reaches a previous support area and starts bouncing.
That bounce alone does not confirm the retracement has ended. If price fails to make progress and falls below 1.0860, the pullback may still be developing. If buyers defend the area, establish a higher low, and push the price through a nearby short-term swing high, the case for trend continuation strengthens.
Your objective is not to predict the exact turning point, It is to know when the balance of evidence is in the favor of a continuation transaction.
Five Signs That a Retracement May Be Finished
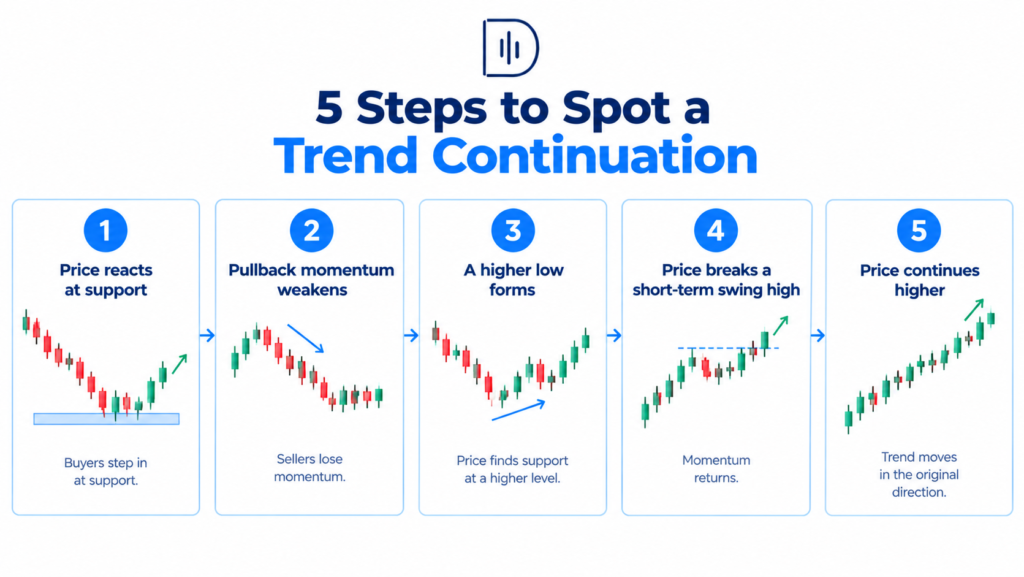
1. Price Reacts at a Meaningful Area
The first thing to watch is where the retracement slows down.
Previous swing highs and lows, established support and resistance, and relevant intraday levels can help identify areas where price may react. Some traders also use moving averages or Fibonacci retracement levels to frame potential reaction zones.
However, a level is not an entry signal by itself.
Suppose gold is trending higher and pulls back into a previous resistance area that has already been broken. If price stabilizes there and buyers begin pushing it higher, the level provides useful context.
If price cuts through the area with little resistance, do not keep buying simply because you expected support to hold.
The CME Group’s guide to support and resistance makes an important distinction: these levels are better understood as areas where price may react, not exact prices that must hold.
2. The Pullback Starts Losing Momentum
A retracement usually starts with a quick move against the trend. As this progresses, you may start to see smaller candles, less direction, and repeated failed attempts to push further against the trend.
For example, during an upswing, the sellers might first push the market down with several strong bearish candles. Candles are getting smaller near a possible support area, and each successive push down is losing momentum.
That change can suggest that selling pressure is weakening.
But be careful. Smaller candles can also appear before another strong move lower, particularly when the market is consolidating before a major news release.
Look for a behavior change, not simply a change in candle size.
3. Price Forms a Higher Low or Lower High
Market structure is one of the more useful ways to judge whether a retracement may be ending.
In an uptrend, the price often forms higher highs and higher lows. During the pullback, you want to see evidence that buyers are beginning to regain control. A potential higher low, followed by a break above a nearby swing high, can provide that evidence.
In a downturn, it’s the reverse. A rally can make a lower high than violate a neighboring swing low close.
Suppose the Nasdaq 100 goes up to 18,500, down to 18,420, up again to 18,470, and then down to 18,440. The structure shows buyers may be taking control if the price is able to stay above 18,420 and then break above 18,470.
The key is the sequence, not the pattern’s appearance in isolation.
4. Price Breaks a Short-Term Swing in the Trend Direction
A break of structure can help confirm that the pullback is losing control.
During a bullish retracement, the price may form a series of lower highs on a smaller timeframe. If buyers push through the most recent meaningful lower high, the short-term bearish structure has weakened.
For a bearish trend, watch for the price to break below a meaningful higher low formed during the retracement.
The CME Group’s educational material on technical reversal patterns explains how changes in swing highs and lows can help traders assess whether a market is continuing or changing direction.
But not every little break of serve counts. In a powerful trend, minor structure can break repeatedly without affecting the bigger picture. Focus on swings that are relevant to your trading time frame and initial setup.
5. The Market Shows Follow-Through After the Initial Bounce
This is where many traders get caught.
Price reaches support, prints a bullish candle, and they immediately buy. The next candle reverses, and the retracement continues.
A single bounce tells you that the price reacted. Follow-through tells you whether that reaction is attracting continued participation.
After a potential bullish reversal, observe whether the price can hold its gains, form a higher low, or break a nearby swing high. For a bearish continuation, look for the equivalent sequence in the opposite direction.
If you wait for follow-through, you could get in at a worse price. That’s the price you pay for more solid confirmation. The idea is not to remove uncertainty but to remove the taking of every conceivable turning point.
Retracement vs. Pullback vs. Retest: What’s the Difference?
These terms overlap in everyday trading discussions, but the distinctions can help you describe a setup more precisely.
A retracement is a move against the prevailing trend that may be temporary. A pullback is commonly used to describe a similar short-term move against the trend, often before continuation. In practice, traders frequently use the two terms interchangeably.
A retest is when the price returns to a level after breaking through it. For example, price breaks above resistance and later returns to test whether that area can act as support.
A retest can occur during a retracement, but not every retracement is a retest. A pullback can also develop without returning to any clearly defined breakout level.
This is important because the admission conditions are different. A trend-continuation trader could be looking for a higher low following a retracement, whilst a breakout trader might be looking for a broken resistance level to hold as support.
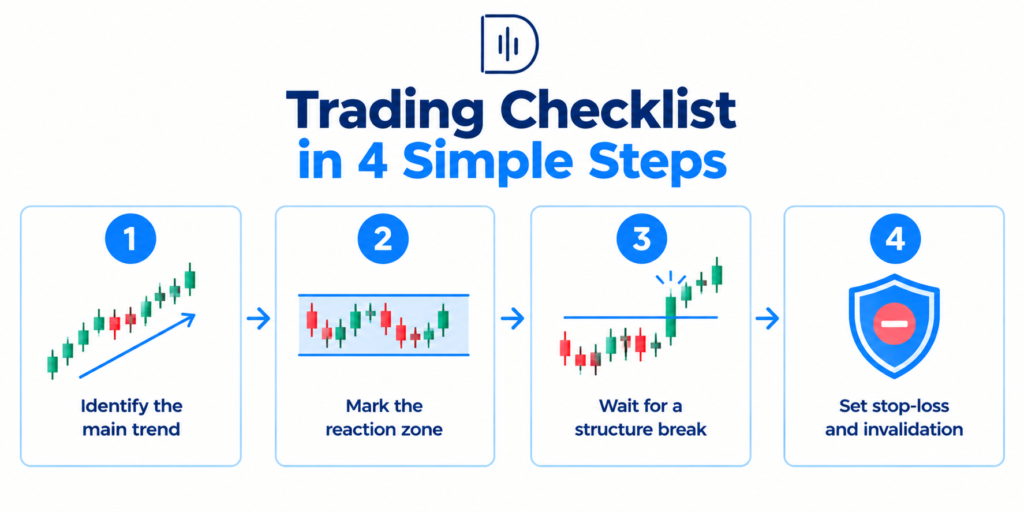
A Practical Framework for Timing Your Entry
Don’t try to find the precise bottom of every pullback, but employ a repeating sequence.
Step 1: Establish the main trend. Identify the relevant swing structure on a higher timeframe. If the market is making higher highs and higher lows, focus on whether the pullback is still consistent with that structure.
Step 2: Mark the potential reaction zone. Utilize past swing points, support and resistance levels, or some other level that is part of your tested plan. A Fibonacci level or moving average may not always initiate a reversal.
Step 3: Observe the reaction. Look for evidence that the countertrend move is losing momentum. A rejection candle can be helpful, but it has to be read in context.
Step 4: Wait for structural confirmation. Look for a higher low and a break of a nearby swing high in a bullish setup, or a lower high and a break of a nearby swing low in a bearish setup.
Step 5: Define invalidation. Decide where the continuation idea would no longer work. If price breaks that area below, then understand that the retracement could be deeper, or the trend may be altering.
This process will not catch every move at its lowest point. It is designed to make your decisions more consistent and your entry conditions easier to test.
When a Retracement Is Actually a Reversal
One of the biggest mistakes in day trading is assuming that every move against the trend must eventually reverse back into it.
Sometimes the market is not retracing. It is changing direction.
Suppose an instrument has been making higher highs and higher lows. It then breaks below a significantly higher low, rallies back toward that level, and fails to reclaim it. Price subsequently forms a lower high and continues downward.
That sequence provides more reason to question the original uptrend than a routine pullback would.
The CME Group’s material on trend and continuation patterns is useful for understanding why traders examine the relationship between existing trends, consolidation, and possible continuation.
Also, think about the broader market context. A strong economic release, an abrupt move in risk sentiment or a large session open might alter the conditions under which the initial trend developed.
When the structure changes, be willing to revise your analysis. Do not keep buying simply because the market was bullish an hour ago.
Risk Management: Don’t Let Confirmation Become an Excuse for Poor Risk Management
Waiting for confirmation can improve the quality of an entry, but it often means entering later. Your stop may need to be wider, or the remaining distance to your target may become too small.
For example, a trader identifies a potential bullish retracement in EUR/USD. An early entry offers a stop distance of 10 pips, while waiting for a structure break means the stop needs to be 18 pips away.
The latter entry is not automatically better if the profit target has not changed and the remaining upside is limited.
This is where position sizing matters. Use the Position Size Calculator to work out an appropriate position size based on your account risk and stop distance. Before entering, consider whether the trade still offers sufficient reward to justify the risk, including fees and potential slippage.
Never force a tight stop to increase your position size. Your stop should reflect the conditions that invalidate the setup, not the amount you want to make.
Use Your Trading Journal to Improve Retracement Entries
It is easy to remember the pullback you bought perfectly and forget the several that continued against you. A journal helps you evaluate the approach more objectively.
For each trade, record the main trend, the level where the retracement developed, the confirmation signal you used, your entry and stop distance, and the final result in R.
Also, record whether you entered before or after a structure break. Over time, compare the results of early entries with those taken after confirmation.
You might discover that early entries offer better reward-to-risk potential but suffer more stop-outs. Alternatively, you may find that waiting for confirmation improves your win rate but leaves too little room for profit on certain setups.
Neither result is automatically superior. What matters is the strategy’s overall expectancy after costs and whether you can execute it consistently.
Use the DayTradersDiary.com trading resources to find relevant tools and organize your review process, including the Trade Journal Template available on the site.
Scaling Your Strategy With a Funded Trading Account
Once you have a tested process for trading retracements, you may start thinking about how to apply it with more capital.
Evaluation programs from firms such as The5ers, FTMO, and TradeThePool offer different routes for eligible traders to pursue funded trading opportunities. Their instruments, fees, evaluation requirements, and drawdown rules differ, so compare current conditions before choosing a program.
The5ers and FTMO offer forex and CFD related programs, while TradeThePool is focused on stock trading.
A funded evaluation should follow the development of a reliable trading procedure, and not be a means to push for quicker growth. If you’re entering too early, widening stops or ignoring your invalidation rules over and again, a stringent drawdown limit can quickly disclose vulnerabilities.
If your findings indicate that you can regularly pick out retracements and manage risk without making impulsive moves, then ask yourself if The5ers evaluation method is a good fit for your trading style. Read the current rules, charges, and qualifying requirements before you commit.
The objective is to apply a proven process within a suitable capital framework, not to use a larger account to compensate for inconsistent execution.
FAQs About Judging When a Retracement Is Finished
How do you know when a retracement is finished in forex?
Look for a major-level reaction, fading countertrend momentum, a change in immediate market structure, and follow-through in the direction of the original trend. There is no one signal that says the end is now.
Is a break of structure enough to confirm that a retracement is over?
Not always. A minor swing break can occur during an ongoing pullback. Look at the size and relevance of the swing, the higher-timeframe trend, and whether the price can maintain its move after breaking the level.
Which timeframe is best for identifying the end of a retracement?
Use a greater time frame to figure out trend direction and critical levels, then a lesser time frame to zero in on your entry. The best combination relies on the holding period and the tested method.
Should I use Fibonacci retracement levels to time entries?
Fibonacci levels can help us identify potential reaction zones but do not tell us where a retreat has to conclude. Don’t just enter because the price hits a certain percentage; combine them with price action and market structure.
What is the difference between a retracement and a reversal?
A retracement is a move against the existing trend that may be transitory. A reversal is a larger shift of direction. They can be identified by variations in swing structure, failed efforts to extend the original trend and continuous movement in the opposite direction.
Is it better to enter early or wait for confirmation?
Early entries can give better prices and tighter stops but with a higher risk of being premature. Waiting for confirmation can help avoid certain bogus entries, but it can also degrade the reward-to-risk ratio. Compare the two ways with your own trading data.
Final Thoughts
You don’t have to catch the precise bottom of every retracement to trade it profitably. You need a clear method to discern a prospective reversal from an ongoing downturn.
For the next 20 setups, write down where you originally thought the retracement would end, what confirmation you waited for, and what price you observed after that. Please look at the results before you change your entry rules.
The aim is to stop treating a promising candle as proof and start treating it as one piece of evidence.
For your next read, explore the technical analysis and trading resources on DayTradersDiary.com to build a more consistent process for reading market structure, timing entries, and managing risk.