
You mark yesterday’s high, draw support and resistance, and spot a clean purchase zone. Price gets to your level, bounces for a second and then rips right through your stop. Then it comes back a few minutes later and goes in the direction you thought it would.
The frustrating part is that your analysis was not necessarily wrong. You may have misunderstood where the market was accepting the Price and where it was merely testing it.
This is where intraday value zones become useful. Instead of treating every support or resistance level as equally important, you identify the prices where meaningful trading activity has concentrated and use that information to judge whether the market is balanced, rejecting an area, or searching for a new price range.
The goal is not to predict every reversal. It is to build a better framework for deciding where to trade, where to wait, and when your original idea no longer makes sense.
What Are Intraday Value Zones?
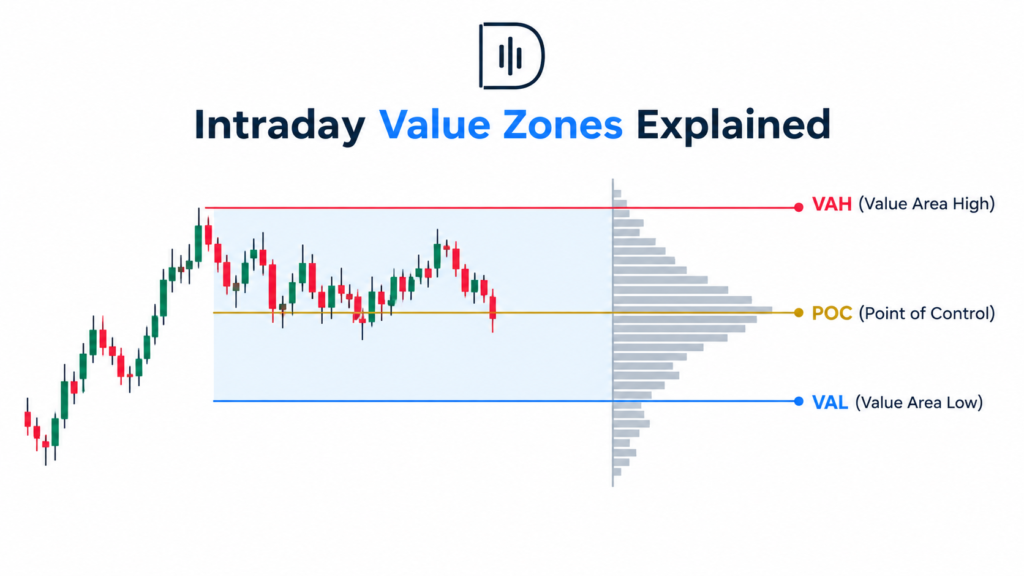
Intraday value zones are areas of price that are used to identify where a market has done a lot of business in a chosen trading session. In volume profile analysis, the value region is the primary reference point, generally containing about 70% of the traded volume during the session.
Three measurements matter most.
The Value Area High (VAH) is the upper boundary of the value area. The Value Area Low (VAL) is its lower boundary. The Point of Control (POC) is the price level at which the most volume was traded within the defined profile.
Together, these levels help answer a practical question: where did the market find enough agreement to trade, and where did it struggle to sustain participation?
A value area is not automatically a support and resistance zone. It describes historical activity, not a guaranteed future reaction. Its usefulness comes from observing how the current Price behaves around it.
How to Calculate Intraday Value Zones
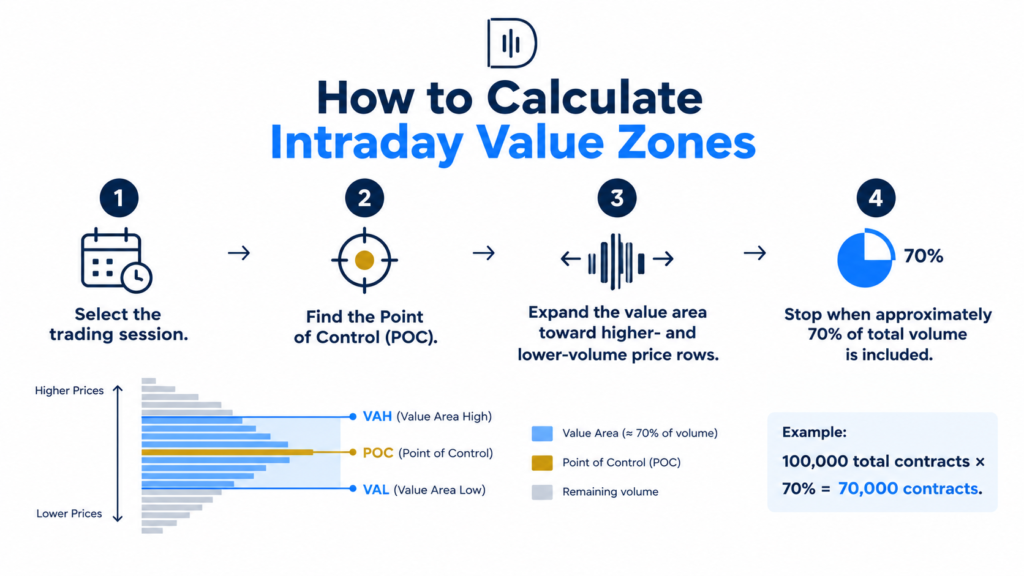
The easiest way is to utilize a session-based volume profile on your charting software. Choose a particular timeframe: the London session or the New York session, or the last common trading session, based on your market.
First, calculate the total volume traded across all price levels in that period. Multiply the total by 0.70 to obtain the target volume for a conventional 70% value area.
Next, locate the POC, the price row with the highest volume. Include that row in your value area, then compare the volume of the next available price row above it with the next available row below it. Add the row with the greater volume and repeat the comparison as you expand outward.
Continue until the accumulated volume reaches the target. The uppermost included Price becomes the VAH, and the lowest included Price becomes the VAL.
For example, suppose a session records 100,000 contracts. Your target is 70,000 contracts. If the value area expands from the POC to include approximately 70,000 contracts, the resulting upper and lower boundaries define that session’s value zone.
Actual platform calculations may differ slightly because of price-row increments, rounding, and tie-breaking rules. For the precise calculation method, see TradingView’s volume profile methodology.
One important distinction: the 70% figure is a convention, not proof that Price has a 70% probability of remaining inside the zone. It measures the share of historical volume included in the selected range. It does not provide the probability of success for a trade.
The Three Decisions That Make Value Zones Useful
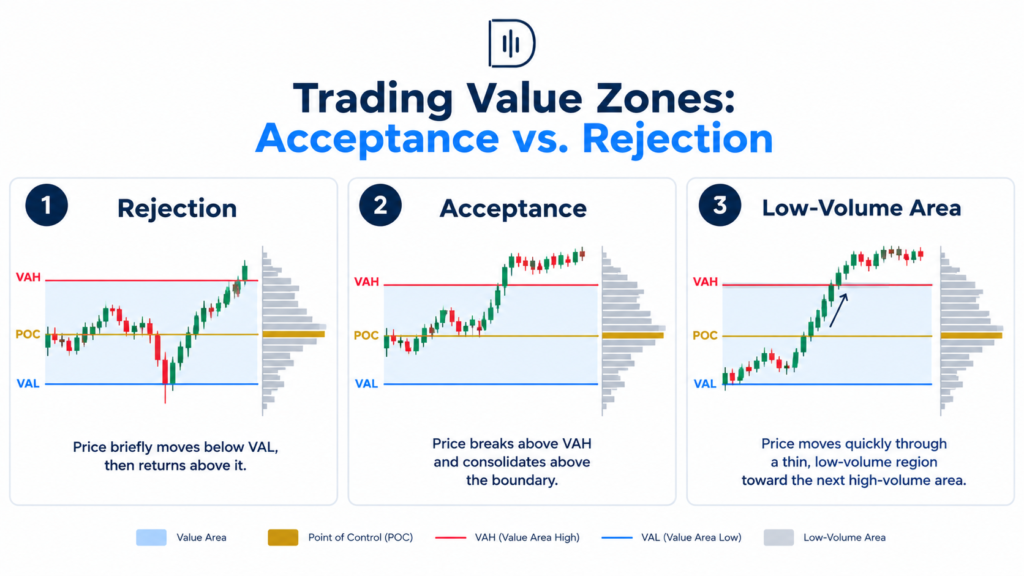
1. Is the Market Accepting or Rejecting Price?
Gold is trading near the value area of the past session. The price fell below the VAL, but sellers failed to hold the ground. It immediately took the border again and continues to hold above it.
Such conduct implies that the market is saying no to reduced prices. A higher low, bullish breach of structure or any entry signal you have tested to support the reclaim will make a long setup more appealing.
Now consider the other case. Gold has dropped below VAL and is retesting the boundary from below and failing to reclaim it. Selling may still be the more reasonable course when the market spends time below its prior region of acceptance.
The boundary itself is not the signal. The response to the boundary is the information.
2. Is Value Moving or Staying in Place?
Compare today’s developing value area with yesterday’s completed one.
If the POC and value area progressively shift higher, the market may be establishing acceptance at higher prices. A trader who keeps selling simply because the Price looks expensive may be fighting an evolving auction.
If the value is generally constant and Price keeps returning to the POC, then the conditions could be more conducive to range trading chances rather than aggressive breakout entry.
This distinction helps to prevent the typical mistake of applying a mean reversion strategy to a market that is actively discovering new prices.
3. Where Is Price Likely to Move Quickly?
Step outside the value area boundaries and study the contour of the volume profile. High-volume nodes are prices where there was a lot of activity. Low-volume nodes are places with relatively low activity.
A low-volume area can become a fast-moving corridor when Price enters it, although this is not guaranteed. If Price breaks out of a balanced range and enters a thin area, there may be less historical activity to slow the move.
This is useful for target selection. Instead of automatically aiming for a fixed number of points, identify the next meaningful volume concentration or structural obstacle.
Research-Backed Insights for Day Traders
Three sources help clarify what value zones can and cannot tell you.
TradingView’s volume profile documentation explains how profiles organize volume by Price and how value areas are calculated. It also highlights an important limitation for forex traders: volume data for forex and CFD instruments may reflect tick activity rather than consolidated trading volume. Your profile can therefore differ across brokers and data feeds.
Studies in the Journal of Financial Markets, Intraday Price Discovery in Fragmented Markets, examines how different trading venues contribute to price discovery throughout the day. The practical lesson is that intraday market information and activity are not equally distributed over intraday periods. A level set in a quiet session may respond differently when the market opens up or new information comes to light.
A related study in the Review of Financial Studies, Why Do Security Prices Change? A Transaction-Level Analysis of NYSE Stocks, investigates intraday price formation, volatility, spreads, and transaction costs. For active traders, it emphasizes the necessity of execution conditions. A technically favorable value-zone entry can still be a poor performer if spreads expand or volatility renders the anticipated stop unrealistic.
These sources provide a more methodical approach: structure decisions around value zones, then consider market conditions, data quality and costs of execution before deploying funds.
Build a Repeatable Intraday Value-Zone Trading Plan
A good routine begins before your trading session. Mark the VAH, VAL, and POC of the last session and compare them to the developing profile. Add in big swing highs and lows, anticipated economic releases, and the opening range for the current session.
When the market opens, classify the atmosphere before selecting a trade.
If Price remains in a fairly stable value area, watch for signs that an edge is being rejected and Price may rotate to the POC. If price breaks outside of value and holds acceptance past the boundary, look for a continuation setup rather than instantly fading the move.
Repeatedly crossing the POC without considerable progress can be a sign of rough conditions. A value zone can assist you know when not to trade, which is often more beneficial than finding another entry.
If the prior value area was between 4,120 and 4,145 with a POC of 4,133 for gold. Price opens at 4,138 and tests 4,145. A quick surge above the barrier, then a failed breakout and reversion inside value, could support a short-term rotation to 4,133.
However, if gold breaks 4,145, holds above it, and develops a higher intraday value, fading the breakout becomes less attractive. The original range is no longer the only relevant reference.
These figures are illustrative, not a live market setup. The key is to define the conditions that confirm or invalidate your idea before entering.
For additional context, combine this framework with your understanding of volume indicators for day trading and liquidity sweeps. And neither should substitute value-zone analysis; both can be used to understand the behavior occurring around a level.
Risk Management: Let the Stop Determine the Position
A value zone does not tell you how much to risk. That decision is part of your risk plan.
Suppose your account is $10,000 and you choose to risk 0.5%, giving you a maximum planned loss of $50. If your entry is near VAL, your stop should reflect the price action that would invalidate the trade, including reasonable room for volatility.
Calculate the position size from the stop distance, the instrument’s point or pip value, and your maximum permitted loss. Do not move the stop closer merely to justify a larger position.
This is where a position size calculator and lot-sizing guide can help remove the guesswork.
Also take into consideration spread, commissions, slippage, and other relevant contract characteristics. If the logical stop makes the trade undesirable relative to the next target, pass on it. A clear value zone is not a reason to take bad risk-reward.
Use Your Trade Journal to Find Your Actual Edge
The value-area concept may look convincing on a chart, but the important question is whether your particular execution rules produce favorable results.
Record the session, instrument, previous VAH and VAL, POC, entry location, market condition, confirmation signal, stop distance, target, and outcome in R-multiples. Also note whether the trade occurred during a scheduled news event and whether you followed your plan.
Start with a sample of no less than 50 trades and then add to the data set. 50 trades are not enough to provide you with statistical confidence, but they will expose recurring problems and give you a baseline for further testing.
Compare false breakouts to successful continuations. Count how many amount of Price rejects an external barrier and pushes back to POC. Do not put all configurations into one performance number, rather break results by session and per instrument.
Your downloadable Trade Journal Template can help organize these observations.
One especially useful metric in R is expectancy, calculated as the average outcome per trade after accounting for wins and losses. A strategy with a modest win rate can still have positive expectancy if its average winner sufficiently exceeds its average loss. Conversely, frequent reactions at value boundaries mean little if costs and losing trades erase the gains.
Scaling Capital Without Abandoning Discipline
Once you have proof that you have a repeatable edge, the next consideration is whether your available capital can support your aims. There’s no need to take increased personal risk to boost growth.
Firms like The5ers, FTMO, and FundedNext have evaluation programs that provide traders with multiple options to get access to larger trading accounts depending on every firm’s conditions and eligibility.
If your journal shows consistent execution and managed drawdowns, The 5ers is worth exploring. Traders must comprehend the assessment programs’ precise profit targets, loss restrictions, and other rules before paying an evaluation charge. Terms are subject to change. Check current program terms directly with the firm.
The idea is simple: if you already have a tested technique, an evaluation may give you an organized manner of proving it without instantly committing the same amount of personal wealth to a larger trading account. It does not get rid of financial risk, secure finances, or turn an unproductive strategy into a lucrative one.
Before joining, review drawdown calculations, trading restrictions, payout conditions, fees, and rules for your desired instruments and strategy. Your value-zone strategy has to operate within those limits, without you having to overtrade.
FAQs About Intraday Value Zones
What is the best indicator for calculating intraday value zones?
The simplest way to calculate VAH, VAL and POC is using a session based volume profile. VWAP can be an additional reference for the average traded Price but it does not calculate the same bounds.
Is the 70% value area rule always accurate?
It is a standard approach to establish the value region, not a prediction that the price will stay inside it 70% of the time. Various profile settings, data flows, and session definitions can result in various boundaries.
Should day traders use previous-day or current-session value zones?
Both are helpful. Previous-day levels are fixed reference values, and an evolving session profile demonstrates how acceptance may be changing. So comparing them helps to identify a rotation inside a known value vs a possible transition to a new value.
Do intraday value zones work for forex and gold?
They can help arrange the intra-day price activity, but results depend on data quality and the instrument. Tick volume from brokers is not the same as the overall traded volume globally as spot forex and many CFDs do not have a consolidated exchange volume feed.
Can I trade every touch of VAH or VAL?
No. A touch is an observation, not a signal to take a trade. Look for a rejection, acceptance, a failed breakout, or continuation that fits a tested method. Don’t force transactions in a random way while Price is bouncing about the POC.
Final Thoughts
The intraday value zones become beneficial when you stop thinking of them as automatic entry and exit lines. They are a technique to understand where the market used to put in activity and to see if the Price is accepting or rejecting such places.
Here’s your challenge for the following 20 trading days: note the value area of the previous day, and mark how much Behave at both limit prices. Classify each interaction according to rejection, acceptance, or hesitation. Do this before you add more indicators or change your entry approach.
At the end of the sample, review the evidence. Keep the conditions that improve your decisions and discard the assumptions that do not survive testing.
For your next read, explore how to build a trading edge through session-based analysis. The aim is not to find a level that is free from failure. It’s a technique to advise you when it makes sense to trade, when the evidence is thin, and when the wisest decision is to safeguard your capital.