
A rising wedge on a five-minute chart can look bearish. A descending triangle can look like an obvious short. A bearish flag can appear ready to break at any moment.
Yet plenty of these textbook patterns fail.
The problem is usually not the pattern. It is the location.
A wedge formed after a major session expansion is not the same trade as a wedge formed inside a quiet midday range. The same shape can represent exhaustion in one environment and simple consolidation in another.
That is where session wedges become useful.
By a session wedge, I mean a price structure that develops inside the range, liquidity, and volatility conditions of a specific trading session. It is not a separate classical chart pattern. It is a way of adding time-of-day context to familiar structures such as the rising wedge pattern, descending triangle pattern, and bearish flag pattern.
The goal is simple: instead of asking if a pattern appears negative, ask if the session has established a situation where bearish pressure has a reason to matter.
Why Session Context Changes Pattern Quality
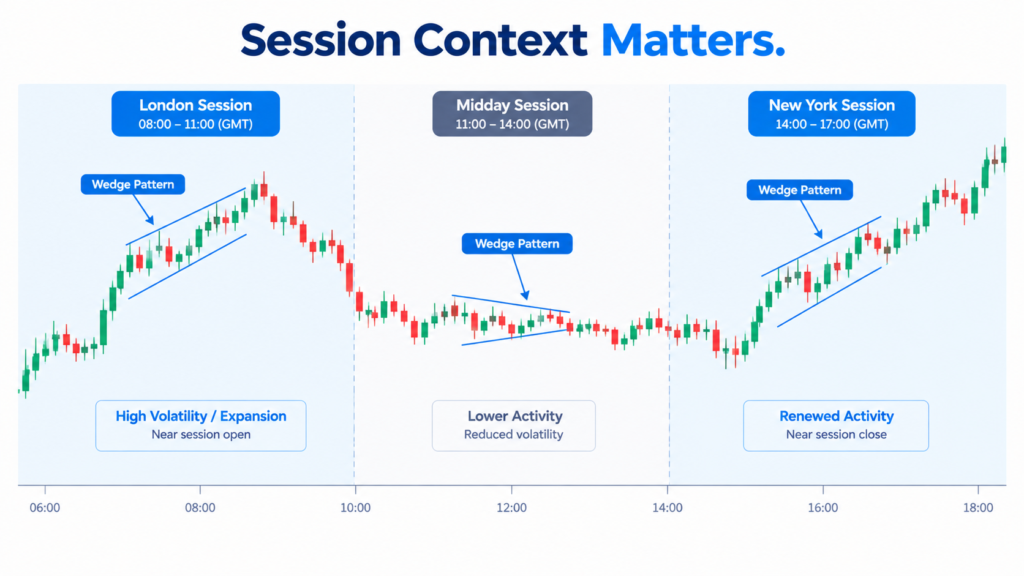
Intraday markets do not distribute activity evenly throughout the day.
Research on U.S. equities has repeatedly documented significant intraday variation in volume and volatility, with volatility particularly elevated around the market open. CME research also shows a U-shaped volume pattern in equity index futures, with substantial activity around the open and close and less activity during the middle of the session.
That matters because a pattern is ultimately an expression of order flow.
A rising wedge developing after a strong opening drive can represent buyers losing control while price continues grinding higher. The same wedge during a low-volume midday period may simply reflect compression.
Research from the NBER also shows that volatility and trading activity have persistent intraday characteristics rather than behaving randomly throughout the session.
For a day trader, the practical lesson is more important than the statistics: the clock changes the quality of the pattern.
See the NBER research on intraday volatility patterns and CME Group’s research on volume and liquidity for the underlying market evidence.
The Session Wedge Framework
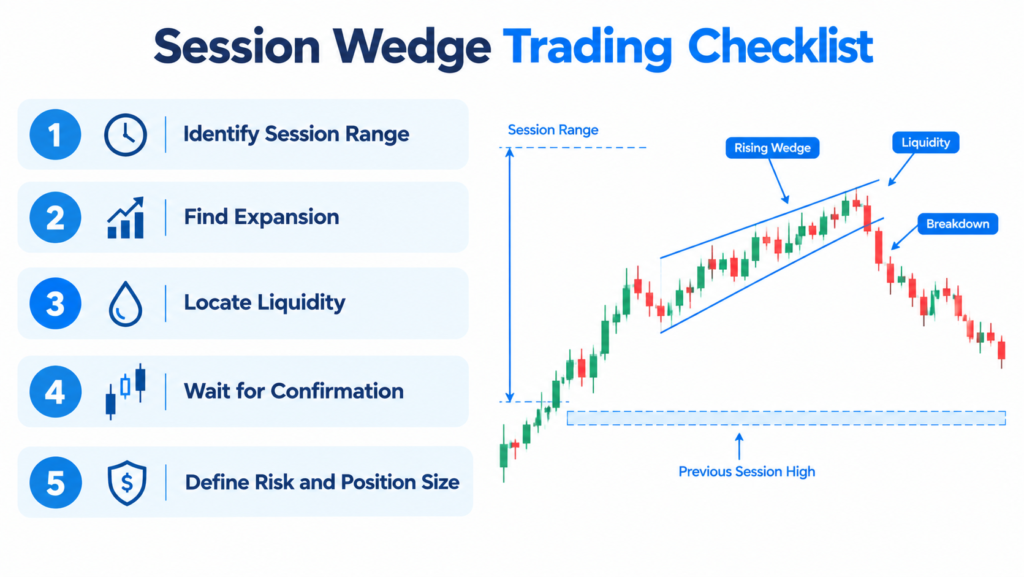
Start by marking three things before looking for the pattern: the session range, the session’s dominant impulse, and the obvious liquidity levels.
If the London session prints a high and low, and then price rallies aggressively toward the session high. For the following 30 minutes, price keeps setting slightly higher highs, but each push is getting smaller.
Now a rising wedge forms.
The inexperienced approach is too short because “rising wedges are bearish.”
The better approach is to ask what happened before the wedge.
If price has already expanded significantly, reached a prior resistance area, and started producing weaker upward extensions, the wedge becomes interesting because it may represent declining buying efficiency.
If price has barely moved and the wedge is forming in the middle of the session range, there is much less evidence.
This distinction is one of the most useful ways to filter false signals.
Look For Compression After Expansion
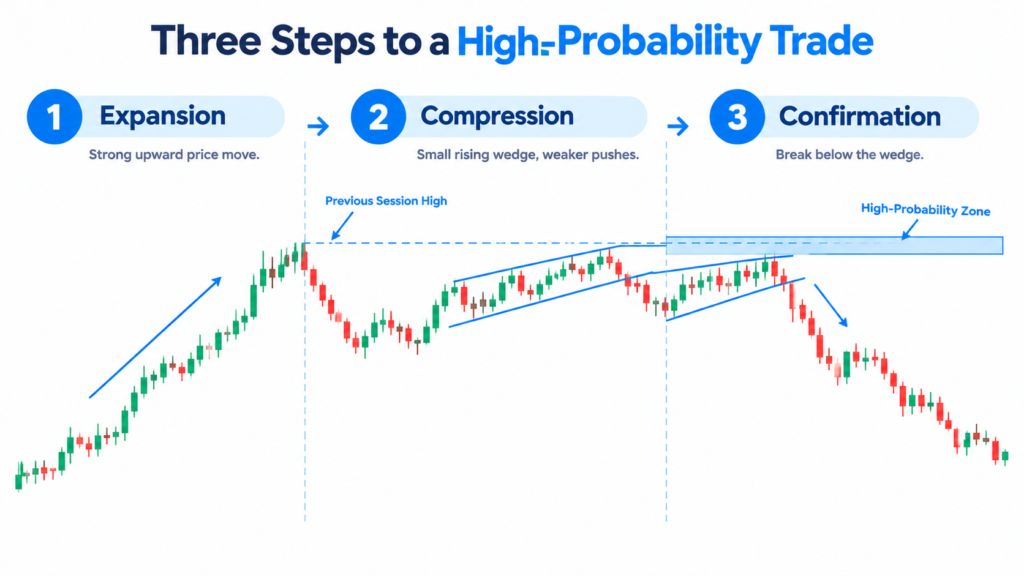
One of the strongest session-wedge environments is expansion followed by compression.
Imagine price moves 1.5 times its recent average candle range during the first part of the session. It then stops advancing efficiently. Candles become smaller, pullbacks overlap, and the highs continue rising by increasingly small amounts.
That is more informative than the wedge shape itself.
The market has already demonstrated directional intent. The wedge tells you that the efficiency of that move is deteriorating.
This is where a session-specific stop-loss method becomes useful. The stop should reflect where your trade thesis becomes invalid, while the session’s volatility determines how much breathing room that thesis requires.
Mapping The Actual High-Probability Zone
Do not mark the entire wedge as a trade zone.
Instead, identify the area where three pieces of information overlap.
The first is structural location. Is the wedge pressing into a previous session high, low, opening range, prior-day level, or another meaningful area?
The second is liquidity. Are traders likely to have stops sitting beyond the obvious swing high or low?
The third is momentum deterioration. Is price traveling farther with less efficient movement?
When those conditions overlap, the zone becomes much more interesting.
The price breaks out above a high of the London session and fails to hold the breakout, forming a small rising wedge under the new high. The initial move away from the high may have attracted some breakout buyers and triggered some short stops. If the price then falls below the level and breaks the internal structure of the wedge, the setup provides more than just “rising wedge equals short”.
This is closely related to the way liquidity sweeps work around obvious levels.
When A Descending Triangle Is Actually Useful
The same logic works in reverse.
A descending triangle is often described as a bearish continuation pattern because sellers repeatedly attack horizontal support while highs become lower.
But location matters.
A descending triangle sitting directly beneath a major session low after an extended selloff may actually be vulnerable to a failed breakdown. Sellers may already be crowded.
A descending triangle forming after a weak bounce into resistance can be much more attractive for continuation.
The question is not whether support will fail.
Ask what happened before the support was tried.
Did we see any aggressive selloff?
Was the bounce bad?
Did buyers take back any major level?
Did volatility rise during the approach?
The answers provide the context that the pattern itself cannot provide.
The Bearish Flag Has The Same Problem
Bearish flags are particularly easy to misuse.
A sharp selloff followed by a small upward channel looks bearish. But not every pause after a selloff is a continuation opportunity.
If the original decline was news-driven and price has already traveled an unusually large distance, the flag may represent exhaustion rather than preparation for another leg lower.
This is why breakout exhaustion deserves as much attention as breakout continuation.
A useful rule is to compare the flag with the move that created it.
The larger and faster the initial impulse, the more carefully you should examine whether the next consolidation is continuation or absorption.
Your Session Wedge Entry Should Have A Trigger
Mapping a high-probability zone does not mean placing a limit order simply because price reached it.
Wait for evidence that the zone is responding.
That could be a failed breakout, a break of the wedge’s internal structure, a strong rejection candle, a lower high, or a volume-backed move away from the zone.
Volume here is to be interpreted with care. “Volume indicates participation but cannot on its own tell you if traders are buying or selling,” CME says.
That is an important distinction.
A spike in volume at resistance is not inevitably bearish. Only when price response shows that the additional involvement did not result in persistent upside progress does it become important.
Our guide on how to know if breakout volume is real explores this distinction in more detail.
Risk Management: Let The Pattern Determine The Stop
The most common mistake with session wedges is entering first and figuring out risk afterward.
Reverse that process.
First, define where the trade idea is invalid.
If you are shorting a rising wedge after a failed session-high breakout, the invalidation might be above the liquidity sweep and structural high.
Then calculate the position size from that stop.
This is where most traders miscalculate risk. Using the Position Size Calculator removes guesswork and allows position size to adapt to the stop rather than forcing the stop to fit the desired position size.
A wider stop should generally mean a smaller position, not an artificially tight stop.
Journal The Zone, Not Just The Trade
Your journal needs to answer a more basic question than “Did I win?”
Session record, range size, wedge location, previous impulse direction, distance from session high/low, liquidity event, confirmation trigger, stop distance and final R outcome.
Then review the trades in groups.
You may discover that your rising wedge trades work well after London expansion but perform poorly during New York lunchtime.
You may find that bearish flags work when the first impulse is moderate, but fail after extreme news candles.
That is where your actual edge begins to emerge.
Use the downloadable Trade Journal Template to turn these observations into measurable data rather than relying on chart memory.
Scaling An Edge Beyond Your Own Capital
But even a careful trader can hit a capital crisis.
You may have a repeatable system, regulated drawdowns and positive anticipation but limiting personal capital can limit how much that edge can yield.
That is where evaluation programs can make sense, provided the trader treats them as a professional capital-allocation exercise rather than a shortcut to income.
The5ers currently offers evaluation structures with defined profit targets, maximum-loss rules, and daily-loss limits. Other firms, such as FTMO and FundedNext, offer their own evaluation models and rule sets.
The important point is not which firm’s headline account size looks largest.
It is whether your existing strategy naturally fits the firm’s risk parameters.
A trader who normally risks 0.5% and waits for session confirmation is far better positioned for an evaluation than someone who changes position size whenever a setup looks attractive.
Read the current regulations carefully before picking any program, as evaluation frameworks, drawdown calculations and trading limits may change.
FAQs
What is a session wedge in trading?
A session wedge is a wedge-shaped consolidation recognized in the liquidity and volatility circumstances and range of a single trading session. The meaning of the pattern can only be determined within the framework of the session.
Is a rising wedge always bearish?
No. A rising wedge can fail as a reversal pattern and continue higher. Its location, preceding trend, volatility, and confirmation matter more than the shape alone.
How do I trade a bearish rising wedge?
Look for a rising wedge near a key resistance level or session high, particularly after a long advance. Enter only when a confirmation such as a failed breakout or internal structure break occurs.
Is a descending triangle always bearish?
No. Descending triangles can produce false breakdowns, particularly after extended selling or when the pattern forms around important liquidity.
What makes a bearish flag high probability?
A bearish flag gets more compelling with a clean negative impulse followed by a controlled consolidation under significant resistance. It may look like a flag but that doesn’t mean it’s continuing.
Should I use volume with session wedges?
Volume can help confirm participation and the market’s response, but high volume alone does not identify direction. Price response remains essential.
How should I size a session-wedge trade?
First, identify what structural invalidation is. Calculate the stop distance. Then, scale your position size to keep your account risk at your predetermined level.
Final Thoughts
The real advantage of session wedges is not the wedge.
It is the context.
A pattern becomes considerably more useful when you know what the market did before forming it, where the session created liquidity, whether volatility expanded or contracted, and whether price is responding to an important level.
For the next 20 trades, make one change to your process: stop recording the pattern alone and start recording the session conditions around it.
After enough samples, you may discover that your best setups are not the prettiest wedges on the chart. They are the wedges that appear in the right place, after the right type of expansion, with the right confirmation.
For your next read, explore how to use session heatmaps for entry timing and compare your best session-wedge trades against the periods when volatility and participation actually supported the setup.