
The frustrating reversal is not the one you miss.
It is the one you enter because a candle looks perfect, only to watch the price move another 20 points against you before finally turning.
I have seen this happen again and again with otherwise capable day traders. They see a hammer, engulfing candle, shooting star, or double rejection at a key level. Textbook kind. The entry appears obvious. But the trade fails.
The missing piece is usually volatility.
A reversal is not simply a candle changing color. It is a change in the way the price is moving. The useful question is not, “Did I get a bullish reversal candlestick pattern?”
It is, “Did the volatility behavior tell me that the previous side is losing control?”
That distinction changes how you read reversals.
Volatility contraction, expansion, failed expansion, range compression, and unusually large candles can provide information about whether a reversal has genuine potential or is simply a temporary pause.
This guide combines that market behavior with established volatility research and practical day trading experience to build a framework you can actually use.
Why Volatility Matters More Than the Reversal Candle
Volatility comes in clusters. Big moves tend to be followed by lots of price action, but quiet periods tend to stay quiet. We see this in financial markets, and it underpins modern theories of volatility.
For a day trader, this matters because volatility tells you something about the environment surrounding the reversal.
Imagine a stock has fallen aggressively for 30 minutes.
The candles are getting larger.
The ranges are expanding.
Each bounce is immediately sold.
Then suddenly the stock prints a hammer.
Many traders buy immediately.
I would wait.
The hammer tells me sellers were rejected at that moment. It does not yet tell me that selling pressure has disappeared.
Now consider the same hammer after three increasingly smaller bearish candles, narrowing ranges, and repeated failures to make a fresh low.
That is a different setup.
The candle is similar.
The volatility story is not.
This is one of the most important ideas when studying volatility pattern reversals: the quality of a reversal signal depends heavily on what volatility was doing before the signal appeared.
What Research Says About Volatility and Reversals
Cboe describes the VIX as a forward-looking measure of expected S&P 500 volatility derived from SPX option prices. It also notes that volatility itself has historically displayed mean-reverting characteristics.
You do not need to trade VIX products to use this concept.
At the intraday level, think of volatility as moving through phases.
Price can move from compression into expansion, remain elevated, then eventually lose momentum and contract again.
That transition can help identify when a trend is becoming exhausted.
Research on candlestick patterns also gives us an important warning. Some studies have found statistically significant behavior around particular candlestick formations, while other research has found that most reversal patterns do not reliably predict direction by themselves.
That is exactly why I would never build a day trading strategy around “hammer equals buy” or “shooting star equals sell.”
The candle is evidence.
Volatility is context.
Location is context.
Market structure is context.
The combination is what creates a trade.
The Four Volatility States I Watch
Rather than trying to memorize dozens of bullish reversal candlestick patterns and bearish reversal candlestick patterns, start by classifying the volatility environment.
Expansion After a Long Move
This is where traders often make their biggest mistake.
A stock has already moved aggressively, then suddenly produces an even larger candle.
The instinct is to call the move exhausted.
Sometimes it is.
Sometimes it is the beginning of another acceleration phase.
The key is what happens immediately afterward.
If the large candle is followed by continued wide ranges in the same direction, there may still be genuine momentum.
If the large candle is followed by rejection, smaller ranges and an inability to extend, exhaustion becomes more interesting.
Think of the large candle as a warning that the market has reached an emotional state, not as proof of a reversal.
Volatility Contraction Near an Extreme
This is one of my favorite reversal environments.
Suppose the price has been trending lower and approaches an important daily support level.
The first selloff is aggressive.
The next push lower is smaller.
The third attempt barely makes a new low.
Now the market is compressing near the extreme.
This tells you something important.
Sellers are still trying, but their ability to create additional movement is deteriorating.
A bullish reversal candlestick pattern appearing here becomes much more meaningful.
The trade is not based on the hammer.
It is based on failed downside expansion followed by evidence of buyer response.
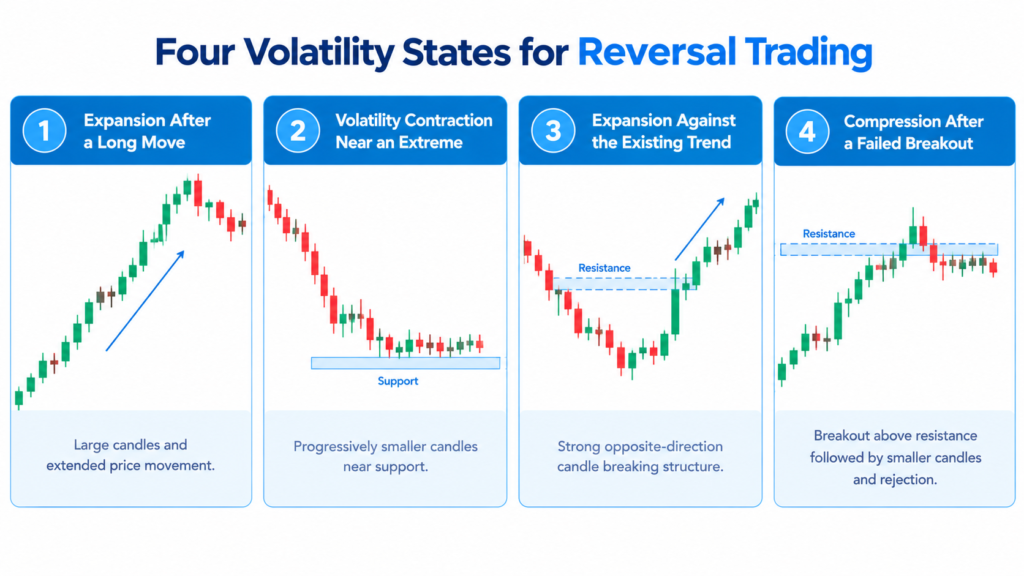
Expansion Against the Existing Trend
This is another powerful clue.
Imagine a stock has been trending higher with relatively controlled candles. Suddenly, a large bearish candle appears and closes near its low.
That doesn’t always mean short.
Instead, ask whether the structure has been affected by the volatility expansion.
If a bearish candle takes out a significant swing low and shows follow through, and buyers cannot retake the broken level, you may be looking at a real regime transition.
If the next candle immediately absorbs the selloff and closes back inside the prior range, the expansion may have been a liquidity event rather than a new bearish trend.
Compression After a Failed Breakout
This is particularly useful for intraday traders.
Price breaks resistance.
The breakout candle is large.
Then something feels wrong.
The next candles become smaller.
Volume may remain elevated, but price stops advancing.
Eventually, the price slips back below the resistance.
That sequence is much more interesting than the initial breakout.
The failed expansion has now become information.
Buyers had enough force to break the level, but not enough force to sustain the move.
That is often where a reversal setup begins.
For traders who already use levels heavily, this works well alongside intraday support and resistance analysis.
My Practical Reversal Framework
When I see a potential reversal, I work through five questions.
First, where is the price?
A reversal in the middle of nowhere is usually less interesting than a reversal at a previous high, low, VWAP area, daily level, major support or resistance zone.
Second, what has volatility been doing?
Was the range increasing, shrinking, or remaining chaotic?
Third, did the final push really prolong the move?
Important.
If you have three efforts at a low in a row and each time you make less and less progress, the market is warning you that it is getting expensive to continue.
Fourth, what did the rejection accomplish?
A wick by itself means little.
A rejection that reclaims a broken level means much more.
Fifth, what happens after the reversal candle?
This is where many traders enter too early.
Instead of buying the first green candle after a decline, wait to see whether the price can hold the reversal area and produce follow-through.
You are sacrificing a little entry price for better information.
That trade-off is often worth it.
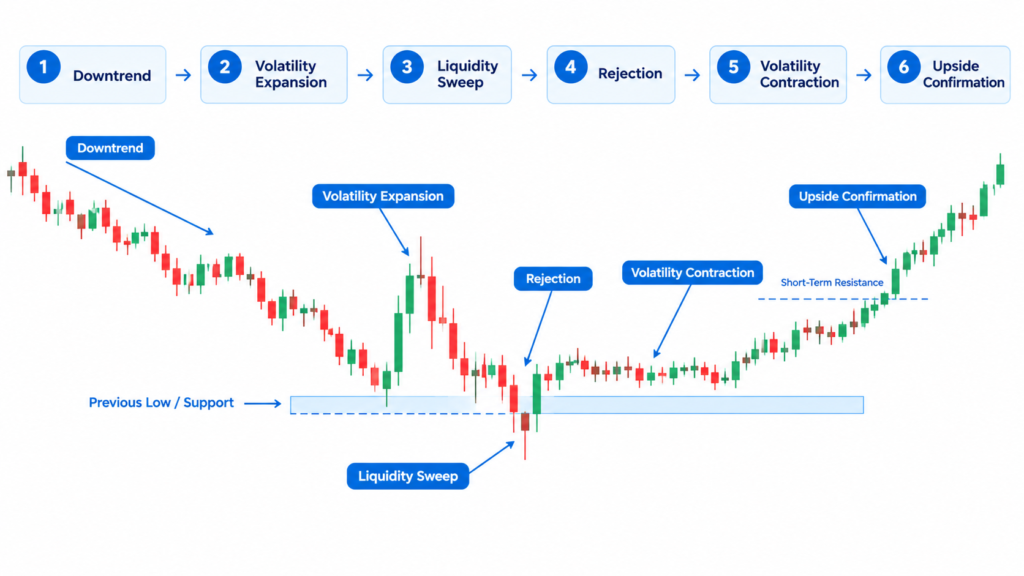
A Realistic Intraday Example
The index opens weak and then declines steadily in the first hour.
The average candle range grows as the sellers get faster.
The price tests the low of the previous day.
The next candle pushes that level below but closes back above it with a long lower wick.
Interesting.
But not enough.
The following candle is small and remains above the previous low.
Now, volatility has contracted.
A third candle breaks the small consolidation upward.
That is a much stronger reversal sequence.
The setup is essentially:
downtrend → volatility expansion → liquidity sweep → rejection → volatility contraction → upside confirmation.
The reversal is not the candlestick.
The reversal is the change in auction behavior.
That is the distinction that experienced traders eventually develop.
Why Reversal Traders Get Trapped
The biggest trap is confusing volatility with direction.
A sudden increase in volatility does not tell you whether the next move will be higher or lower.
It only tells you that the market is repricing aggressively.
Cboe makes the same distinction with the VIX. It measures the expected magnitude of movement, not whether the S&P 500 will rise or fall.
This is why a huge bearish candle should not automatically make you bearish.
And a huge bullish candle should not automatically make you bullish.
Instead, watch what happens after the expansion.
Does the price accept the new area?
Or does it reject it?
That question is often more valuable than the candle itself.
Combining Volatility With Candlestick Reversal Patterns
Candlestick patterns become more useful when treated as confirmation rather than prediction.
A hammer after a controlled decline into support can provide a useful bullish trigger.
A bearish engulfing candle after a failed breakout can provide a useful short trigger.
A shooting star after an extended rally can become meaningful when the next candle fails to reclaim its high.
A morning star or evening star can provide additional confirmation when volatility is transitioning around an important level.
But none of these patterns should receive the same weight in every environment.
This is consistent with the broader evidence. Research has produced mixed results regarding the standalone predictive power of candlestick formations.
That is why I prefer asking:
What changed?
If nothing changed except the candle color, there may be no trade.
If volatility changed, structure changed, and price rejected an important level, now you have a reason to pay attention.
The Risk Problem Most Reversal Traders Ignore
Reversal setups often require wider structural stops than breakout trades.
That creates a sizing problem.
Suppose you normally risk $100 with a 10-point stop.
Your reversal setup requires a 20-point stop because the market is volatile.
Keeping the same position size doubles your actual risk.
This is where a lot of traders get the risk wrong. The Position Size Calculator takes the guesswork out of position sizing by letting the position size react to the actual stop distance.
The correct order is simple:
First, locate the invalidation point. Calculate the second position size. Third, go in.
Never tighten the stop simply because the desired position size feels too small.
The market does not care how much you want to risk.
Execution: Confirmation Is Not the Same as Chasing
There is a fine line between waiting for confirmation and entering too late.
A useful compromise is to define your trigger before the market reaches the reversal area.
For example, you might decide:
“If price sweeps support, closes back above it, contracts for one candle and then breaks the short-term high, I enter.”
Now you are not improvising.
This approach fits naturally with a broader rule-based trading process. If emotional execution has been a problem, the site’s guide on day trading psychology and staying disciplined is worth reading alongside this framework.
Journal the Volatility, Not Just the Trade
A normal trade journal might tell you that you lost five reversal trades.
That is not enough.
You need to know which volatility environment produced those losses.
Log whether there was pre-entry volatility, if the reversal candle was big relative to recent candles, if the price broke a previous high or low, if the move happened at a critical level and if you have confirmation before entering.
After 30 or 50 trades, you may discover something surprisingly specific.
Perhaps your reversals work beautifully after volatility contraction, but perform terribly when you attempt to fade first-stage expansion.
That is a real edge.
Your Trade Journal Template can help structure this review instead of leaving the information scattered across screenshots and notes.
The goal is not to collect more statistics.
The goal is to discover which version of your setup deserves your money.
Scaling the Edge Beyond Your Own Capital
There is another issue that becomes obvious once a trader develops a repeatable reversal strategy.
Skill can grow faster than capital.
A trader might have a legitimate edge, consistent risk management, and several months of disciplined execution, yet still be limited by the amount of personal capital available.
That is where evaluation programs can become relevant.
The 5ers, FTMO, and other proprietary trading firms use evaluation structures to assess traders against predefined rules. The important point is that these programs should be viewed as a test of an existing process, not as a shortcut to becoming profitable.
For example, The5ers currently describes its High Stakes program as a two-step evaluation conducted in a simulated environment, with defined daily and maximum loss limits and scaling rules. Its Bootcamp program provides another multi-step evaluation structure.
The5ers also explicitly states that its evaluation stage is simulated and intended for traders who already have trading experience.
That distinction matters.
If your reversal strategy only works when you double your size after a losing trade, an evaluation account will probably expose the weakness.
If your strategy works because you control downside, wait for volatility confirmation, and execute consistently, an evaluation can potentially provide a route to scaling that process.
If that describes your current stage, you can review The5ers evaluation programs and compare their rules with alternatives such as FTMO or FundedNext before deciding whether an evaluation actually fits your trading style.
Do not choose a program because the advertised account size looks impressive.
Choose based on whether its drawdown structure is compatible with the way you genuinely trade.
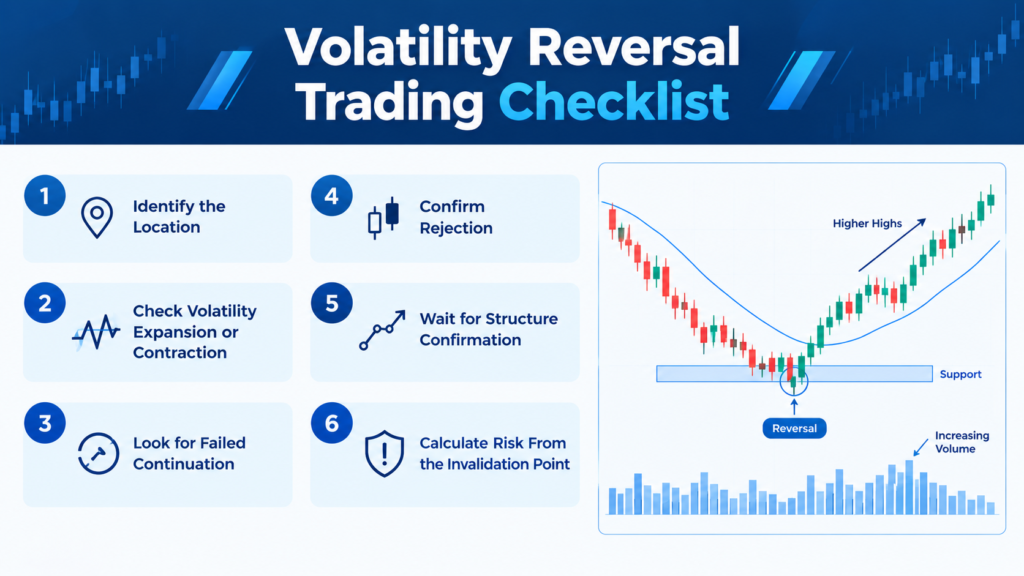
The Reversal Checklist I Would Use Tomorrow
Before taking a reversal, ask yourself one question:
Is volatility confirming my idea, or am I using a candle to predict the market?
Then assess the location.
Assess the preceding expansion or contraction.
Assess whether the final push produced meaningful progress.
Assess the rejection.
Assess the confirmation.
Finally, calculate the risk from the actual invalidation point.
If several pieces are missing, there is no requirement to trade.
That is an important psychological shift.
A reversal trader does not need to catch every turning point.
The objective is to participate when the market gives enough evidence that the probability and payoff justify the risk.
FAQs
What volatility pattern is best for identifying reversals?
There’s no best pattern. Volatility expansion to a key level, failed continuation, rejection, and contraction is a beneficial sequence. Behavior modification is more important than one candle.
Can a candlestick pattern confirm a market reversal?
It proves, without confirming. These patterns are more beneficial when they are consistent with volatility and market structure.
How do I know if high volatility means continuation or reversal?
Watch what happens after the volatility expansion. If the price continues making progress with wide ranges, continuation may still be dominant. If the range expands but the price stops making progress and begins rejecting the extreme, exhaustion becomes more likely.
Should I use ATR to identify volatility reversals?
ATR might enable you to measure how large or small the current movement is relative to recent situations. However, ATR measures magnitude, not direction; therefore, pair it with structure, location, and price behavior.
Are bullish and bearish reversal patterns equally reliable?
Not necessarily. Depending on the market, time horizon, regime, and transaction costs, their performance may vary. Contextual confirmation is crucial because research has found mixed evidence for using a single candlestick to predict price.
Should I enter immediately after a reversal candle?
Not always. Waiting for a market recapture, rejection zone hold or short-term structural break could reduce false signals. Better knowledge of a less favorable entry price.
How should I journal volatility-based reversal trades?
Pre-Entry Volatility, Location, Candle Ranges, Reversal Pattern, Confirmation Trigger, Stop Distance, Position Size, Result in R. See the sample of 30 trades; do not judge the method on a couple of wins or losses.
Final Thoughts
The finest reversal traders are seldom the first to call turning points.
They feel the market moves.
They listen when hostility doesn’t work.
They see when volatility falls to a low.
They see a breakout starting and then promptly fail.
Most importantly, they don’t confuse a visually pleasing candle with a real change of control.
Here is an exercise for your next 20 trades. Instead of just writing down the reversal pattern, write down what the volatility was doing before and after it showed up.
You may discover that your real edge was never the hammer, engulfing candle, or shooting star.
It was learning to recognize when the market could no longer continue behaving the way it had been behaving.
For the next step, revisit How to Read Candlestick Patterns for Day Trading and combine the candle itself with the volatility framework above.