
Most scalpers do not lose because they cannot identify volatility.
They lose because they enter at the wrong stage of volatility.
That distinction matters.
Charts can turn into speed demons, candles can blow up, spreads can widen and prices can move farther in ten seconds than they did in the last five minutes. Usually the knee-jerk reaction of the novice is immediate: volatility is here, so this must be the Opportunity.
Often, that is exactly when the Opportunity is already gone.
The best scalping entries are rarely based on volatility alone. They come from understanding where the volatility burst started, what caused it, whether participation is expanding or collapsing, and whether enough movement remains after your entry to justify the risk and execution cost.
This is where many scalping strategies become too simplistic. A trader sees a large candle and enters. Another waits for a breakout and enters three ticks late. Another uses an ATR indicator but treats every increase in ATR as a buy or sell signal.
None of these approaches addresses the question that really matters:
Is this volatility explosion a new opportunity, or confirming an existing move, or finishing one?
In this essay I develop a practical methodology for timing scalping entries during bursts of volatility. The idea is not to anticipate every explosive play. It is to identify the situations under which short-term Expansion is most likely to create sufficient follow-through to overcome spread, slippage, stop distance and reluctance.
The Real Problem With Scalping Volatility
A common misconception is that more volatility automatically means better scalping conditions.
That sounds logical. Scalpers need movement. If the market barely moves, there is little Opportunity to capture.
But volatility has two very different personalities.
The first is organized volatility.
Price expands in a direction, pulls back in a controlled way, attracts participation, and continues. The market may be moving quickly, but the structure remains readable.
The second is disorganized volatility.
Price jumps, reverses, spikes again, sweeps stops, widens spreads, and creates large candles that overlap each other. Movement is high, but directional Opportunity is poor.
A scalper who measures only candle size cannot distinguish between these two environments.
That is why the first job is not to find volatility.
The first job is to classify it.
A useful way to think about a volatility burst is:
Quality of Volatility Burst = Expansion x Directional Efficiency x Available Remaining Range
Poor directional efficiency if price moves away but then reverses sharply.
If the price grows neatly but has already traversed most of its realistic intraday range, the available remaining range may be limited.
If both are present, the burst may be worth trading.
This is the gap between simply seeing movement and actually timing a trade.
What Market Research Teaches About Volatility Bursts
High-frequency market behavior has been studied extensively because short-term price changes are heavily influenced by liquidity, order flow, transaction costs, and the arrival of information.
The impact of market liquidity and electronic trading on execution and price formation has long been studied in research and teaching material from the Bank for International Settlements. One practical lesson for active traders is that quick markets do not only create larger possibilities. They can potentially create worse execution as liquidity thins out.
For a scalper, that means a ten-pip movement is not automatically a ten-pip opportunity.
If two pips delay your entry, your spread expands by one pip, and your stop must be wider because the market is unstable, the apparent Opportunity can deteriorate quickly.
The CME Group education resources also provide useful material on volatility, liquidity, and market mechanics. The important takeaway for a short-term trader is that volatility must always be viewed alongside market participation. A fast move occurring with strong participation has a different character from a fast move occurring through thin liquidity.
Academic research on volatility also supports the idea that volatility tends to cluster. Quiet periods are often followed by Expansion, while highly volatile periods can remain volatile for some time. The useful implication is not that traders should unthinkingly buy volatility. A trader must identify transitions between volatility states.
That transition is often where the cleanest scalping Opportunity appears.
The keyword is transition.
Entering after volatility has already been extreme for several minutes is very different from entering when a compressed market first begins to expand.
The Three Stages of a Tradable Volatility Burst
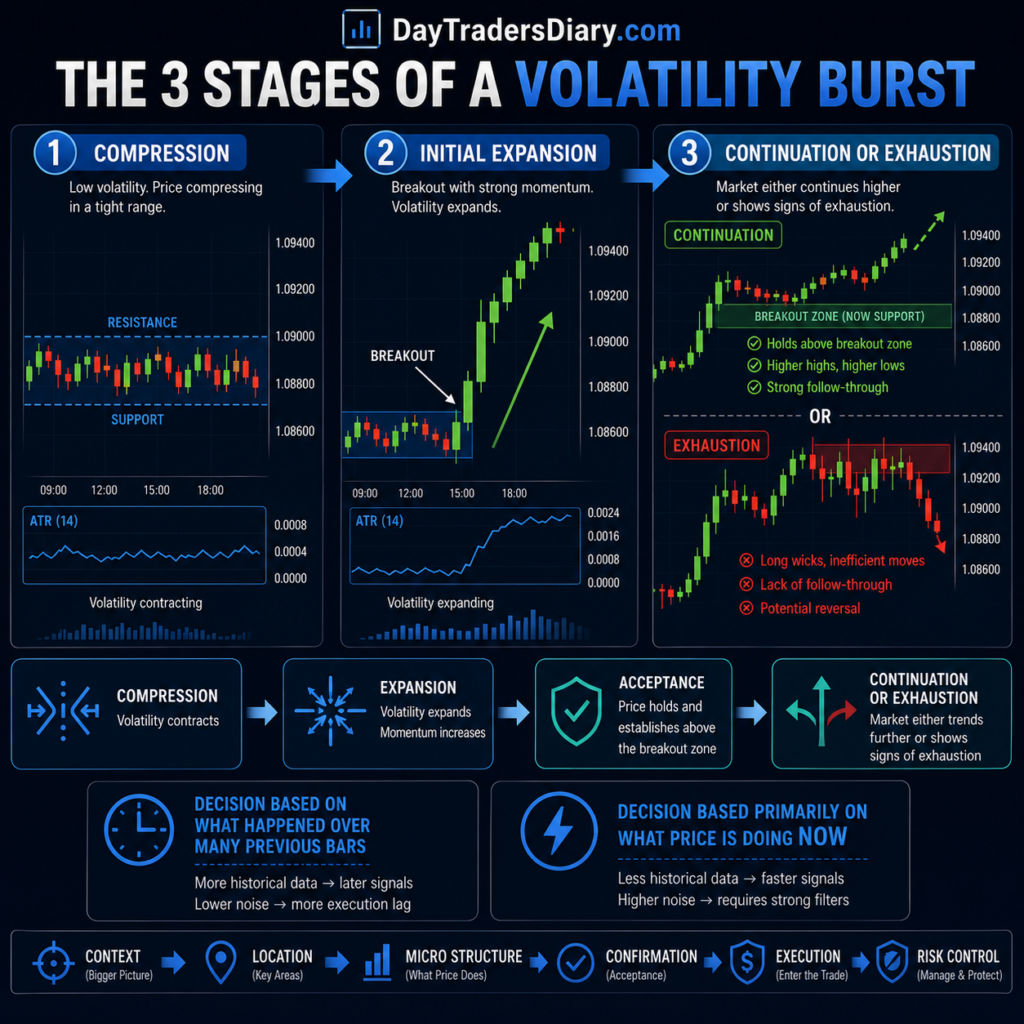
For practical scalping, I divide a volatility burst into three stages:
Compression
Initial Expansion
Continuation or Exhaustion
The mistake many traders make is treating all three stages as entry signals.
They are not.
Stage One: Compression
Compression is the time preceding the explosion.
Candles shrink. Price range narrows. Short term swings overlap. Realized movement diminishes.
And that’s where traders typically get irritated.
The chart looks dead.
But from an execution perspective, this phase is valuable because it gives you a reference point. You can identify where price is contained, where stops may accumulate, and what amount of movement would represent a genuine change in behavior.
Without compression, it is difficult to know whether the next large candle is meaningful.
A large candle after twenty minutes of tight consolidation is information.
A large candle in the middle of an already chaotic market may be noise.
This is similar to the logic behind learning how to filter noise on 5-second charts. The smaller the timeframe, the more important it becomes to distinguish a genuine change in market behavior from random short-term movement.
Stage Two: Initial Expansion
This is where the Opportunity begins but also where impetuous traders often jump in too late.
The initial expansion should answer three questions:
Is there a big price range in the short term?
Second, did the movement close efficiently, or did the candle leave a large rejection?
Third, is the next price behavior confirming the Expansion?
Suppose EUR/USD trades inside a five-pip range for several minutes.
Then the price breaks upward and travels four pips in a few seconds.
A breakout trader may immediately enter at the top.
A better scalper watches what happens next.
If price holds above the previous range, pauses briefly, and rejects attempts to return inside the range, the initial burst may be transitioning into continuation.
That pullback or pause can offer a better entry than chasing the first candle.
This is an important distinction.
The volatility burst identifies the Opportunity. The first controlled reaction often provides the entry.
Stage Three: Continuation or Exhaustion
This is where traders need to become more selective.
A volatility burst can continue, but every burst eventually loses efficiency.
One useful observation is that exhaustion often appears when the candle size remains large while directional progress decreases.
Imagine three consecutive bullish candles.
The first move is 8 pips and closes near the high.
The second move is 9 pips and also closes strongly.
The third has a 10-pip range but only closes 2 pips above the previous close.
Volatility is still high.
But efficiency is falling.
That difference matters.
The third candle may contain substantial two-way trading, profit-taking, or resistance.
A scalper who only measures range sees increasing volatility.
Maybe a trader measuring directional efficiency and getting tired.
A Practical Framework for Scalping Entry Volatility Bursts
I like to use a framework with four filters:
Acceptance and Growth
Accessible Range
Each filter eliminates different bad trades.
Filter One: Context Before the Burst
Before entering, identify where the burst is occurring.
A volatility burst has more value when it emerges from a recognizable condition such as a session range, micro support or resistance level, previous intraday high or low, or a period of compression.
For example, assume GBP/USD has spent fifteen minutes moving between two narrow levels.
Price then breaks the upper boundary with a sharp expansion.
The context is clear.
Now compare that with a sudden bullish candle appearing in the middle of a messy, overlapping range.
The candle may be the same size.
The context is completely different.
The first situation gives you a reason to believe something changed.
The second may be another fluctuation inside existing noise.
This is where understanding micro support and resistance levels becomes especially useful. On a scalping chart, the most relevant level is often not yesterday’s major support. It may be a short-term price area where recent order flow repeatedly changed behavior.
Filter Two: Measure the Expansion
You do not need a complicated institutional model to quantify a burst.
Start by comparing the current movement with the recent movement.
One simple method is:
Burst Ratio = Current Short-Term Range ÷ Average Range of Recent Short-Term Bars
Suppose the average range of the previous twenty-five 5-second candles is 0.8 pips.
The current candle travels 2.4 pips.
Your burst ratio is:
2.4 ÷ 0.8 = 3
The market is moving approximately three times its recent short-term average.
That tells you something changed.
But do not treat a high burst ratio as an automatic entry.
A burst ratio of 3 can represent a clean breakout.
It can also represent a stop sweep.
The ratio identifies abnormal activity. It does not tell you whether the move is tradable.
That requires the next filter.
Filter Three: Look for Acceptance, Not Just Breakout
Acceptance is one of the most useful concepts for scalpers.
A breakout happens when the price moves beyond a level.
Acceptance happens when price proves it can remain beyond that level.
These are not the same thing.
Suppose price breaks above resistance by three pips.
If it immediately falls back below resistance, there was no meaningful acceptance.
If price pulls back one pip, finds buyers, and continues trading above the level, acceptance is stronger.
This can be measured by simple questions like:
Did the price close outside of the range?
Did the following few bars lie outside the range?
Was the pull-back relatively mild compared to the initial burst?
Did the market quickly reject a return to the previous structure?
A practical rule is to compare the retracement with the burst.
For example:
Retracement Ratio = Pullback Distance ÷ Initial Burst Distance
Suppose the initial burst moves 6 pips.
Price then pulls back 2 pips.
The retracement ratio is:
2 ÷ 6 = 0.33
That is a relatively contained pullback.
If the burst moves 6 pips and immediately retraces 5 pips, the market is telling a different story.
The purpose is not to create a magical percentage.
It is to force yourself to measure whether the market is accepting the new price or rejecting it.
Filter Four: Estimate the Remaining Opportunity
This is where many scalpers destroy a good setup.
They correctly identify the burst but enter after most of the movement has already happened.
You need to ask:
How much movement is realistically left compared with what I must risk?
Suppose your strategy normally requires a 3-pip stop.
The market has already traveled 12 pips rapidly from the compression zone.
The next major resistance is only 3 pips away.
Even if the breakout remains valid, your trade quality may be poor.
The setup can be correct while the entry is bad.
This connects directly to the concept of entry deterioration. A delayed entry changes the risk profile of the trade even when the original idea remains valid.
Before entering, calculate:
Remaining Opportunity ÷ Required Risk
If the remaining realistic move is 6 pips and your stop requires 3 pips, the theoretical reward-to-risk is 2:1.
If you chase the move and now only 2 pips remain before nearby resistance, the trade has changed.
The chart did not become wrong.
Your entry became inefficient.
The Volatility Burst Entry Model
A practical model can be built around this sequence:
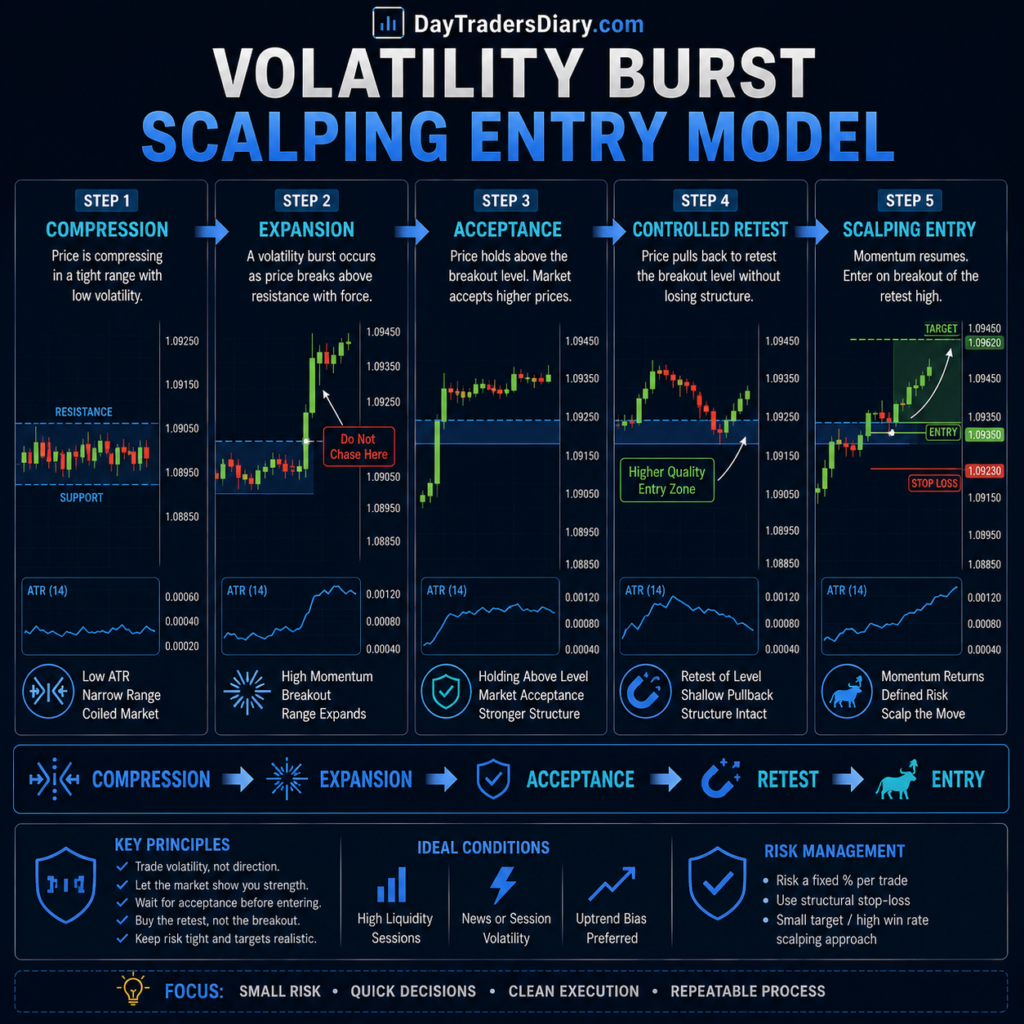
Compression → Expansion → Acceptance → Controlled Retest → Entry
This sequence solves one of the biggest problems in scalping.
It stops you from trying to predict the burst before it happens.
Instead, you allow the market to reveal the Expansion first.
Consider a simple scenario.
USD/JPY trades in a narrow 4-pip range.
The recent 5-second candles average 0.6 pips.
Suddenly, the price breaks the upper range and travels 2.5 pips.
The burst ratio is above 4.
Instead of entering immediately, you wait.
Price pulls back 0.8 pips but remains above the former range.
The next few seconds show renewed buying.
You now have information that was unavailable during the first breakout candle.
You know the market expanded.
You know, the price did not immediately collapse back into the range.
You know the pullback was smaller than the initial Expansion.
That does not guarantee continuation.
But it creates a structured reason for entry.
When You Should Enter the First Burst
Waiting for confirmation is not always the answer.
There are situations where the first burst provides the best entry.
This is more likely when several conditions align.
The market is under continued strain. The breakout happens on a busy trading day. Price cracks big intraday level. The blast closes nicely at the conclusion. Participation grows. It doesn’t tumble immediately. There is ample space to the next opposing level.
In these situations, waiting for a perfect pullback can mean missing the move entirely.
This is why a scalping method should not contain one rigid entry rule.
A better approach is to classify entries.
Type A: Immediate Expansion Entry
Use this when the breakout quality is really strong, and the market is coming out of a well-defined compression structure.
Type B: Acceptance Entry
Use this when the initial Expansion occurs, but the quality of continuation needs confirmation.
Type C: Retest Entry
This is used when price comes back toward the breakout area and gives a controlled opportunity with better risk placement.
Your diary should record these types of entries individually.
You may also find that your Type B trades win less often but have a superior average reward to risk ratio.
Or your Type A entries may work best during specific session windows.
Without separating the data, everything gets mixed into one vague category called “volatility trades.”
That makes improvement difficult.
The Hidden Enemy: Volatility After Liquidity Is Removed
One of the most dangerous scalping environments is a fast move caused primarily by reduced liquidity rather than strong directional participation.
The chart might be pretty.
Prices change fast.
Candles are alive.
But spreads widen and reversals are extreme.
That typically happens in times of market moves, surprising news and sudden liquidity gaps.
The practical clue is not simply the size of the candle.
Watch how the price behaves after the first move.
Strong directional participation often allows the price to build structure above or below the breakout.
Thin-liquidity movement may jump sharply and then retrace almost as quickly.
This is why the shape of the movement matters.
A tradable burst often creates a sequence.
Expansion.
Pause.
Acceptance.
Continuation.
A liquidity vacuum often creates a shock.
Spike.
Immediate reversal.
Overlapping chaos.
The difference can be only a few seconds, which is why scalpers need predefined observation rules.
You do not have time to invent a decision framework while the chart is moving.
Use Volatility Relative to the Time of Day
A 5-pip movement does not mean the same thing at every hour.
During a quiet session, it may represent an extreme burst.
During a major session overlap, it may be ordinary noise.
This is why absolute pip thresholds can fail.
Instead, measure movement relative to the market’s normal behavior during that time window.
For example, divide your trading session into time blocks.
You might measure the average 5-second range during:
The early London session.
The London-New York overlap.
The latter New York session.
Your volatility burst threshold should be relative to the baseline for that specific environment.
This is one reason a session heatmap for entry timing can become valuable. If your data shows that your best bursts occur during particular time windows, you can reduce exposure during periods that historically produce poor follow-through.
The objective is not to trade more hours.
It is to trade the hours where your setup has demonstrated better behavior.
How to Combine Volatility Bursts With Trend
A volatility burst against the dominant short-term structure requires more evidence than a burst aligned with it.
Suppose a 15-minute chart is trending upward and the 1-minute structure is also producing higher lows.
On the scalping chart, the price compresses during a pullback.
Then a bullish volatility burst appears.
The burst is aligned with the broader context.
Now consider the same burst appearing downward against a strong upward structure.
The second setup may still work.
But it should not be treated as identical.
Context alters the probability distribution.
One useful approach is to classify bursts into:
Bursts of trend continuance
Countertrend blowups
Range break bursts
Then look at them individually.
This way you avoid the most typical mistake in strategy development: mixing fundamentally diverse deals and presuming they are part of the same system.
A continuation burst after a controlled pullback has different logic from a reversal burst after an exhausted trend.
The Stop Placement Problem
Volatility bursts create a difficult execution problem.
The very movement that creates Opportunity can also force a wider stop.
This is why some scalpers enter too early. They see the burst, enter immediately, and place the stop inside the normal noise of the Expansion.
Then they are stopped out before the actual move continues.
Other traders make the opposite mistake.
They widen the stop dramatically to survive the volatility.
Now the position size becomes too large for the account risk.
The better approach is to define the invalidation point before calculating the size.
For a continuation entry, invalidation might occur when the price returns and holds inside the original compression range.
For a retest entry, invalidation might be beyond the low or high of the acceptance structure.
The exact distance is less important than the logic.
Once you know the actual stop distance, this is where the Position Size Calculator becomes useful. Most traders miscalculate Risk during fast markets because they think in lots first and stop distance second. The correct sequence is the opposite.
Define invalidation.
Measure the stop.
Then calculate the position size.
That removes guesswork when volatility changes from one trade to the next.
Why Scalpers Often Overtrade Volatility
Volatility creates psychological pressure.
When the chart is quiet, traders feel bored.
When the chart suddenly moves, they feel late.
That combination creates impulsive entries.
The problem is that the brain interprets speed as urgency.
But urgency in the market does not always mean urgency in your decision.
You need a rule that separates market speed from decision speed.
For example, your checklist may require only four conditions:
The burst must occur from an identifiable context.
The Expansion must exceed the normal short-term range.
Price must have acceptance or remarkable continuance quality.
The remaining Opportunity must justify the risk and execution cost necessary.
The trade is not necessarily unfavorable even if one requirement is lacking.
But it should be classified differently.
This is how you prevent hindsight from rewriting your strategy.
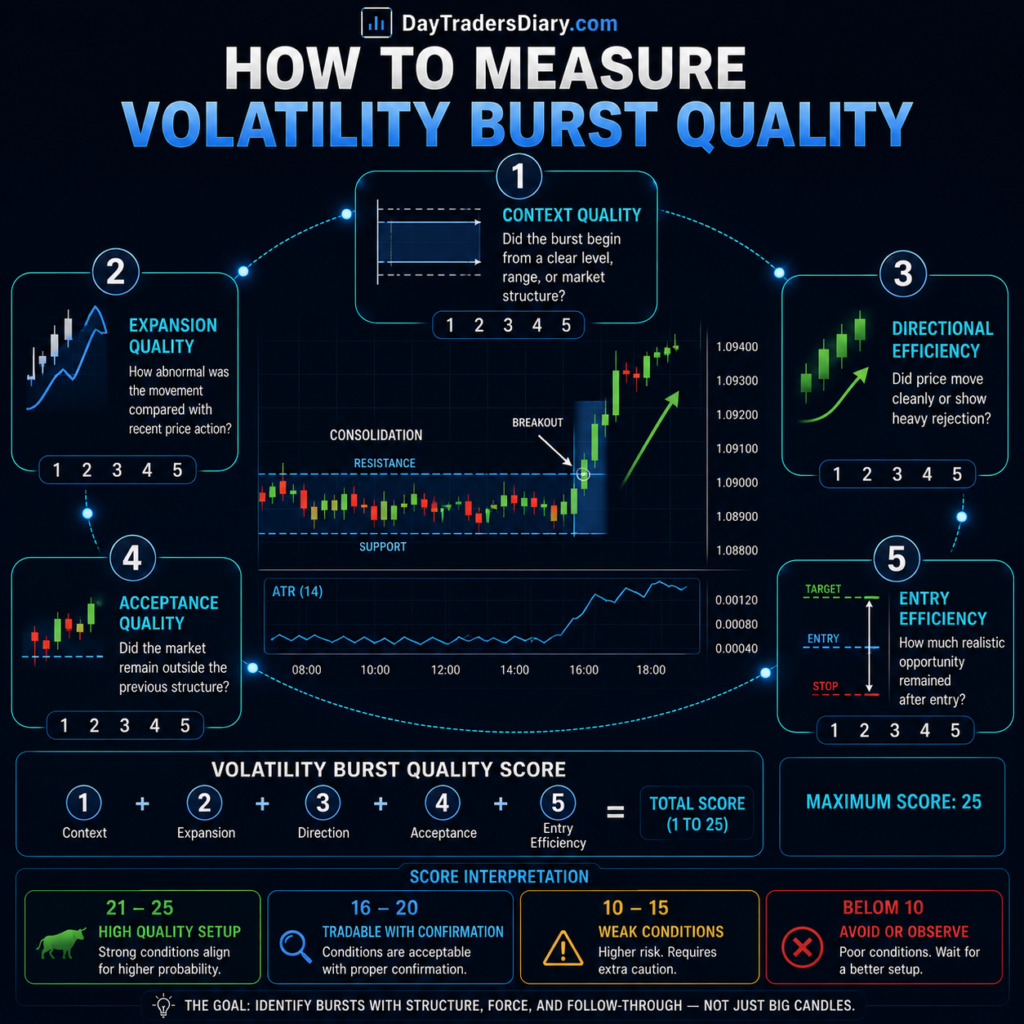
How to Measure Volatility Burst Quality
You can create a simple journal score without turning trading into a spreadsheet obsession.
Score each category from 1 to 5:
Context Quality
Was the explosion coming out of a distinct range, level, or structure?
Expansion Quality
How unusual was the movement in relation to recent price action?
Directional Efficiency
Did the price close near the direction of the move, or did it show heavy rejection?
Acceptance Quality
Did price remain outside the previous structure?
Entry Efficiency
How much Opportunity remained after your actual entry?
A trade with high Expansion but poor acceptance should look different in your data from a trade with moderate Expansion and excellent acceptance.
That is where the real edge often appears.
Not in finding the biggest moves.
In identifying which characteristics repeatedly precede follow-through.
Build a Volatility Burst Journal
If you want to improve this strategy, do not simply record whether the trade won or lost.
Record the environment.
For each volatility burst trade, record the session, market, time of day, size of the initial burst, average range prior to the burst, burst ratio, pullback size, whether or not price showed acceptance, type of entry, planned Risk, actual slippage and maximum favorable excursion.
The Trade Journal Template can help structure this process. The important point is to review the trades in groups rather than individually.
After twenty or thirty examples, ask better questions.
Do the strongest bursts occur after longer compression?
Do acceptance entries outperform immediate entries?
Do trades fail more often when the burst begins near a higher-timeframe level?
Does your strategy deteriorate after a certain amount of prior movement?
Does slippage eat up a large percentage of the planned profit?
Journaling research poses these questions.
Without them a journal is just a diary of feelings.
Together with them it becomes a decision database.
A Simple Review Process After Every 30 Trades
Every thirty volatility burst trades, separate the results into categories.
Compare immediate entries with retest entries.
Compare high burst ratios with moderate burst ratios.
Compare London, New York, and overlap conditions.
Compare trend-aligned and countertrend trades.
Then look for one variable that consistently damages performance.
You may discover that your worst trades occur when the burst has already traveled more than 70 percent of its normal session range.
The issue may not be your strategy.
Maybe you are entering too late.
This is why performance improvement usually comes from removing bad trades rather than endlessly searching for more signals.
A scalper does not need to trade every burst.
The edge may come from refusing the weakest 30 percent.
Scaling a Proven Scalping Edge
A trader can have a solid volatility-based method and still struggle to grow because personal capital limits position size and flexibility.
That is where evaluation programs can become relevant.
A professional trader does not use an evaluation account because it makes trading easy. The purpose is to access a larger capital structure while operating inside predefined risk rules.
The The5ers evaluation programs may appeal to traders who want a structured route toward managing larger amounts of capital. The details of any evaluation should be examined carefully, particularly drawdown rules, payout terms, scaling conditions, trading restrictions, and the instruments allowed.
It is also sensible to compare different models. FTMO and FundedNext, for example, offer different structures and rules that may suit different trading styles.
For a volatility scalper, this comparison is particularly important.
A fixed 3-pip stop strategy might act differently with daily drawdown limits, consistency criteria, execution rules or restrictions on news and holding periods.
The right evaluation account should fit the strategy.
The strategy should not be distorted just to fit the account.
Once your volatility burst method has a meaningful sample size, consistent risk parameters, and documented execution rules, considering a The5ers evaluation account can be a logical next step for traders who want to test whether their process can scale beyond personal capital.
When Volatility Burst Scalping Fails
No framework works everyplace.
The burst trading in volatility are especially vulnerable when the market is already extended, when the burst is driven by temporary illiquidity, when spreads widen sharply, when major news causes repeated reversals, and when the trader chases the third or fourth Expansion instead of the transition from compression to Expansion.
The biggest mistake is assuming that every fast candle contains information.
Sometimes it contains nothing more than a temporary imbalance.
Your job is to wait for the market to reveal whether that imbalance is becoming a new structure.
A Practical Pre-Trade Routine
Before entering a volatility burst trade, take time to answer the following five questions.
So what changed?”
The Expansion started in …
Did the price accept the new level?
How much of the shift has already taken place?
Where is the logical invalidation point?
If you cannot answer those questions quickly, you may not have enough structure to justify a scalp.
That does not mean the market will not continue.
It simply means you are being asked to guess.
There is a difference between missing a move and avoiding an undefined trade.
The first can be frustrating.
The second is often professional.
Frequently Asked Questions
What is a volatility burst in scalping?
A volatility burst is a sudden increase in short-term price movement compared with the market’s recent behavior. For scalpers, the important question is whether the Expansion produces directional follow-through or temporary noise.
What is the best scalping entry during a volatility burst?
There is no optimal way to go in. Strong breakouts may need fast entrances but with less dramatic bursts you often get more opportunity as price accepts or retests.
How do I measure a volatility burst?
One simple way is to look at the present short-term range compared to the average range of the recent bars. If the ratio is higher than normal, this suggests an abnormal expansion, but the direction and acceptance should also be considered.
Should I enter on the first large candle?
No, of course not. The first enormous candle is a sign of a shift in behavior, but entering after it often leads to a poor reward-to-risk if a lot of the move has already happened. Look for continuation quality and remaining opportunity.
How can I avoid fake volatility breakouts?
Concentrate on acceptance. A true breakout has a better chance of remaining above or below the prior range. A false move usually reverses back into the structure fairly quickly. Measuring the pullback against the initial burst can also help enhance decision making.
Which timeframe is best for volatility burst scalping?
The execution timeframe depends on the strategy and market. Short charts such as 5-second or 15-second charts can provide precise entries, but they should usually be viewed within a broader structural context.
Can ATR be used for volatility burst entries?
Yes, but ATR should be utilized as a baseline and not as a single signal. Looking at the present movement vs regular prior volatility can assist spot Expansion, but it is still the price structure that decides if the movement is tradeable.
How should I set Risk during high volatility?
First define the invalidation point based on market structure. Then determine the position size based on the real stop distance. This stops the quick market from generating uneven account risk.
Final Thoughts
The finest scalping entries are not usually where the market is moving the most.
They are generally located at the point where the character of the volatility changes.
The compressed market starts to expand. Price shows it can hold outside the preceding structure. The pullback is kept in check. There is Opportunity enough to justify the Risk.
That sequence gives you something much more useful than a signal.
It gives you a reasoned decision.
For your next trading session, do not try to capture every volatility burst. Track only one thing: how often your best trades entered near the beginning of Expansion versus how often you entered after the move was already mature.
That single review may reveal more about your scalping performance than any other indicator ever will.
For your next read on DayTradersDiary.com, study How To Filter Noise On 5-Second Charts. It pairs naturally with this framework because better volatility timing starts with knowing which short-term movement deserves your attention in the first place.