
Most traders are taught to look backward before they act.
Check the last 20 candles. Confirm the previous swing. Wait for the moving average. Calculate the last 14 periods of ATR. Compare the current price with a historical range.
There is nothing inherently wrong with that approach.
The problem arises when the trader begins to believe that more historical information automatically yields a better decision.
On very short timeframes, too much lookback can become its own form of lag.
You see this most clearly when the price is moving fast. By the time a traditional indicator confirms what happened over the previous 14, 20, or 50 periods, the immediate trading opportunity may have already changed.
The trader is still measuring history while the market is pricing the next few seconds.
A near-zero lookback strategy is an attempt to solve that problem.
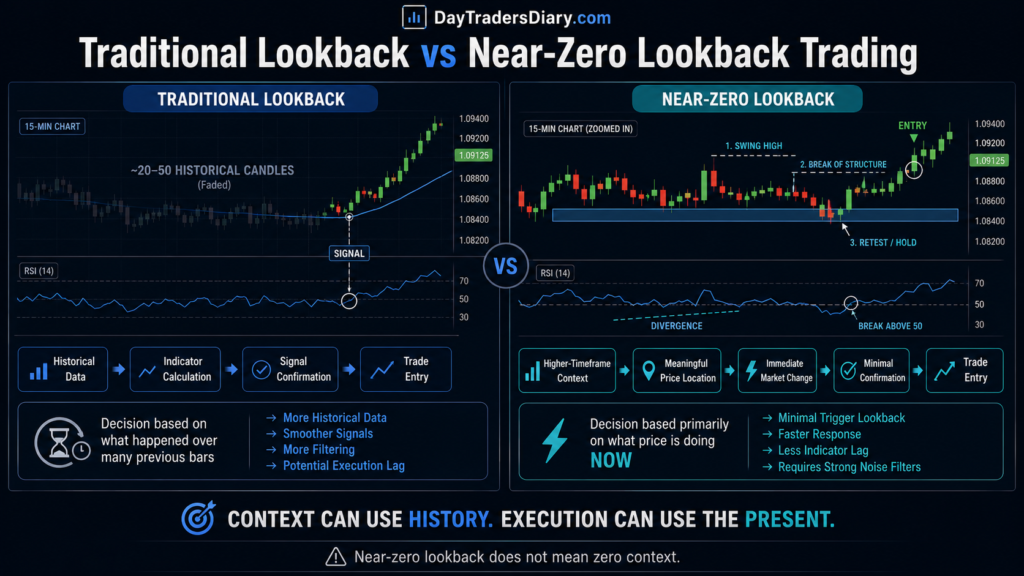
It does not literally mean trading with zero historical information. That would be reckless and practically impossible. Every market decision exists within some context.
Instead, a near-zero lookback reduces the amount of historical data required for the actual entry decision.
The broader chart still provides context. Risk still depends on volatility. Major support and resistance still matter.
But the trigger itself is based primarily on the price’s current action.
That distinction is the foundation of this strategy.
A near-zero lookback approach asks a different question from most technical systems.
Instead of asking:
What has pricing done for the previous 20 bars?
It asks: What happens when you mix a little bit of everything?
“What has changed in the immediate auction and is that change strong enough to trade?
In this post, we provide a usable framework to answer that question, without falling into the trap of thinking each and every fast candle contains valuable information.
First, Clear Up the Confusion Around “Lookback”
The phrase lookback option pricing formula refers to something very different from a short-term trading strategy.
A lookback option is an exotic derivative whose payoff depends on the highest or lowest price reached by the underlying asset during a specified period. Pricing these instruments involves path-dependent mathematics, unlike a simple indicator lookback period.
In a trading strategy, however, a lookback period usually means the number of previous bars, observations, or data points used to calculate a signal.
For example, a 14-period RSI has a defined historical lookback. A 20-period moving average also depends on prior observations. A breakout system based on the highest high of the previous 50 bars uses a much longer lookback.
A near-zero lookback strategy is not an options-pricing method.
It is an execution philosophy.
The goal is to reduce the distance between current market information and your trading decision.
That can be especially useful for scalpers, very active intraday traders, and traders working with one-minute, five-second, or tick-based charts.
The risk is evident.
If you make lookback too short, you may confuse random movement for a major change.
The issue, then, is to reduce history, not only.
The problem is distinguishing between instant information and immediate noise.
Why Traditional Lookbacks Can Create Execution Lag
Every indicator that uses historical data makes a trade-off.
More observations can smooth random fluctuations.
But additional observations can also slow the signal.
A short lookback responds quickly but can be unstable. A longer lookback is smoother, but may respond after the important move has already started.
For an active day trader, this creates a practical problem.
Suppose EUR/USD begins to compress below intraday resistance. The market starts producing higher lows. Selling pressure weakens. Then, the price breaks the immediate microstructure.
A 50-period moving average may tell you almost nothing useful about that moment.
The important information is in the sequence happening directly in front of you.
The market is not waiting for your indicator to catch up.
This is where a near-zero lookback strategy can provide an advantage.
But the advantage does not come from ignoring history.
It comes from separating context data from trigger data.
Your context may come from the previous hour.
Your actual trigger may come from the last three to five price events.
Those are different jobs.
What Market Microstructure Research Means for Short-Term Traders
Research into market microstructure has consistently shown that short-term price formation is closely connected to liquidity, order flow, transaction activity, and the way buyers and sellers interact.
The practical lesson for traders is that the price didn’t move just because an indicator changed color. Pricing drives indicators. The most relevant issue is what quick market action caused that price shift.
The Bank for International Settlements research on foreign exchange markets provides useful background on the decentralized and evolving structure of the global FX market. This matters because spot Forex traders should be cautious about assuming that any single visible data feed represents the entire market.
Research from the National Bureau of Economic Research and other market microstructure academics find that liquidity and trading activity matter for short-term price behavior. Aggressive traders don’t accept a fast move as directional confirmation. Sometimes it means temporary liquidity problems.
Market education from CME Group is also useful for understanding how liquidity, volatility, and participation affect execution and price behavior.
The important takeaway is simple.
A near-zero lookback signal needs a quality filter.
Information is not speed.
A rapid candle is not always momentum.
A breakout doesn’t necessarily mean acceptance.
A quick move may be the result of real participation, low liquidity, stop execution or a transient imbalance.
Your strategy must distinguish between them.
The Core Idea: Context Can Have Lookback, Entry Should Have Minimal Lookback
This is the most practical framework.
Use historical information to decide where you are willing to trade.
Use immediate information to decide when you actually trade.
For example, your 15-minute chart may show that GBP/USD is approaching an important intraday support zone.
That is context.
You do not immediately buy.
You go to your execution chart and wait.
Price temporarily dips below the zone, but rapidly recaptures the local range. The next modest downturn also fails to make a new bottom.
It’s that immediate sequence that turns it on.
Your higher timeframe may use several hours of information.
Your entry may depend on only the most recent handful of price events.
This is the essence of a near-zero lookback strategy.
The historical chart identifies opportunity.
The immediate market behavior determines execution.
The Four-Part Near-Zero Lookback Framework
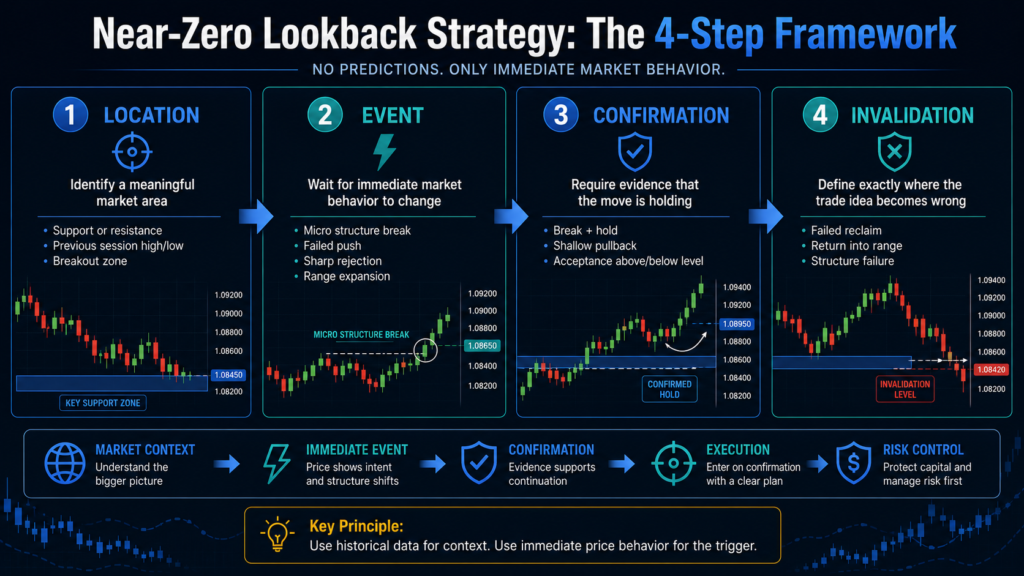
A practical near-zero lookback strategy can be built around four components: location, event, confirmation, and invalidation.
Location: Do Not Trade Immediate Price Information Everywhere
The first mistake traders make is attempting to trade every immediate movement.
Near-zero lookback does not mean context-free trading.
You still need a reason to care about the current price.
That explanation can be a major intraday support or resistance zone, a previous session high or low, a breakout level, a volatility boundary or a level where the larger structure implies a likely reaction.
This is where How To Find Micro Support & Resistance Levels becomes highly relevant.
The broader level tells you where to pay attention.
The microstructure tells you whether the market is actually beginning to respond.
Without location, immediate price behavior is often just noise.
Event: Something Must Actually Change
Once the price reaches your area, wait for an observable event to occur.
A useful event might be an immediate structure break.
It could be a failed push through a level.
It could be a sharp rejection followed by a reclaim.
It could be a sudden expansion in range after a period of compression.
The important point is that your strategy needs an event that can be objectively identified.
For example, imagine the price has been making lower lows during a pullback.
It reaches a larger support area.
Then the market fails to produce another lower low and breaks above the most recent immediate lower high.
That is an event.
You are not buying because support exists.
You are buying because the immediate behavior changed at support.
Confirmation: Reduce the Chance of Trading the First False Signal
The biggest weakness of near-zero lookback strategies is their tendency to overreact to the first movement.
A single candle can lie.
One useful solution is a confirmation sequence with minimal delay.
For example, you might require an immediate structure break followed by a hold.
Or a breakout followed by a very shallow pullback that does not return inside the previous range.
This only adds a small amount of lookback, but it can dramatically improve signal quality.
You are not waiting for a 20-bar pattern.
You are simply asking the market to prove that the first movement was not completely temporary.
This is closely related to the logic behind A Method For Identifying Fake Breakout With Volume Filter.
A breakout is an event.
Acceptance is evidence.
The difference between those two concepts can prevent many poor trades.
Invalidation: Know Exactly What Makes the Signal Wrong
Near-zero lookback methods can produce tight entry.
That’s not to say every trade merits a small pause.
The stop should be at the point where the current idea is refuted.
Suppose you buy after the price reclaims a micro range.
If the price immediately falls back through the reclaimed range and accepts below it, your premise may be wrong.
That is different from placing a stop at an arbitrary two-pip distance simply because you are trading a fast chart.
The market does not know that you prefer a small stop.
Your risk must fit the structure.
A Simple Near-Zero Lookback Long Strategy
Consider a trader seeking a continuation entry within an established intraday uptrend.
The 15-minute chart shows higher highs and higher lows.
Price pulls back toward a previous breakout area.
The trader does not use the one-minute chart to predict the exact bottom.
Instead, the trader waits for three immediate events.
First, the downside push loses its ability to make meaningful progress.
Second, price breaks above the most recent micro lower high.
Third, the first pullback after the break remains above the newly reclaimed micro level.
The trade is entered only after those conditions are present.
Notice what is happening here.
The strategy does not use a large historical calculation for the trigger.
The trigger is based on immediate structure.
But the trade still has context.
That combination is what makes the method more robust than unquestioningly trading every one-minute reversal.
The Near-Zero Lookback Compression Setup
One of the most useful applications of this approach is compression.
Imagine price repeatedly tests resistance.
The pullbacks become smaller.
The market spends less time away from the level.
Eventually, the range becomes very tight.
Traditional indicators may show mixed signals because they are averaging older price behavior.
The near-zero lookback trader focuses on what is happening now.
Is the price holding near resistance?
Are pullbacks becoming shallower?
Is the immediate range contracting?
Does price break the final micro high with follow-through?
If the answer is yes, the trader watches for acceptance rather than simply selling resistance.
This is particularly useful because repeated tests do not always strengthen a level.
Sometimes they weaken it.
The important information is the changing behavior around the level.
When Near-Zero Lookback Works Best
This approach works best when the market is already giving you a meaningful location and then produces a clear, immediate change.
Trending sessions can be particularly useful because the broader directional context reduces the number of possible interpretations.
For example, a strong uptrend followed by a controlled pullback may create several opportunities for a near-zero lookback continuation trigger.
A chaotic range can be more difficult.
Within a range, immediate structural changes frequently occur.
A bullish micro break may reverse minutes later.
A bearish rejection may become a breakout.
This does not mean the strategy cannot work in ranges.
It means the quality filter needs to be stricter.
The best question is not:
“Did I get a signal?”
It is:
“Is this immediate signal occurring at a location where the market has a reason to respond?”
When the Strategy Fails
Every low-lag method has a predictable weakness.
It reacts quickly.
That means it can also react quickly to meaningless movement.
Near-zero lookback strategies are vulnerable during sudden volatility expansion, thin liquidity, major news events, and choppy transitions between market regimes.
This is why How To Quantify News Volatility Before Entry should be part of the broader process.
A clean microstructure before a major economic release may become irrelevant once volatility changes.
You also need to be aware of the entry delay.
A trader can destroy the benefit of a near-zero lookback strategy by waiting too long.
Suppose the strategy triggers on an immediate break of the structure at 1.2500.
The trader hesitates.
Price moves to 1.2508 before entry.
The original stop remains at 1.2490.
The risk increased from 10 pips to 18 pips, while the available reward decreased.
The signal may still be technically valid, but the trade quality has changed.
Fast strategies require fast decisions, but that does not mean impulsive decisions.
The solution is predefined logic.
Building a Decision Tree Instead of a Signal
A common mistake is to search for a single indicator setting that produces a buy or sell signal.
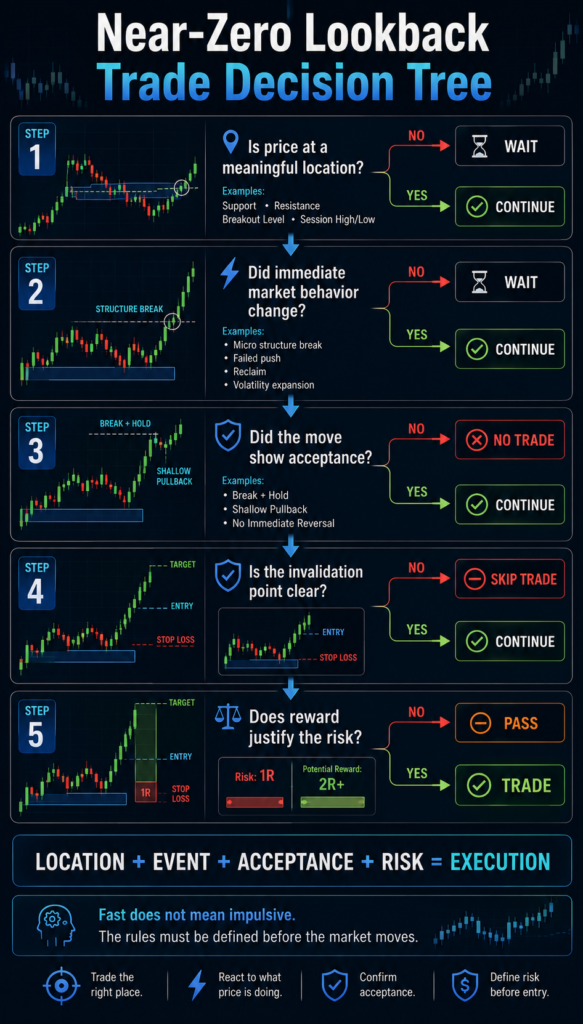
A better approach is to build a decision tree.
The first question is whether the pricing is at a meaningful level.
The second question is did behavior alter immediately.
The third is if the change lasted long enough to be an indicator of acceptability.
The fourth question is whether the trade still offers an acceptable reward relative to the required stop.
The fifth question is whether current volatility allows the setup to function normally.
Only after these questions are answered should the order be placed.
This structure keeps the strategy fast without making it careless.
Position Sizing Matters More With Fast Entries
Small chart moves typically seem to imply small risk in near zero lookback tactics.
That is not always true.
A fast entry may require a wider structural stop than expected.
Or volatility may force you to allow more room.
This is where traders often make the mistake of keeping the same position size while changing the stop distance.
That silently changes the amount of money at risk.
Using the Position Size Calculator helps remove that guesswork. First, define the structural invalidation point, measure the actual stop distance, and then calculate the appropriate position size.
The order should follow the risk plan.
The risk plan should not be distorted to force a preferred lot size.
This is especially important when the strategy generates frequent opportunities. A small sizing error repeated 20 times can be more damaging than a single poor trade.
The Psychology of Near-Zero Lookback Trading
The psychological challenge is interesting because the method demands two apparently opposite qualities.
You must be patient before the event.
Then, it was decisive after the event.
Many traders reverse those behaviors.
They enter too early because they fear missing the move.
Then they hesitate when the actual confirmation arrives.
A near-zero lookback strategy only works if the trader has already decided what qualifies as an event.
You cannot invent the rules while the price is moving.
That is where impulsive trading begins.
The psychological discipline is to accept that some moves will happen without you.
You are not trying to capture every breakout.
You are waiting for the type of immediate behavior that your data shows has an edge.
How to Measure Whether Your Strategy Actually Has an Edge
Do not judge this method after five trades.
Fast strategies produce a large amount of data, which is an advantage if you record it correctly.
Use the Trade Journal Template to track more than entry and exit.
Record the market location.
Record the immediate event that triggered the trade.
Record whether confirmation was present.
Record the number of seconds or candles between the event and your entry.
Record planned price and actual fill.
Record whether the setup occurred during trend, range, or transition.
Also, record volatility conditions.
After a meaningful sample, compare the results.
You may discover that your strategy performs well after compression but poorly after sharp volatility spikes.
Immediate reclaims work better than first breakouts.
You may discover that your best trades occur when the confirmation pullback is shallow.
These observations are where the real strategy begins.
The initial framework gives you a hypothesis.
The journal lets you know if that hypothesis holds up against real market conditions.
A Useful Performance Metric: Signal-to-Entry Delay
For a near-zero lookback strategy, measure how much time or price movement occurs between the signal and your actual entry.
A simple calculation is:
Entry Delay Ratio = Price Distance From Signal ÷ Initial Planned Risk
Suppose your signal occurs at 1.2000.
Your planned stop is 1.1990.
Your planned risk is 10 pips.
You hesitate and enter at 1.2004.
Your price delay is 4 pips.
Your Entry Delay Ratio is:
4 ÷ 10 = 0.40
You entered after the price had already consumed 40 percent of your original planned risk.
That may be too much for some strategies.
Over time, you can determine your own threshold.
Trades entered within 20 percent of planned risk perform well, while trades entered after 50 percent consistently underperform.
That is the kind of information most traders never measure.
Yet it can be more valuable than changing an indicator setting.
Scaling a Near-Zero Lookback Edge
Once a trader develops a repeatable short-term process, capital becomes a separate issue.
A good strategy on a small personal account can produce limited absolute returns even when the percentage performance is respectable.
This is why some serious traders explore evaluation accounts.
The idea is not to use more capital to compensate for a weak strategy.
It is the opposite.
You first prove that the strategy can survive a meaningful sample while respecting drawdown limits and execution rules.
Then you consider scaling the process.
The The5ers offers evaluation and funded trading pathways that may appeal to traders who already have a structured approach and want to operate within defined risk parameters.
Instead of thinking that one firm is automatically ideal for every strategy it is worth making some comparisons between the models offered. FTMO and Trade The Pool operate diverse structures, markets and rule sets that may cater to different trading styles.
For a near-zero lookback strategy, this comparison is particularly important.
A trader who needs rapid execution and frequent opportunities should study how trading rules, drawdown calculations, position limits, and platform conditions interact with the actual strategy.
The most number advertized isn’t generally the best evaluation account.
The one whose rules allow your tested process to run without imposing unwanted adjustments.
If you have consistent execution and measurable edge already, then ask yourself if a The5ers evaluation account fits your plan. Use the assessment as a professional risk framework, not as a shortcut to profit.
Can You Build a Near-Zero Lookback Strategy With Indicators?
Yes, but the indicator should support the immediate decision rather than dominate it.
For example, you might use a longer-period indicator only as a context filter while allowing raw price behavior to generate the entry.
You could also use a very short calculation to identify immediate expansion or contraction.
But there is a danger.
When traders hear “near-zero lookback,” they often search for a one-period indicator.
That misses the point.
A one-period indicator is often simply the current price expressed in another visual format.
The edge does not come from having the shortest possible calculation.
The edge comes from deciding which immediate changes are meaningful.
Raw price structure can do this job better.
A Complete Daily Routine
Before the trading session, identify the larger market structure and the locations where a trade would make sense.
Do not watch every tick with the same level of attention.
When the price approaches a relevant area, switch into execution mode.
Wait for an objective, immediate event.
Do not enter because you expect the event.
After the event, require the minimum confirmation that your testing supports.
Define the invalidation point.
Calculate the correct position size.
Execute without unnecessary delay.
After the trade, record whether the signal, confirmation, and execution matched your rules.
At the end of the session, review the trades as a group.
The purpose is not to find out whether you made money today.
The purpose is to determine whether you followed a process that warrants more capital tomorrow.
Frequently Asked Questions
What is a near-zero lookback strategy?
A near-zero lookback strategy uses very little historical data to trigger the actual trade. The entry decision is based mainly on immediate price behavior, while higher-timeframe information provides market context.
Does near-zero lookback mean trading without historical data?
No. Historical information can still be used for context, support and resistance, trend direction and volatility. The ‘near-zero’ idea is particularly applicable to the execution trigger.
What is the best timeframe for a near-zero lookback strategy?
The best timeframe depends on the trader’s holding period. Scalpers may use tick, five-second, or one-minute charts for execution, while day traders may use one-minute or five-minute charts.
Are near-zero lookback strategies good for Forex?
They can be useful for Forex traders who need precise entries, particularly around established intraday levels. Execution quality, spread, slippage, and changing volatility need to be included in testing.
How is a near-zero lookback strategy different from a lookback option?
They are unrelated concepts. A lookback option is a path-dependent financial derivative whose payoff depends on the highest or lowest price reached during its life. A near-zero lookback trading strategy refers to minimizing historical data used for an entry trigger.
How do I avoid false signals with a near-zero lookback strategy?
Sort by verification and place. Don’t trade every move as it happens. Wait for the signal to trigger and hold the first move in a big market sector.
Can I use a near-zero lookback strategy for prop firm evaluations?
The technique should be evaluated against actual spreads, slippage and drawdown limits. If you overtrade, execution faults get magnified, thus you want the evaluation standards to meet the strategy.
Final Thoughts
A near-zero lookback strategy is not about becoming faster for its own sake.
It is about reducing unnecessary delay between meaningful market information and execution.
The market context can come from the last hour.
Your setup can come from the last few minutes.
Your trigger can come from the last few seconds.
Each layer has a different job.
The mistake is forcing a single indicator or lookback period to do all three.
For your next 20 trades, try one specific experiment.
Keep your normal higher-timeframe analysis.
But before each entry, write down the exact immediate event that caused you to act.
If you cannot describe that event clearly, do not enter.
Then review whether those clearly defined immediate events produced better results than trades taken from anticipation.
That exercise can reveal whether your current strategy is genuinely responsive to the market or simply reacting to historical calculations that arrive too late.
Next read: How To Filter Noise On 5-Second Charts. Once you reduce the lookback used for execution, the next challenge is learning which immediate movements contain useful information and which are simply noise.