
A trader can have the higher-timeframe bias completely right and still lose money because of one badly timed entry.
You may correctly identify that EUR/USD is bullish. The hourly chart is making higher highs. The 15-minute chart has broken resistance. Everything points upward.
Then you buy.
Price immediately drops 8 pips, sweeps below your entry, hits your stop, and then rallies exactly as you expected.
The problem was not your market direction.
The problem was that you entered without understanding the microstructure directly around Price.
This is where micro support and resistance become useful.
Most traders learn to draw major support and resistance levels first. They mark yesterday’s high, the Asian range, a four-hour swing low, or a major daily level. Those levels matter. But active day traders often make or lose money in the space between those larger levels.
Price creates smaller regions of transient acceptance, rejection, liquidity and order imbalance in that space. These are the minor support and resistance levels that can either make your entry efficient or premature.
The important point is that micro levels are not simply tiny horizontal lines drawn on a lower timeframe. That approach creates a chart covered in meaningless levels.
A useful micro support resistance Forex strategy requires context.
You need to know which small levels deserve attention, why the Price reacted there, how long the level remains relevant, and when a micro level should be ignored because the larger market structure has changed.
This guide is built around that distinction.
What Is Micro Support and Resistance?
Micro support and resistance refer to short-term price levels that influence immediate order flow but are not necessarily important on higher timeframes.
To a Forex day trader these levels might be a little consolidation before impetuous move, the low of a short term pull back, a region of recurrent rejection, the beginning of a breakout or a short balance zone where Price traded before determining direction.
The word “micro” describes the level of analysis, not simply the timeframe.
A level on a one-minute chart is not automatically a micro level. Likewise, a level identified on a five-minute chart can still be micro relative to the one-hour structure.
Think in layers.
The higher timeframe provides the broad environment. The intermediate timeframe defines the active intraday structure. The lower timeframe reveals where execution is likely to become efficient or inefficient.
A possible working hierarchy is:
If the market is trending, ranging or transitioning the one hour chart will inform you.
The active intraday swing structure is on the 15-minute chart.
The one minute or five minute chart helps pinpoint the micro support or resistance level where a transaction can actually be performed.
This distinction matters because many traders confuse location with entry.
A major support zone may tell you where buying could become interesting. A micro support level can tell you when buyers are actually beginning to defend that area.
That is a much more useful use of support and resistance.
Why Micro Levels Matter More Than Most Traders Realize
Short-term price movement is noisy because markets are constantly processing orders at different sizes and time horizons.
The Bank for International Settlements has extensively documented the fragmented and decentralized nature of the foreign exchange market, in which liquidity and trading activity are distributed among participants and venues. For a day trader, the practical implication is simple: the price movement you see on a chart is the visible result of constantly changing liquidity and order flow, not a perfectly clean sequence of technical patterns. Bank for International Settlements FX research
That helps explain why Price can respect a small intraday level several times before suddenly trading straight through it.
The level itself did not “fail” in some mystical sense. The balance of participation changed.
Research and market education from CME Group also emphasize the importance of liquidity, volatility, and market structure in understanding how futures and related markets behave. The lesson transfers well to active Forex trading: the same price pattern can behave very differently depending on participation and volatility.
Academic research on market microstructure has also shown that short-term price formation is closely linked to trading activity, liquidity, and order interactions. The practical takeaway for traders is that a micro support or resistance level should be evaluated as an area where behavior occurred, not merely as a price line. National Bureau of Economic Research market microstructure research
That changes the question you ask.
Instead of asking:
“Where is support?”
Ask:
“What happened here that could cause traders to respond again?”
That is a much better starting point.
The Biggest Mistake When Drawing Micro Support and Resistance
The most common mistake is marking every visible swing.
If you zoom into a one-minute chart and draw a horizontal line at every small high and low, you will eventually create so many levels that every possible trade appears to have support and resistance nearby.
That does not improve analysis.
It removes decision-making.
A micro level should earn its place on your chart.
I generally look for evidence of at least one of three things.
First, the level produced displacement. Price did not simply touch the area and drift away. It moved with enough momentum to show that the area mattered.
Second, the level was retested or defended. One reaction can be random. Repeated behavior gives you more information, although too many tests can also weaken a level.
Third, the level connects logically to the larger market structure.
This third point is where many lower-timeframe strategies fail.
A perfectly clean one-minute support level may not be worth buying if the 15-minute chart has just broken down and the Price is accelerating toward lower liquidity.
Micro levels work best when used as execution tools within a larger structural idea.
A Better Way to Find Micro Support and Resistance
The process starts with context and ends with precision.
Step One: Define the Active Market Structure
Before searching for micro support or resistance, determine what the Price is currently doing.
You do not need to predict the next 100 pips.
You only need to understand the active environment.
Ask whether the market is trending, balancing, breaking out, or transitioning.
In an uptrend, the most valuable micro support levels are typically formed during controlled pullbacks or brief consolidations before a continuation.
Micro resistance in a downtrend is particularly relevant during short term rallies and futile attempts to restore shattered structure.
In a range, both sides can matter, but you should be more selective because lower-timeframe levels inside the middle of a range often generate noise.
This connects directly to the logic behind “How To Classify Trend Strength With ADX Clusters.” The micro level is more useful you understanding whether you are trading in a strong directional environment or a weak, rotational one.
A level does not have the same probability in both conditions.
Step Two: Look for Displacement, Not Just a Touch
Suppose GBP/USD trades sideways between two nearby prices for several minutes.
Then buyers enter, and the Price moves sharply higher.
The lower boundary of that short consolidation may become a micro support on a later pullback.
Why?
Because the level is associated with a visible behavior change.
Now compare that with a random candle low that produced no meaningful reaction.
Both can be drawn as horizontal lines.
Only one has a clear structural story.
This is why I prefer to identify the origin of movement rather than every individual wick.
When you find a micro level, ask:
Did Price leave this area in a hurry?
Did the move break another short-term level?
Did the move change the immediate structure?
Did the market later acknowledge the area again?
The more clearly the level connects to subsequent price behavior, the more useful it becomes.
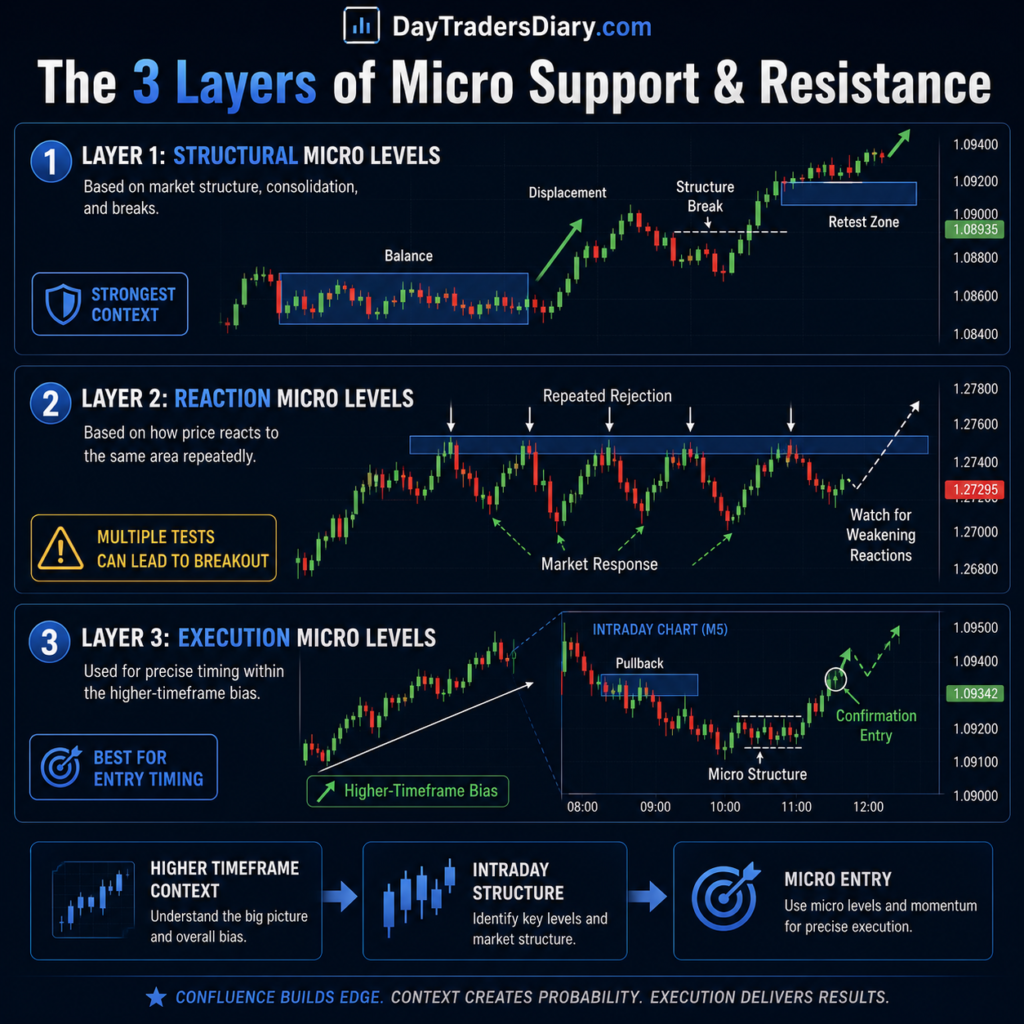
The Three-Layer Micro Support Resistance Framework
A simple way to filter micro levels is to classify them into three layers.
Layer One: Structural Micro Levels
These are the strongest.
They usually form immediately before a meaningful short-term breakout, reversal, or acceleration.
Imagine EUR/USD trading below 1.1000 before building a small base between 1.0994 and 1.0996. Buyers then push through 1.1000 and the price rallies.
If the market later pulls back, the 1.0994-1.0996 area may act as structural micro support.
The key is not the exact number.
The key is the sequence:
Balance.
Displacement.
Structure break.
Potential retest.
This type of level is usually more useful than a random candle high.
Layer Two: Reaction Micro Levels
These are levels where Price has repeatedly rejected or hesitated.
For example, the Price may test 1.1050 three times, rejecting it each time.
This tells you that the area has been important to short-term participants.
However, repeated tests should not automatically make you more confident.
This is a subtle but important point.
A level that has been tested several times may contain less remaining liquidity than a fresh level. Eventually, repeated pressure can lead to a breakout.
So instead of saying:
“Three touches mean strong resistance.”
Ask:
“What is happening on each touch?”
If each rejection weakens and the pullbacks grow shallower, buyers may be absorbing the available selling interest.
In that situation, the fourth touch may be the breakout.
Layer Three: Execution Micro Levels
These are the smallest levels and should primarily be used for timing.
Suppose the 15-minute chart is bullish and the Price is pulling back toward a broader support area.
On the one-minute chart, you notice a small consolidation followed by a break upward.
The high or low of that structure may help define your entry and stop placement.
These levels are useful because they allow you to reduce entry uncertainty.
But they should not become the reason for the entire trade.
The higher-level context should come first.
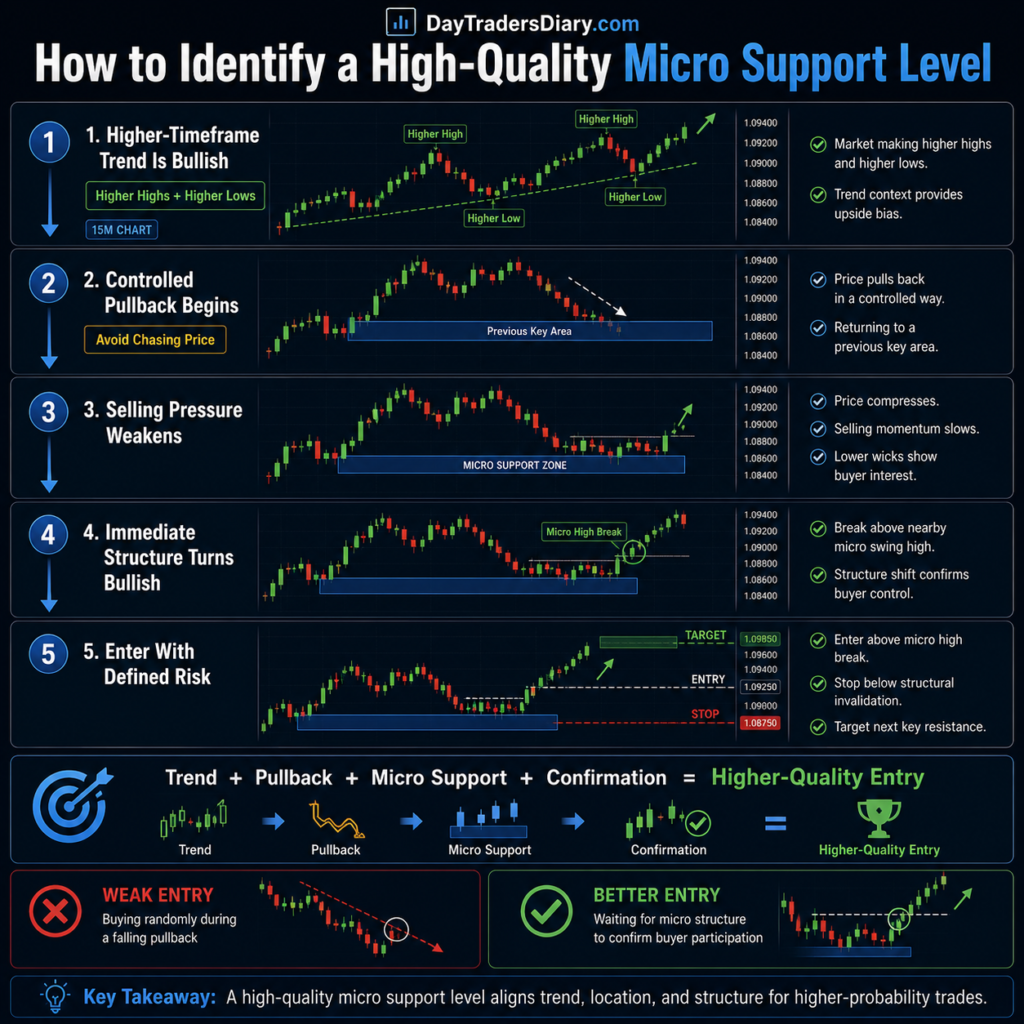
How to Identify Micro Support in an Uptrend
The cleanest micro support often forms after a pullback fails to develop into a larger reversal.
Imagine this sequence.
Price makes a strong push upward.
It pulls back.
Selling slows near a previous micro consolidation.
The market forms a small base.
Price breaks above the immediate micro high.
That sequence provides more information than simply buying when the Price reaches a Fibonacci percentage or touches a moving average.
The trader is looking for signs that the pullback is over.
A practical series of confirmations is:
The larger intraday structure is still bullish.
The pullback is losing downside steam.
Price hits a relevant micro support area.
A lower-timeframe structure begins to turn upward.
The entry is taken only after the market demonstrates that buyers are responding.
This is similar to the confirmation logic discussed in How To Trade Retrace With Three Confirmation Steps. The best micro levels do not force you to predict the exact bottom. They allow you to wait for evidence that the market is beginning to behave differently.
That distinction can dramatically improve execution.
How to Identify Micro Resistance in a Downtrend
The same logic applies in reverse.
Suppose USD/JPY is making lower highs and lower lows.
Price rallies from the latest swing low.
Look for where the selling started before, rather than shorting the rally as soon as it happens.
Look for a modest balance region, failed breakout or short term support that failed before the last move down.
If price comes back to that area and lower timeframe starts to reject it, you can have a more exact short entry.
The important thing is to avoid treating every previous high as resistance.
The most useful micro resistance levels usually have a connection to displacement.
Price should have demonstrated that the area mattered.
The Difference Between a Micro Level and Market Noise
This is one of the hardest skills to develop.
A useful micro level has consequences.
Noise does not.
A useful level may produce a rejection, trigger a structure break, create a measurable shift in momentum, or act as the launch point for an impulsive move.
Noise exists on the chart.
A good filter is the consequence test.
Ask yourself:
“If I removed this level from my chart, would I lose any meaningful explanation of the current market structure?”
If the answer is no, the level is probably not important.
This single question can clean up a chart remarkably quickly.
The Freshness Principle
Not all micro support and resistance levels have the same life span.
A major daily level may remain relevant for days or weeks.
A one-minute micro level may only matter for 20 minutes.
Many traders make the mistake of keeping old intraday levels on the chart long after the order flow that created them has disappeared.
Micro levels decay.
Their relevance can decrease over time due to repeated testing or a major change in volatility.
A practical approach is to classify them as fresh, tested, or invalidated.
A fresh level has not yet been meaningfully revisited.
A tested level has already produced a reaction.
An invalidated level has been broken with sufficient acceptance or is no longer relevant to the current market structure.
This prevents your chart from becoming a historical archive.
Your chart should help you make the next decision, not document every decision the market has ever made.
Why Micro Levels Work Better With Session Context
A micro level created during one trading session does not always behave the same way during another.
A quiet level formed during low participation may be far less important once a major trading session opens and liquidity increases.
This is where session analysis becomes valuable.
If you trade major Forex pairs, compare how your micro setups behave during the Asian, London, and New York sessions.
You may discover that a strategy which works well during the London continuation becomes unreliable during the quieter parts of the Asian session.
This is why a session heatmap for entry timing can be more useful than simply asking whether a setup won or lost.
You want to know when the setup performs best.
For example, your journal may eventually reveal that:
Micro support continuation trades perform well during the first two hours of London.
The same setup produces more false breaks during late New York.
Countertrend micro reversals only work consistently when the Price is reaching a major higher-timeframe level.
That type of information is far more valuable than an overall win rate.
A Practical Micro Support Resistance Forex Strategy
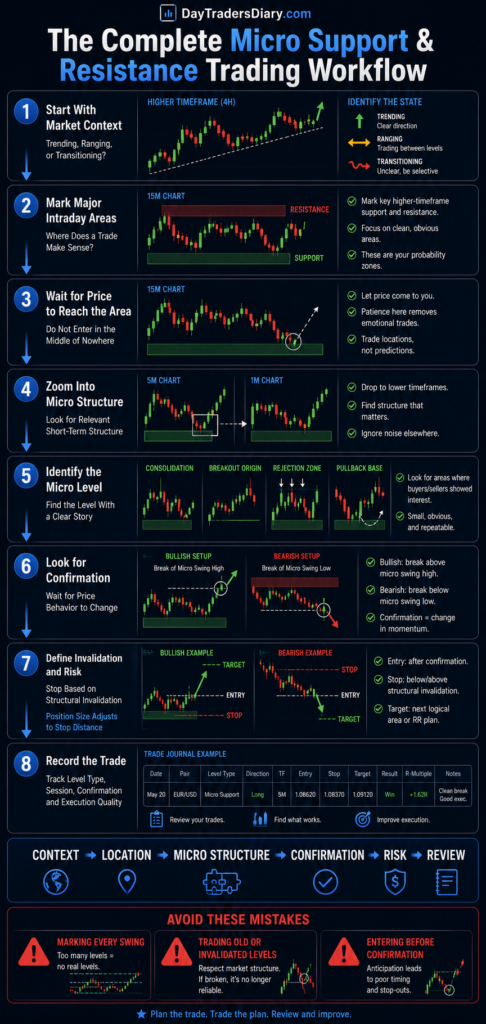
Here is a complete decision process that can be adapted to your own trading style.
Start with the 15-minute chart.
Determine whether the Price is trending, ranging, or transitioning.
Mark only the major intraday levels that genuinely affect your directional bias.
Move to the five-minute chart.
Identify the most recent displacement leg and the small consolidation or pullback structure associated with it.
Then move to the one-minute chart only when the Price reaches an area where you are willing to trade.
At that point, look for confirmation.
In a bullish setup, you should see the pullback stop making lower lows, followed by a break above a nearby micro high.
In a bearish setup, you should see the rally stop making higher highs, followed by a break below a nearby micro low.
This saves you from the most expensive habit in active trading: entering because you expect confirmation, instead of waiting for it.
Example: Micro Support Entry
Assume EUR/USD is trending upward on the 15-minute chart.
Price rallies 30 pips and then pulls back toward a previous breakout area.
On the five-minute chart, the pullback slows.
On the one-minute chart, Price forms a small base between 1.0848 and 1.0851.
A strong bullish candle breaks above the micro range.
Instead of buying randomly during the pullback, the trader now has a defined structure in place.
The entry may occur above the micro range.
The stop can be placed below the structural invalidation point.
The target can be based on the next intraday resistance, expected range, or a volatility framework.
This is not about finding the exact lowest Price.
It is about improving the relationship between information and risk.
A slightly later entry with better confirmation can sometimes be superior to an early entry with a wider and less logical stop.
That said, confirmation also has a cost. If you wait too long, your reward-to-risk ratio can deteriorate. The balance between confirmation and entry delay is something every active trader should measure.
Micro Support and Resistance Indicators: Helpful or Harmful?
A support and resistance indicator can be useful, but it should not replace judgment.
Automated tools typically identify pivots, swing highs, swing lows, volume nodes, or repeated price reactions.
The problem is that an indicator cannot always understand context.
A pivot algorithm may identify a technically valid swing that is irrelevant to the current market environment.
The best use of an indicator is as a discovery tool.
Let it help you spot possible levels.
Then use your own filters.
Ask whether the level caused displacement.
Ask if it fits the present market structure.
Is the market coming into the level with vigor or exhaustion?
Ask whether the level is fresh.
If the indicator and your structural analysis agree, you may have a useful area.
If you rely on the indicator alone, you are likely to end up with too many levels.
The goal is not to automate every judgment.
The goal is to reduce the number of weak judgments you have to make.
When Micro Levels Fail
Micro support and resistance fail most often when traders treat a local pattern as more important than the broader environment.
A perfect one-minute support level can fail during a major news release.
A clean resistance level can disappear when a strong trend enters an acceleration phase.
A range boundary can break because the market has spent too long testing it.
You should be especially cautious when volatility expands.
If the average one-minute range suddenly doubles, levels that previously produced 3-pip reactions may no longer be meaningful.
The same applies to scheduled economic releases.
This leads logically to How to Measure News Volatility Before Entry. Before trusting a microstructure, ask whether the current environment of volatility is normal enough to matter to that microstructure.
A level that works during ordinary conditions may become irrelevant when the market’s range expands dramatically.
The Micro Level Compression Signal
One of the more useful observations comes from watching how the Price approaches a level.
Imagine resistance at 1.0900.
If Price repeatedly rallies to 1.0900 and then falls by 10, 8, and 5 pips, the pullbacks are becoming smaller.
That is not automatically bearish or bullish.
But it is information.
Price may be compressing against resistance.
Sellers are still responding, but buyers are not allowing the Price to retrace as far.
The microstructure is changing.
This is where traders should stop treating the level as a static line and start watching the behavior around it.
A similar pattern can occur at support when bounces become progressively smaller.
The key is not to predict the breakout simply because compression exists.
Wait for confirmation.
But compression can tell you that repeatedly fading the level may no longer offer the same edge.
Combining Micro Levels With Volume
Forex traders need to be careful with volume because spot Forex does not operate through a single centralized exchange.
Tick volume can still provide useful information, but it should be interpreted carefully.
A better approach is to use volume as confirmation of behavior rather than as an isolated signal.
For example, a micro resistance break accompanied by increased activity may deserve more attention than a weak break during low participation.
But volume alone cannot tell you whether the breakout will hold.
Price must still demonstrate acceptance above or below the level.
This connects with the logic behind A Method For Identifying Fake Breakout With Volume Filter. The combination of volume, displacement, and subsequent acceptance is generally more informative than any single variable.
Stop Placement Around Micro Levels
This is where many technically correct ideas become poorly executed trades.
A trader sees micro support and places the stop one pip below the obvious low.
Price briefly sweeps the level.
The stop is hit.
Then the Price reverses.
The trader says the market “hunted” the stop.
Usually, the real problem is simpler.
The stop was placed where the trade idea could not survive normal noise.
A micro level should help you define invalidation, not simply the closest possible stop.
Ask:
At what price does my trade idea become invalid?
That’s a better question than:
How close can I make my stop?
If your long trade is based on micro support holding, a significant break and acceptance below that structure could undermine the notion.
A single wick may not.
Your stop distance should reflect both structural invalidation and normal volatility.
This is where most traders miscalculate risk. A Position Size Calculator removes much of the guesswork by allowing you to adjust position size to the actual stop distance rather than forcing every trade into the same lot size.
A smaller position with a structurally valid stop is often better than a larger position with a stop designed only to improve the appearance of your reward-to-risk ratio.
The Relationship Between Micro Levels and Slippage
Micro support and resistance strategies often involve fast entries.
That makes execution quality important.
A one or two-pip difference may not matter on a swing trade, but it can significantly affect a setup targeting a small intraday move.
This is especially important when trading breakouts.
If your planned entry is 1.1000 and your actual fill is 1.1003, your risk may increase while your available reward decreases.
The level did not change.
Your trade quality did.
This is why traders should track actual execution, particularly if they use very short-term structures.
The analysis in How to Estimate Real Slippage Cost is particularly relevant here. A strategy can look profitable in a chart review while underperforming in real trading because the actual fills consistently occur at prices worse than the assumed entry prices.
How to Journal Micro Support and Resistance Trades
If you want to improve this strategy, do not simply record whether the trade won or lost.
That will not tell you enough.
Use the Trade Journal Template to record the type of micro level involved.
Was it a fresh structural level?
A repeated reaction level?
A breakout retest?
A failed breakout?
Also, record the larger market conditions.
Was the market trending, ranging, or transitioning?
Record the session.
Record the number of times the level had already been tested.
Record whether the entry followed confirmation or anticipation.
After 30 to 50 trades, review the results.
You may discover something surprising.
Perhaps your fresh micro levels have a lower win rate but produce much larger winners.
Your repeated levels win frequently but offer poor reward-to-risk.
Your countertrend setups only work when they occur near major higher-timeframe zones.
This is how a generic strategy becomes your strategy.
The market does not need you to memorize more patterns.
It needs you to understand which of your decisions consistently produce good outcomes.
A Better Performance Metric: Micro-Level Quality
Before you enter, give a quality grade, not treat every trade identically.
You can rate the setup on structural alignment, freshness of the level, level of displacement, setup confirmation, quality of the session and circumstances of execution.
For example, a trade with higher-timeframe alignment, a fresh structural micro-level, strong displacement, and confirmation may receive a much higher quality score than a trade based on a third test at a random one-minute level.
The purpose is not to create a complicated formula.
It is to separate good losses from bad losses.
A high-quality setup can lose.
A low-quality setup can win.
If you judge every decision by the immediate result, you will eventually reinforce bad habits.
Professional improvement comes from evaluating process quality separately from outcome.
Why This Matters When You Want to Scale
A precise entry model can improve capital efficiency, but there is another limitation that traders eventually encounter.
Capital.
Suppose you have developed a strategy that performs consistently over a meaningful sample. You understand which sessions suit you. You know which micro levels work best. You have learned to avoid overtrading weak structures.
At that point, the challenge may no longer be finding another indicator.
It may be deciding how to apply the edge at a larger scale while maintaining the same discipline.
This is one reason serious traders explore evaluation accounts.
The5ers evaluation programs are developed with particular trading objectives and risk parameters in mind, offering a potential pathway for traders who already have a systematic approach and wish to gain access to a greater capital framework. The value is not that some assessment account miraculously produces skill. It can reveal vulnerabilities that a trader may disguise when trading informally, especially around drawdown control, position sizing and consistency.
It is also sensible to compare different models. FTMO and Trade The Pool represent different approaches to funded trading and evaluation structures, so the rules, markets, objectives, and risk limits should fit your actual strategy rather than your preferred marketing message.
For a trader using a micro-support-resistance Forex strategy, this comparison matters.
A strategy that requires frequent trades, tight stops, or fast scaling may fit one program differently from another. Before choosing any evaluation account, compare the rules with your actual historical trading behavior.
If your edge is real, scaling capital should be an extension of the process, not a reason to abandon it.
The Complete Micro Support and Resistance Routine
A strong routine can be surprisingly simple.
Before the session, identify the broader market structure and major intraday locations.
During the session, wait for the Price to approach an area where a trade makes sense.
Only then zoom into the lower timeframe.
Identify whether a meaningful microstructure has formed.
Look for displacement, rejection, or a shift in immediate price behavior.
When the setup needs confirmation, wait for it.
Calculate size of location, define invalidation
Record the actual entry, quality fill, level type and session.
Then, look at the results in groups, rather than analyzing each trade individually.
This process may feel slower at first.
That is usually a good sign.
Many traders do not need more opportunities.
They need fewer opportunities so that they understand better.
Frequently Asked Questions
What is micro support and resistance in Forex?
Micro support and resistance are short term price levels that influence short term market behavior. They tend to form during modest consolidations, at short-term swing points, at breakout origins and at zones of repeated rejection.
What timeframe is best for finding micro support and resistance?
The optimal time frame will depend on how long you want to hold the trade. Many day traders utilize a larger timeframe (say 15 min) for background, then employ 1 minute or 5 minute charts to find execution level microstructures.
Is a support-and-resistance indicator useful?
Useful for identifying prospective levels but should not replace structural analysis. The strongest levels tend to have clear displacement, important background & noteworthy price action.
How do you know if a micro support level is strong?
Look for a combination of displacement, structural importance, novelty, and confirmation. A level which resulted in a significant move and still makes sense in the current market structure is generally more telling than a random short term swing.
Do repeated touches strengthen support and resistance?
Not always. It is possible to check the importance of a level by repeating tests, but it can also drain the available liquidity. If the reactions slow and the pullbacks get tighter, the market could be coiling for a breakout.
Can micro support and resistance be used for scalping?
Yes, but execution quality becomes more important because small spreads, slippage, and normal price noise can have a larger impact on the result.
Should I trade every micro support or resistance level?
Nope The easiest way to do this is to make selective use of micro levels within the context of a bigger market. Levels worth trading will be determined by context.
Final Thoughts
The biggest shift in learning how to find micro support and resistance levels is realizing that the market does not care about every line you draw.
A level becomes useful when it explains behavior.
Did Price accelerate from it?
Did it change the short-term structure?
Did the market return and respond?
Does it align with the larger environment?
Those questions will improve your chart reading far more than adding another support-and-resistance indicator.
For your next trading session, try one exercise.
Mark fewer levels.
Choose only three micro levels that produced clear price consequences.
Then review what happened when the market returned to them.
Do this for several sessions and record the results. You will begin to see which types of microstructures actually matter to your trading and which ones only create visual noise.
Next read: How To Filter Noise On 5-Second Charts, where the focus shifts from identifying levels to deciding which short-term price movements deserve your attention and which ones should be ignored.