
Every day, a trader eventually notices something confusing.
Some London and New York overlaps produce clean trends that seem effortless to trade. Others, despite occurring during the same hours, become frustrating sessions filled with false breakouts, sudden reversals, and inconsistent momentum.
At first, it feels random.
Many traders assume that if two major trading sessions are open at the same time, liquidity alone should guarantee opportunity.
Experience says otherwise.
After reviewing hundreds of trading journals over the years, one pattern keeps appearing. The traders who perform consistently don’t trade every session overlap. They learn to classify the quality of the overlap before risking capital.
They understand that “high liquidity” is not the same as “high opportunity.”
This article explains a practical framework for measuring session overlap strength and why some overlaps deserve aggressive participation. In contrast, others deserve patience, and this small adjustment can improve trade selection without changing your strategy.
Why Session Overlaps Are So Important
The overlap between the London and New York sessions is widely considered the busiest period in the forex market.
Banks, hedge funds, asset managers, corporations, and retail traders are all active at the same time. More participants generally mean deeper liquidity, tighter spreads, and greater trading volume.
But increased activity does not automatically produce clean trends.
Sometimes institutions are entering new positions.
Sometimes they are simply reducing exposure before major news.
Sometimes they are waiting for fresh economic data.
The same overlap can produce completely different market behavior depending on what participants are trying to accomplish.
Understanding that distinction is the first step toward better timing.
Research Shows Liquidity Clusters Around Session Overlaps
The Bank for International Settlements (BIS) reports that the largest concentration of global foreign exchange trading occurs when major financial centers overlap, particularly London and New York.
The CME Group explains that periods of higher participation generally improve execution quality while reducing transaction costs because more buyers and sellers are active simultaneously.
The Federal Reserve Bank of New York also publishes market research demonstrating how institutional activity and macroeconomic events influence liquidity throughout the trading day.
These studies support something experienced traders already know.
Liquidity provides opportunity, but only when market participants have a reason to trade aggressively.
Stop Thinking in Binary Terms
Most traders divide session overlaps into two categories.
Good.
Bad.
That approach ignores important differences.
Instead, classify every overlap using a strength scale.
Weak.
Moderate.
Strong.
Exceptional.
The purpose isn’t to predict price direction.
The goal is to estimate how favorable the trading environment is before entering a position.
When you begin thinking in probabilities rather than absolutes, decision-making becomes much clearer.
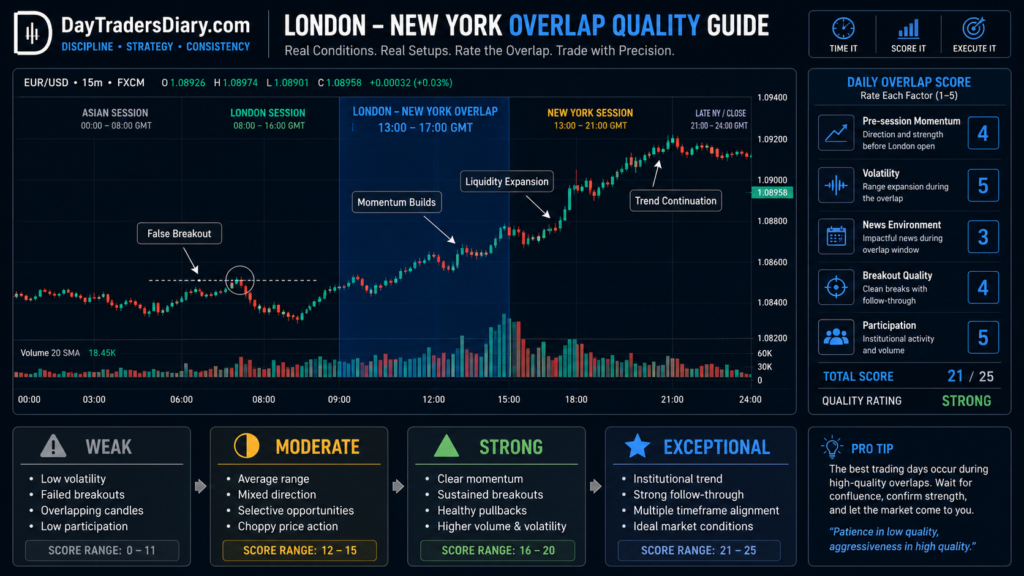
Step One: Measure Pre-Session Momentum
The strongest overlaps often begin before the overlap officially starts.
See the last hour of the London morning session.
Is the pricing already showing a definite trend?
Has volatility gone up slowly?
Who Has the Power? Buyers or Sellers?
The overlap will often carry the directional momentum that is already in the market.
By contrast, a market trapped inside a narrow range often requires an external catalyst before meaningful movement develops.
Pre-session behavior offers valuable clues about what may happen next.
Step Two: Evaluate Liquidity Expansion
You won’t see liquidity on a typical forex chart, but you will see its impacts.
Size of candle watch.
Observe how rapidly the price responds to support and resistance.
Watch to see whether the spreads stay steady.
Healthy liquidity usually leads to smoother price action and less unpredictable spiking.
Low liquidity might lead to hesitation, irregular candles and inability to hold breakouts on many occasions.
The market tells you more than any indicator.
Step Three: Check the Economic Calendar
An overlap that contains a major central bank announcement or high-impact economic release should never be classified the same way as a quiet trading day.
Scheduled events change trader behavior.
Institutions sometimes stand by.
They sometimes act aggressively.
Sometimes they lower the danger until there is no risk left.
Why market expectations frequently matter more than the headline itself. See our article How To Judge News Strength Before Release.
Always check the news before you check the set up.
Step Four: Observe Market Participation
If you do not participate in a price movement, it is rarely lasting.
Ask simple questions to yourself
Are breakouts still working?
Do pullbacks stay shallow?
Does momentum continue after important technical levels are broken?
When institutions are actively participating, continuation usually becomes more consistent.
When retail traders dominate a session, momentum often disappears quickly.
Participation leaves footprints.
Learn to recognize them.
Step Five: Compare With Average Session Behavior
Every trader develops expectations based on experience.
The problem is that memory is selective.
Instead, look at today’s overlap versus recent trading sessions.
Volatility high?
Is the average trading range already greater?
Are trend moves cleaner than normal?
This contrast takes away a lot of the emotion that builds up after a few spectacular trading days.
The market should be evaluated against data, not feelings.
Build Your Own Overlap Strength Score
Rather than relying on intuition, create a simple scoring process before every overlap.
Rate market momentum.
Watch the news in the future.
Keep an eye on the quality of the trend.
Measure follow-through on the breakout.
The overlap is worth more attention when numerous things are in place.
Given the conflicting variables, preservation of capital is the superior choice.
The purpose of scoring is not precision.
The purpose is consistency.
Consistent decision-making produces consistent performance.
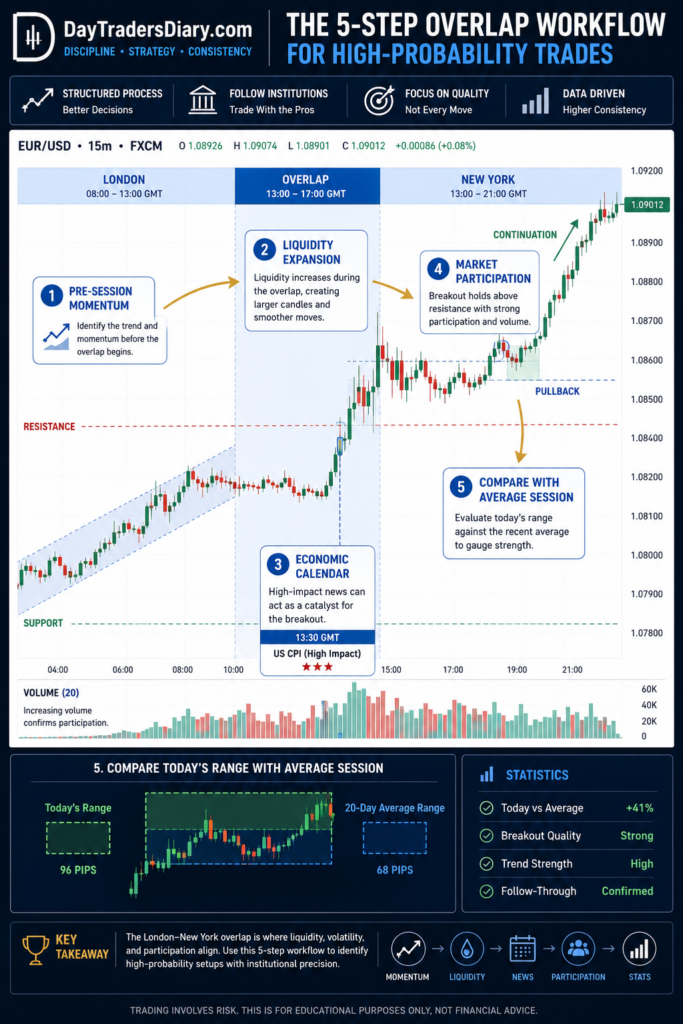
Strong Liquidity Doesn’t Always Mean Strong Trends
This is one lesson that surprises many traders.
Some of the highest-volume trading sessions produce poor directional movement.
Institutions may be adjusting portfolios rather than initiating fresh trends.
You’ll often see prices move rapidly in both directions before settling into a range.
Traders who mistake activity for opportunity frequently overtrade these conditions.
Strong participation is valuable.
Purposeful participation is even more valuable.
Combine Overlap Strength With Trend Quality
Session analysis becomes significantly more powerful when combined with a broader market structure.
Suppose the overlap begins while the daily and hourly charts already show strong trend alignment.
Now, momentum, liquidity, and higher-timeframe direction all support the same idea.
That is a very different situation from trading an overlap inside a choppy higher-timeframe range.
This concept builds naturally on our guide How To Measure Trend Slope Properly, where trend quality helps separate healthy moves from weakening ones.
Confluence improves probability.
Risk Management Starts Before the Entry
Many traders focus on where to place their stop loss and ignore the quality of the trading environment.
Loose session conditions add to the uncertainty, even if the chart pattern looks promising.
This is where most traders miscalculate risk. Using the Position Size Calculator removes guesswork by helping align trade size with actual market conditions rather than emotional confidence.
Sometimes reducing position size is the smartest trade you’ll make all day.
Turn Session Analysis Into Measurable Data
If you want to improve your ability to classify session strength, start recording it.
After every trading day, note how you rated the overlap before it began.
Then adjust your expectations to reality.
Watch the volatility.
Quality log of the trend.
Execution metrics
Think about how you feel.
You will learn over time that your finest trades seldom come from typical market conditions.
They come from environments where multiple variables align.
The Trade Journal Template makes this review process much easier because it encourages traders to evaluate the quality of the setup instead of focusing only on profit and loss.
Professional growth comes from pattern recognition, not isolated winning trades.
Scaling Requires Environmental Awareness
Managing larger amounts of capital is not about trading more often.
It is about selecting higher-quality opportunities.
That is why firms such as The5ers, FTMO, and FundedNext evaluate consistency rather than occasional exceptional returns.
A trader who understands when market conditions support aggressive execution usually performs more consistently than one who trades every session with equal conviction.
If you have a diary that shows consistently disciplined execution, controlled risk and intelligent session selection, a The5ers assessment account can be the logical next step to get additional cash without having to increase your own financial exposure.
Common Mistakes Traders Make During Session Overlaps
Every crossover of London and New York is mistakenly considered a trade.
Another is to ignore scheduled economic releases, which could restrict participation on a limited basis before release.
Many traders also mistake high volatility for high-quality liquidity.
Others continue trading after conditions clearly deteriorate because they feel obligated to stay active during the overlap.
The best traders remain flexible.
They adapt to the market instead of expecting the market to adapt to them.
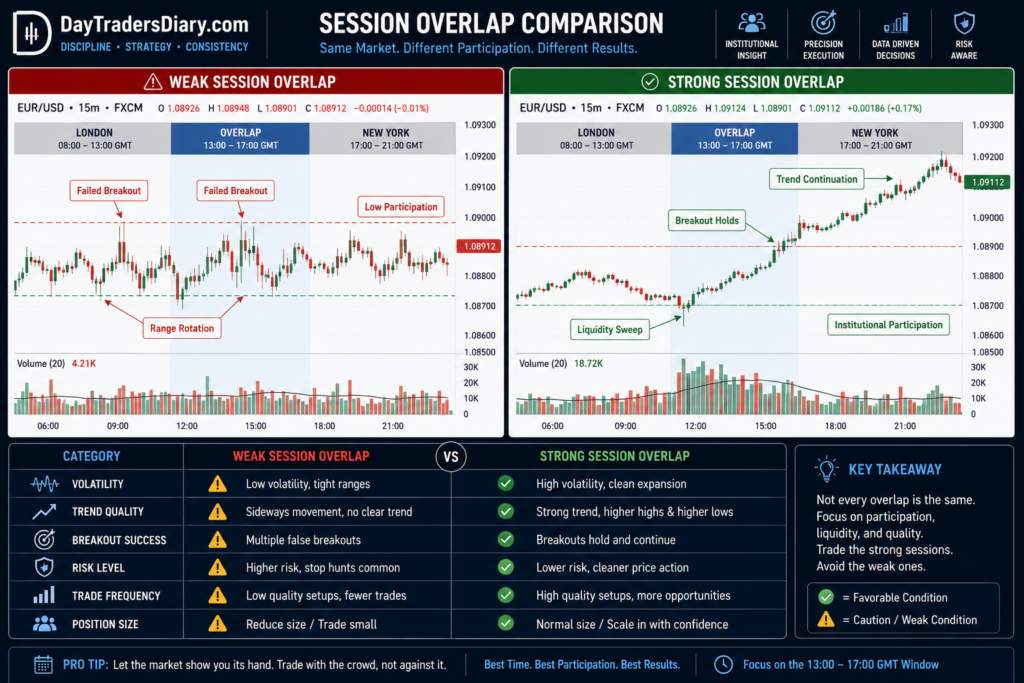
Final Thoughts
The quality of a trading session is never determined by the clock alone.
It is determined by participation, purpose, momentum, and context.
Learning to classify session overlap strength changes your focus from finding more trades to finding better ones.
For the next twenty trading days, score every London and New York overlap before taking your first position.
Then compare your ratings with the actual market behavior.
You may find that your best trades were never about better entries.
They were about better timing.
For your next read, continue with Intraday Setups That Avoid Low-Liquidity Hours to learn how session timing and liquidity work together to improve execution and trading consistency.
Frequently Asked Questions
What is session overlap in forex trading?
When two main financial trading sessions overlap. The busiest time is the overlap of London and New York when both European and North American institutions are involved.
Why is the London and New York overlap important?
The overlap usually provides the best liquidity, the tightest spreads and the strongest price action, making it one of the most attractive times for day traders.
How can traders measure session overlap strength?
Rate the strength of the trade based on: momentum prior to the session, volatility in the market, upcoming economic news, quality of breakout, adherence to higher time frame trend, and total market participation.
Does high liquidity always mean better trading opportunities?
Nope. High liquidity makes execution easy but markets might get stuck in a range if institutions are waiting for news or correcting current positions, not starting new trends.
Should session strength affect position size?
Yes If the market environment is strong, you’ll typically want to size your position normally. If the environment is weaker or uncertain, often you’ll want to take less risk and be more patient.
Why should traders track session quality in a journal?
By recording the strength of the session and the result of the transaction you can then see in what type of environment your strategy works best and make your future decisions more objective and consistent.