
Every active day trader has experienced this trade.
Price spends hours moving sideways inside a clean range. Resistance has been tested several times. The chart looks ready to explode. You enter early, expecting the breakout.
Instead, price pokes above the range by a few points, immediately reverses, and stops you out before making the real move thirty minutes later.
After reviewing hundreds of charts over the years, one pattern becomes impossible to ignore.
Most failed range breakouts have one thing in common. They happen before the market has expanded in volatility.
Many traders spend their time drawing better support and resistance levels. Very few spend enough time asking whether the market has enough energy to sustain a breakout.
That single difference changes everything.
This guide focuses on identifying high-probability breakouts that occur only after volatility expansion. It is based on market structure, volatility behavior, execution experience, and statistical observations rather than chart patterns alone. If your goal is to reduce false breakouts and improve trade quality instead of simply increasing trade frequency, this framework can become one of the most valuable additions to your trading process.
Why volatility matters more than the range itself
A trading range is simply a temporary balance between buyers and sellers.
Eventually, that balance ends.
The problem is that price can leave the range for many different reasons.
Sometimes institutions start to accumulate enormous positions.
News can sometimes create a real disequilibrium.
Sometimes algorithmic liquidity sweeps drive prices temporarily past evident levels before reversing.
Your job is not predicting which breakout will work.
Your job is recognizing when the market has shifted from contraction into expansion.
Professional traders often think less about support and resistance and more about market participation.
Participation, volatility.
The more the volatility, the easier it is to stay with a trend.
Most breakouts without expanded volume have no follow-through.
That’s why so many technically brilliant breakout patterns fail in silence.
What research says about volatility expansion
Several respected organizations have published research supporting the relationship between volatility regimes and directional movement.
Research published by CME Group regularly discusses volatility clustering, where periods of low volatility are typically followed by periods of higher volatility rather than remaining constant.
The CBOE has long documented how volatility behaves in cycles instead of randomly, particularly through products linked to market volatility indexes.
Academic research from the National Bureau of Economic Research has also shown that financial markets experience persistent volatility clustering, meaning quiet markets tend to transition into active markets rather than remaining stable indefinitely.
The practical lesson for day traders is straightforward.
Markets seldom go from calm conditions to sustained trends without signs of greater participation.
The expansion itself is confirmation.
That confirmation often arrives before the strongest portion of the trend.
Understanding the volatility expansion range breakout
Think of volatility as the pressure in a sealed container.
A range is a compressed pressure.
The pressure is venting in a volatility expansion.
The breakout itself is simply the visible result.
Most traders reverse this sequence.
They see the breakout first.
Experienced traders look for volatility expansion first and then evaluate whether the breakout deserves attention.
That subtle shift dramatically improves trade selection.
A proper volatility expansion range breakout strategy begins before the price even reaches resistance.
The market starts revealing increasing participation through larger candles, expanding average true range, increasing order flow, wider intraday swings, and stronger volume participation.
Those signals appear before the breakout becomes obvious.
The four phases every quality breakout follows
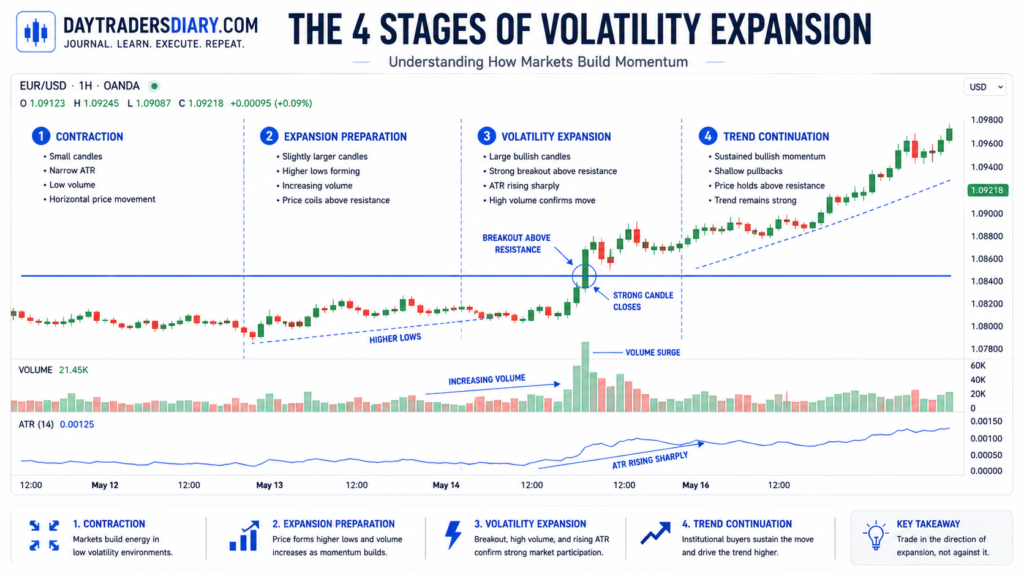
The first phase is contraction.
Price trades inside a relatively tight range.
ATR gradually declines.
Volume goes down.
Momentum indications flatten down.
Retail traders are getting impatient.
Phase two is almost ready to expand.
Individual candles are a bit bigger.
Momentum’s improving.
Volume starts to pick up compared to recent sessions.
Instead of rejecting higher prices immediately, the market starts embracing them.
The third stage is the increase in volatility.
ATR is accelerating.
A few huge candles appear.
The price closes near the high of the candle.
Volume expands.
Pullbacks become shallower.
This is where institutional participation usually becomes easier to recognize.
The fourth phase is trend continuation.
The breakout is now supported by participation rather than hope.
Instead of immediately returning inside the range, price accepts a new value above the resistance.
Many traders only recognize phase four.
Professionals often begin preparing during phases two and three.
What your volatility expansion range breakout chart should actually show
A high-quality breakout chart rarely looks dramatic before the move.
Instead, it shows several subtle improvements.
The average candle size gradually increases.
The ATR begins to rise after a long drop.
Higher lows are developing inside the range.
Above the recent average volume.
Retracements are reduced
Closing prices “approach” resistance rather than constantly repelling it.
These small details matter more than one explosive breakout candle.
Large breakout candles often attract inexperienced traders after much of the move has already occurred.
The best opportunities usually develop quietly.
The mistake that causes most false breakouts
The biggest mistake is confusing price movement with participation.
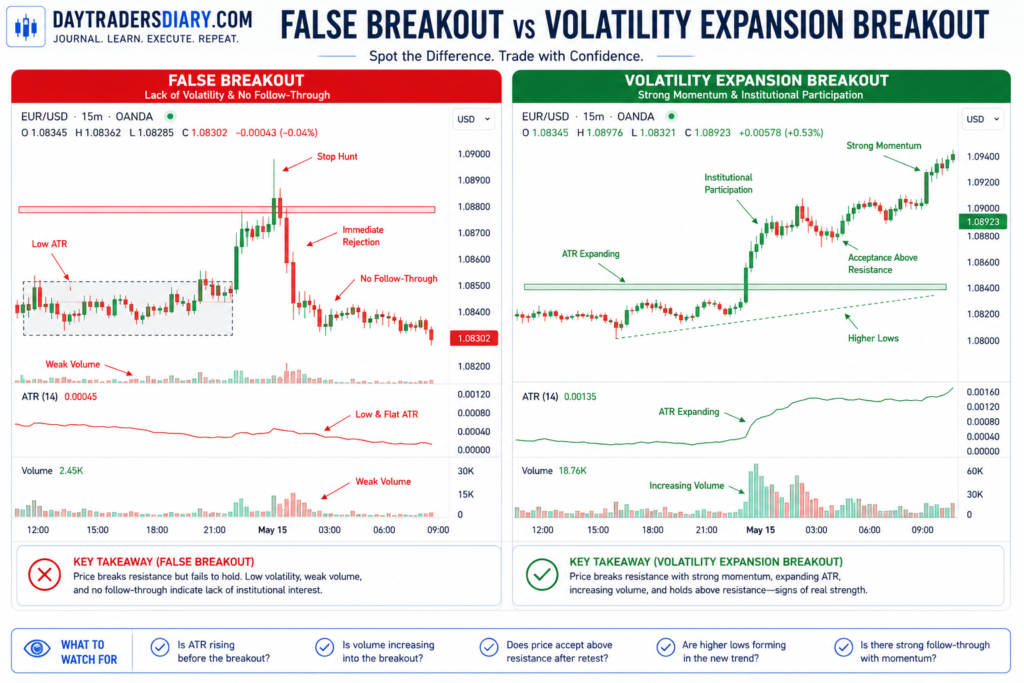
Price can temporarily move beyond resistance because of stop hunting.
That does not mean institutions are building positions.
Acceptance is created by real volatility expansion.
Rejection is caused by false breakouts.
Acceptance means that buyers stick around following the breakthrough.
Rejection implies the price immediately goes back to the old range.
A simple question separates the two.
Did volatility increase before the price violated the range or just because the price broke resistance temporarily?
That distinction prevents untold losing trades.
A practical framework for identifying better breakout trades
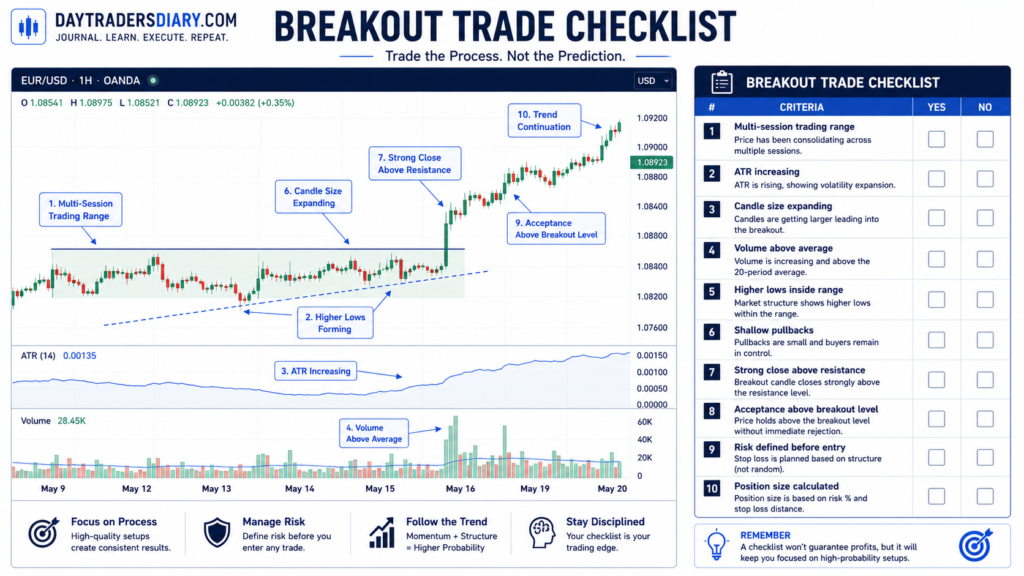
Every morning seek for markets that have traded in very tight ranges for multiple sessions.
Then ATR and size of the recent candles.
If volatility continues shrinking, remain patient.
When ATR begins increasing while price remains inside the range, place that instrument on your priority watchlist.
Watch how the price behaves near the resistance.
Strong purchasers don’t usually back off deep just before a real breakout.
Still no participation in repeated returns to the middle of the range.
But when volatility expands and the price closes beyond resistance and participation continues, the odds of follow-through are much better.
This approach naturally reduces unnecessary trades.
Ironically, trading less often produces better annual returns.
When this strategy performs poorly
No strategy works in every environment.
This approach becomes less effective during extremely news-driven markets.
Temporary volatility spikes might be caused by unexpected economic data releases without setting up permanent trends.
Low liquidity periods can affect reliability.
Holiday trading, lunchtime trading and nighttime trading expansion signs are often false.
Another challenge appears after extended trends.
Late-stage breakouts often represent exhaustion rather than continuation.
Context always matters more than the pattern itself.
If you have already read our guide on price action trading or market structure, this concept becomes much easier to recognize because volatility should always be interpreted alongside the broader market context.
Combining volatility expansion with execution discipline
Good setups do not work.
Execution determines if those failures remain minor.
Many traders widen stops because they feel that higher volatility implies a higher risk.
That assumption often destroys otherwise profitable systems.
Instead, define your maximum acceptable risk before entering the trade.
Then position size accordingly.
This is where most traders miscalculate risk. Using the Position Size Calculator removes guesswork and keeps every trade consistent regardless of market volatility.
Consistency matters more than predicting individual winners.
Why journaling these trades accelerates improvement
One of the fastest ways to improve this strategy is to separate winning and losing breakout trades inside your journal.
Instead of simply recording profit or loss, document whether volatility expanded before entry.
Record ATR behavior.
Record average candle size.
Record volume conditions.
Record whether the price was accepted or rejected at the new highs.
Within fifty to one hundred trades, patterns become obvious.
Many traders discover they entered too early, far more often than they realized.
The downloadable Trade Journal Template makes this review process much easier because it encourages recording contextual information rather than only financial results.
Over time, your journal becomes a decision database instead of merely a trading diary.
Building an edge that can actually scale
Finding an edge is only part of professional trading.
Capital determines how meaningful that edge becomes.
Many disciplined traders eventually discover they have developed consistency but remain limited by account size.
That is one reason evaluation programs have become increasingly popular among experienced traders.
Firms such as The5ers, FTMO, Topstep, and FXIFY all provide different evaluation models designed to identify disciplined traders rather than gamblers.
No evaluation account guarantees success, and none should be viewed as a shortcut.
However, if your volatility expansion range breakout strategy has been thoroughly tested, trading an evaluation account can become a logical next step instead of increasing personal financial risk.
Among these firms, The5ers is particularly known for flexible scaling opportunities and trader development, making it worth considering once your execution has demonstrated consistency over a meaningful sample of trades.
The objective should never be passing an evaluation.
The objective should be to prove your process remains profitable regardless of account size.
Frequently Asked Questions
What is a volatility expansion range breakout?
It is a breakout that occurs after market volatility begins increasing following a period of price contraction. The expansion signals increasing participation, making the breakout more likely to continue.
Which indicator works best for spotting volatility expansion?
ATR is one of the most dependable instruments since it objectively measures shifting market movement. This, along with the candle size and volume, provides a far stronger confirmation than price alone.
Should I enter before or after the breakout?
The most experienced traders usually like to see volatility expand first. If you go in before the expansion you will often get false breakouts and lose for no reason.
Does this strategy work in Forex, stocks, and futures?
Yes. The premise is not about a certain asset class but participation in the market. The details of implementation can be different but volatility growth happens in financial markets.
How can I reduce false breakout trades?
Don’t look at the breakout candle; look at the conditions going into it. Bigger ATR, better volume, stronger closing , shallow pullbacks all make a real advance more likely.
Final thoughts
The biggest lesson most traders learn too late is that breakouts are not an opportunity.
Volatility expansion is.
The breakout confirms that the market has already changed.
When you stop chasing every move beyond resistance and begin studying how participation develops beforehand, your trade selection naturally improves.
Over the next twenty trading sessions, challenge yourself to ignore every breakout that occurs without visible volatility expansion.
You will probably take fewer trades.
You will almost certainly avoid many unnecessary losses.
For your next read, check out our post on how to establish a trading advantage. This concept is a great fit, because fundamentally, spotting volatility expansion is about recognizing recurrent market behavior—not about predicting the future.