
You have a declining market. You wait for a pullback and get ready to sell on the next decline. It all makes sense. We’re in a bearish trend; we seem to be at the appropriate level, and the candles are showing that the sellers are in control again.
Then the price suddenly climbs, takes out your stop, and drops again without you.
If this has happened to you, you know how frustrating it can be. Sometimes your market direction was right, but your timing was wrong. Other times, what looked like a reversal was never a reversal at all. It was just a temporary move against the trend.
Learning how to detect fake pullback reversals is about understanding that difference. You do not need to predict every market turn. You need to recognise when price is actually changing direction and when it is simply testing traders who entered too early.
What Are Fake Pullback Reversals?
A fake pullback reversal happens when the price appears to be changing direction but eventually resumes its previous trend.
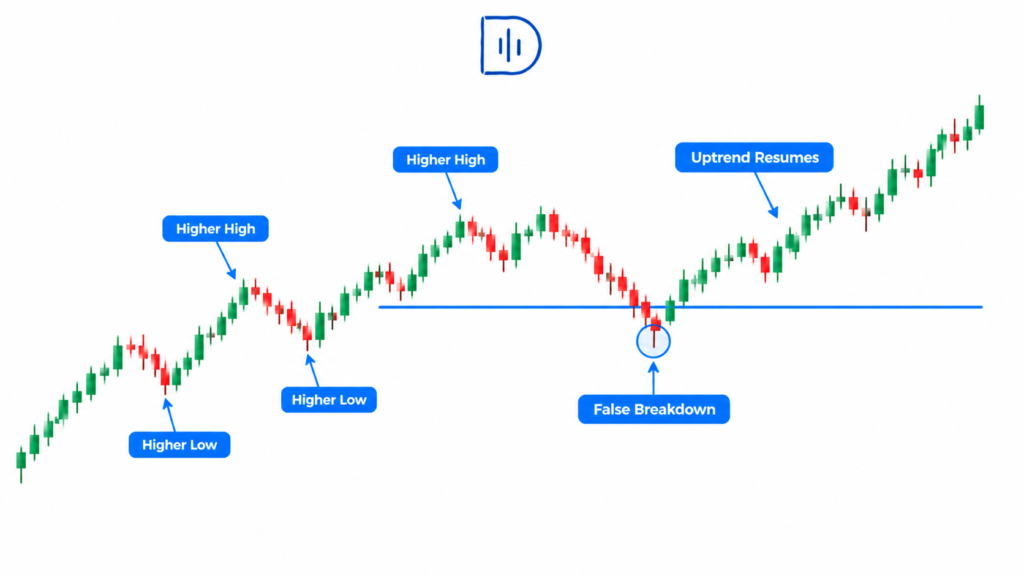
Imagine a stock has been making higher highs and higher lows throughout the morning. It then drops below a small swing low. Traders see the breakdown and begin selling, expecting a larger decline. But the price quickly climbs back above that level, buyers regain control, and the stock makes another high.
That initial bearish move was not enough to confirm a genuine reversal. It was a pullback that temporarily looked like a change in trend.
The same thing happens in a downtrend when a short rally convinces traders that the market has bottomed, only for sellers to push prices lower again.
The tricky part is that a fake reversal and a real reversal can look almost identical at first. The difference often becomes clearer only after you see how price behaves around important levels.
Why Traders Get Caught by False Reversals
One common mistake is looking for a reversal because the existing trend already feels stretched.
After watching a stock climb for hours, you may start thinking it has gone too far. When a large bearish candle appears, it feels like the confirmation you were waiting for. You sell before checking whether the broader structure has actually changed.
This is where trading psychology gets involved. Traders can become attached to a prediction and interpret new price action as evidence that supports it.
Research by Daniel Kahneman and Amos Tversky on judgment under uncertainty explores how people rely on mental shortcuts when making decisions. You can read their work in Science.
For a trader, the lesson is practical: a strong-looking candle is not automatically a strong trading signal. Its meaning depends on where it appears and what happens next.
A bearish candle in the middle of a bullish trend may represent profit-taking. A similar candle that breaks major support and is followed by sustained selling could be much more significant.
The CME Group’s technical analysis education offers a useful background on reading price charts. The real test comes in using chart patterns, say, not as automatic entry signals but in context.
How to Detect Fake Pullback Reversals
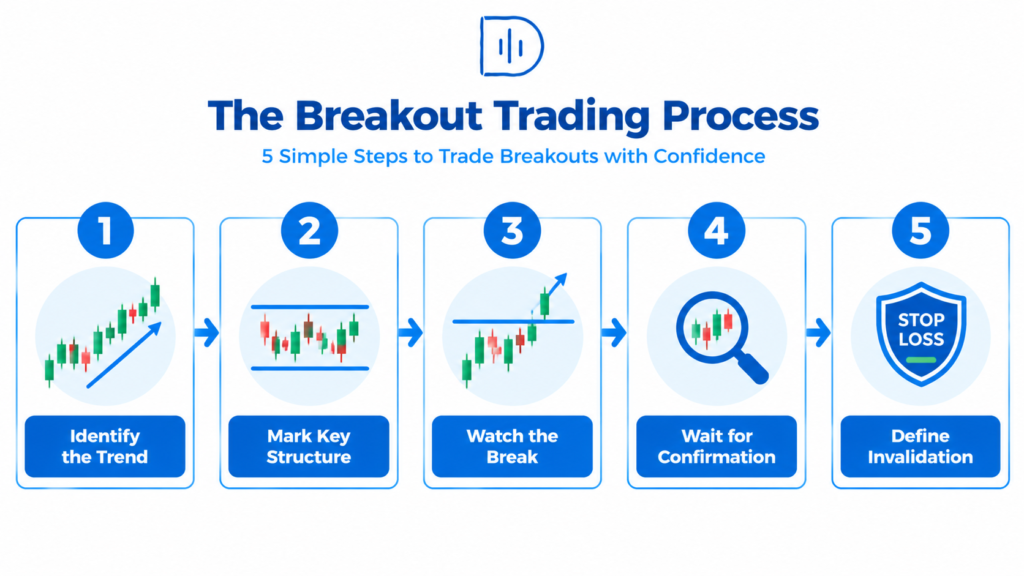
Start with the trend, not the latest candle.
Before deciding whether a reversal is developing, step back and look at the market structure.
In an uptrend, the price generally forms higher highs and higher lows. In a downtrend, it tends to form lower highs and lower lows. These patterns are not perfect, but they give you a starting point.
Suppose EUR/USD has been trending upward on the 15-minute chart. Price suddenly drops below a minor low, and several bearish candles appear. It is tempting to sell immediately.
But look at the bigger picture. Has the market broken an important higher low, or has it only moved below a small level formed during the recent rally?
If the larger bullish structure remains intact, the bearish move may be nothing more than a normal retracement.
This does not mean you should automatically buy every dip. It means you should avoid treating a minor break as proof that the entire trend has changed.
If you need to improve your process for identifying worthwhile opportunities, review this guide to finding high-probability trading setups.
Pay attention to what happens after a level breaks.
A price level breaking is only the beginning of the story.
Imagine gold is moving higher and then falls below a recent swing low. Sellers enter, expecting the decline to continue. But instead of moving lower, price quickly recovers the broken level and pushes above the latest minor high.
That recovery weakens the immediate bearish case. The breakdown did not produce the follow-through sellers needed.
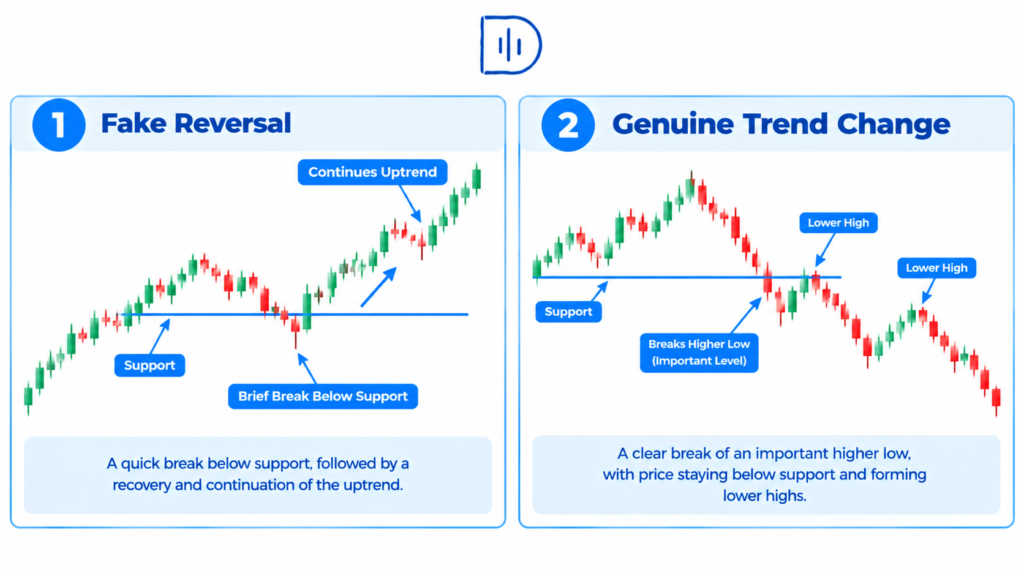
Now consider the opposite situation. Price breaks below a meaningful swing low, stays beneath it, and continues making lower highs. That behaviour provides stronger evidence that sellers may be taking control.
The difference is not simply the size of the candle. It is whether the market can sustain movement beyond the level.
A quick reclaim does not guarantee that the original trend will resume. It simply tells you that the initial breakout or breakdown has failed to establish clear control.
Compare the pullback with the move that came before it.
One useful habit is to compare how the market moved during the trend with how it moves during the retracement.
Suppose a stock has been rising through strong bullish candles, with brief pauses between advances. It then starts pulling back through several large bearish candles, breaking support levels along the way.
That deserves more attention than a slow retracement made up of small, overlapping candles that struggle to move lower.
The reason is simple: the character of the market may be changing. The opposing side is no longer producing only brief interruptions. It may be gaining enough strength to challenge the trend.
But the size of the candle itself doesn’t mean a valid reversal. Remember that a piece of exciting news can produce a big candle but can still reject on a dime. The evidence helps: shape, position in the move, and any subsequent price movement in that direction.
Decide what would prove your trade idea wrong.
Before entering a reversal trade, identify the level that would invalidate your reasoning.
For example, gold is in a bullish trend and begins pulling back. You see a bearish candle near resistance and consider selling. But what exactly would confirm that sellers have taken control?
If your idea depends on price breaking a meaningful higher low and staying below it, a brief move beneath a minor low may not be enough.
This question helps prevent a common mistake: entering because the chart looks bearish, then changing your explanation when the trade moves against you.
A good setup should have a clear reason for entry and a clear point at which that reason no longer holds. If you cannot identify either one, waiting is often the better decision.
Use different timeframes without confusing the signals.
On a one-minute chart, you’re going to have a bearish pattern in the middle of a perfectly fine bullish advance. Traders who choose to take trading decisions using only the smaller timescale could confuse the natural “noise” in the market for a dramatic reversal.
Use a higher timeframe to understand the broader direction and the entry timeframe to refine your timing. They do not need to agree on every small movement, but you should know whether you are trading with the broader trend or deliberately against it.
Countertrend trades can work, but they require a clear reason for expecting a change in direction. A few opposite-coloured candles are rarely enough on their own.
Fake Reversal or Genuine Trend Change?
There is no single signal that separates every fake reversal from a genuine one. However, a few observations can help you judge the situation more carefully.
What you see, what it may suggest.
A minor swing breaks, but the broader trend remains intact —a normal pullback or false break.
Price quickly reclaims a broken level. The initial move may have failed
Price breaks important structure and continues in the new direction , A more credible reversal
Price repeatedly fails to reclaim a broken support or resistance level . The new direction may be gaining acceptance
However, strong opposing candles develop, and the price is still in the previous structure. A caution, not a confirmation.
Think of them as tips, not rules. False moves last longer than you think, and they matter; real reversals may seem to come out of nowhere. You want to accept the market for what it is and not impose a pattern on what’s happening.
Protect Your Account When a Reversal Fails
Even careful analysis will not eliminate losing trades. What matters is making sure that a false signal does not cost more than you planned.
Place your stop where your trading idea becomes invalid, rather than choosing a random distance from your entry. Then calculate your position size based on that stop distance and your maximum acceptable loss.
The DayTradersDiary Position Size Calculator can help you work through that calculation before entering.
If the logical stop is too wide for your risk limit, consider reducing your position size or skipping the trade. Moving the stop closer to make the position larger can leave you vulnerable to ordinary price fluctuations.
Also, check how much room the trade has before reaching the next important support or resistance area. Even if a reversal setup is valid, the potential reward may not justify the risk.
Sometimes the smartest trade is the one you decide not to take.
Use Your Journal to Find Your Repeated Mistakes
It is easy to remember the reversal trades that worked and forget the ones that stopped you out before the price moved in your expected direction.
A trading journal helps you see the full picture.
Use the Trade Journal Template available through DayTradersDiary.com to record the market structure, the level you were watching, the evidence that supported your entry, and what price you got after you entered.
After doing 20-30 of these transactions, then check for trends. Are you going in before the market verifies a break of structure? Are you selling on an uptrend? Do you lose more on specific sessions or around important news releases?
These details are more useful than simply counting winners and losers.
A losing trade does not automatically mean your analysis was poor. A winning trade does not prove that your entry was well planned. Judge the quality of the decision separately from the outcome.
Growing Beyond Your Current Trading Capital
Only when you’re confident that you have a more reliable execution should you consider using more capital, at least your own. Some traders seek out proprietary trading firms where you can get paid to look at your trading process, but those only make sense once you already have a consistent strategy and risk management.
The5ers offers evaluation programs with defined objectives and trading rules. FTMO is another firm traders may compare, while TradeThePool focuses on stock trading.
Before paying for any program, check the current fees, drawdown limits, trading restrictions, payout conditions, and eligibility requirements directly through The5ers and FTMO. Passing an evaluation is not guaranteed, and access to a larger account does not remove the need for disciplined execution.
First, be intelligent and demonstrate that you can adhere to your rules. If your diary indicates you can manage risk and not overtrade over a good sample, then an evaluation account may be for you. Consider it a professional step, not a means to get back your losses, or a way to skip forward in your progression.
FAQs
How can I tell if a pullback reversal is fake?
Consider the big picture, the relevance of the broken level, and what happens after the break. If price pops back above the level soon and follows the original trend, then maybe we have an unsuccessful reversal attempt.
What is the best indicator for spotting fake reversals?
There is no single best indicator. At the beginning, consider market structure, support and resistance, and continue from there. Moving averages and volume give some background, but neither assures the success of the reversal.
Should I enter immediately after a structure break?
Not every time. Waiting for a retest or confirmation that the price can remain above the broken level will help you avoid some false signals. The disadvantage of confirmation is that it may also cause you to enter late or miss the trade entirely.
Do fake pullback reversals happen in gold and forex?
Yes. They are available in gold, currency, equities, futures, etc. The development of these moves can be affected by volatility, liquidity, news, and the time frame.
How can I avoid being stopped out by a false reversal?
You cannot avoid every stop-out. Define your invalidation level before entering, size the position according to the stop distance, and avoid placing stops where ordinary market movement is likely to reach them.
Can a pullback become a genuine reversal?
Yes. A pullback can develop into a genuine reversal when price breaks meaningful market structure and sustains movement in the new direction. That is why you should reassess the evidence instead of assuming the original trend will always continue.
Final Thoughts
Often the biggest progress comes from resisting the impulse to name an action too soon.
The fact that there have been a couple of bearish candles doesn’t mean the trend to the upside has ended. A short rally doesn’t necessarily mean the downturn is over. Give the market some opportunity to start to reveal whether the structure is shifting, and know in advance what will disprove your hypothesis.
Record your following 10 pullbacks and note whether you entered before or after good confirmation. Look at your results and see if the main difficulty is reading structure, time, or stop management.
That is how you turn the experience of being caught by fake reversals into something useful.
For your next read, explore How to Find High-Probability Setups and focus on building a repeatable process for separating genuine opportunities from tempting but weak signals.