
You notice a good setup on the 15 minute chart. Price pulls back to support, you get a bullish candle, and the trend is robust. You buy, anticipating the market will continue to head higher. But alas, pricing stalls, momentum dies, and you have another losing trade.
After a few trades like this, it is easy to blame your RSI settings. Maybe RSI 14 is too slow. Perhaps RSI 7 would give you an earlier signal. You change the settings, test another combination, and soon find yourself adjusting the indicator after every frustrating trade.
I have seen this become a problem for traders who already understand price action but struggle to filter out weaker setups.
The answer is not necessarily a faster indicator. It has a clear reason for using RSI in the first place. A short-term RSI filter should help you decide whether a trade deserves consideration, not tell you to buy or sell every time a line crosses a certain level.
What Is a Short-Time RSI Filter?
The Relative Strength Index, commonly called RSI, measures the strength of recent upward price movements compared with downward movements. It ranges from zero to 100 and is widely used to assess momentum.
The standard setting is 14 periods. On a 15-minute chart, that means RSI calculates momentum using 14 candles, covering about three and a half hours of chart time.
A short-term RSI filter uses this information to screen potential trades. Rather than entering only when RSI reaches an extreme, you use it alongside price structure to determine whether momentum supports your setup.
For example, if you trade bullish pullbacks, you might look for RSI to recover after weakening during the retracement. If you trade bearish breakdowns, you might want RSI to remain weak while price struggles to reclaim resistance.
That small change in approach matters. You are no longer asking RSI to predict the next move. You are asking it to help you avoid trades that lack sufficient momentum.
What Research Tells Us About RSI Settings
J. Welles Wilder developed the RSI in his 1978 book, New Concepts in Technical Trading Systems. Its formula smooths out recent profits and losses, so the different settings behave differently.
The StockCharts RSI guide explains how shorter RSI periods make the indicator more sensitive to price changes, while longer periods produce smoother readings.
For day traders, this creates a familiar trade-off. A faster RSI can help you spot a momentum shift earlier, but it can also react to price noise that has little effect on the broader move.
Fidelity’s technical indicator guide also explains why RSI can remain overbought or oversold during a strong trend. This is worth remembering if you regularly sell just because the RSI rises above 70, or buy just because it falls below 30.
The CME Group’s technical analysis education offers further background on using technical analysis to assess market behavior.
The practical lesson is simple: faster signals are not automatically better signals. The right RSI setting is the one that helps your particular strategy make better decisions.
Choosing RSI Settings for the 15-Minute Chart
If you are building a short-term RSI filter from scratch, start with the 14-period RSI. It is a useful baseline because it is widely used and gives you something to compare against.
Once you have recorded enough trades, you can test shorter settings.
RSI 7 reacts quickly to price changes. That can be useful for traders who need early feedback during fast intraday moves, but the indicator may swing back and forth during choppy conditions.
RSI 9 offers a middle ground. It responds faster than RSI 14 but is not quite as sensitive as RSI 7.
RSI 14 is a sensible starting point for general 15-minute trading. It may help smooth out minor fluctuations while still responding to meaningful changes in momentum.
RSI 21 is slower and smoother. It may suit traders who want to filter out more short-term noise, although the trade-off is that signals can arrive later.
None of these settings is universally best. A configuration that works well on EUR/USD during a steady London session may behave differently on gold during a volatile news release.
Do not choose your settings based on which one looks best on a chart. Choose them based on how they affect your actual trading results.
How To Build a Practical RSI Filter
Start with the setup you already trade.
Before changing RSI settings, decide what your strategy is trying to capture.
If you trade with the trend, RSI should help you assess whether momentum is recovering in that trend’s direction. If you trade reversals, it can help you judge whether momentum is weakening, but you still need evidence that price structure is changing.
These are different trading situations, and they should not share identical rules simply because they use the same indicator.
For example, a trader looking for bullish pullbacks should first identify an uptrend and a meaningful support area. Only then should RSI become part of the decision.
If the market structure is unclear, a promising RSI reading will not magically create a good setup. You can strengthen this part of your process by reviewing how to find high-probability trading setups.
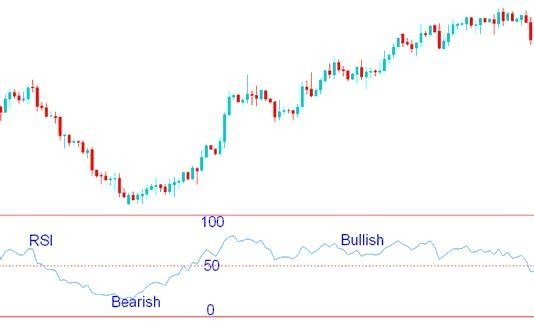
Pay attention to the 50 level.
Many traders focus almost entirely on RSI 70 and 30. For a short-term momentum filter, the 50 level can be more useful.
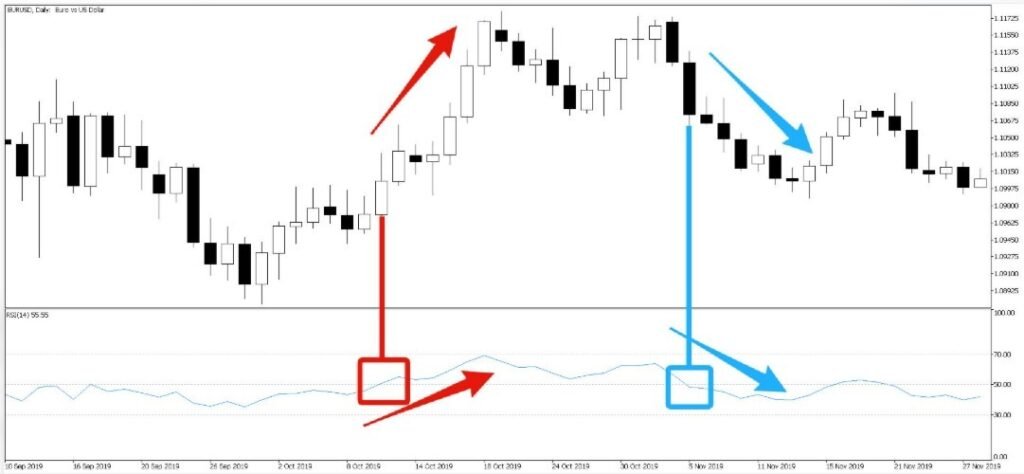
Imagine EUR/USD is moving higher on the 15-minute Chart. Price pulls back toward support, and RSI falls below 50. A few candles later, the selling pressure eases, RSI turns upward, and the indicator crosses back above 50.
Such a rebound signals that bullish momentum may be returning. Then seek for price confirmation, such as a higher low or breakout over a recent minor high.
The opposite idea works during a decline. RSI moves back above 50 amid downturn action and rounds down as resistance bumps price. Returning below 50 is a potential confirmation of a bearish situation.
The important word is support. An RSI cross does not confirm a trade by itself. In a sideways market, RSI can cross 50 repeatedly without producing a worthwhile move.
Make price confirm what RSI is suggesting.
This is where many traders get impatient.
They see RSI turn upward and enter immediately, even though the price is still struggling beneath resistance. When the market fails to break through, they blame the indicator.
A better approach is to use RSI as an early warning that momentum may be changing, then wait for the price to show whether that change matters.
Suppose a stock is trending higher and pulls back to a previous breakout level. RSI is beginning to recover, but the stock has not yet reclaimed its most recent minor high. You can wait for that price level to break before considering an entry.
You may get a slightly later entry, and sometimes the move will leave without you. That is part of the trade-off. The aim is not to catch every move at its lowest point. It is to avoid entering simply because an indicator has changed direction.
Adjust your expectations to market conditions.
RSI behaves differently when a market is trending compared with when it is moving sideways.
During a strong uptrend, RSI can remain above 50 for long periods and repeatedly approach 70. Selling every overbought reading can leave you fighting the trend.
During a strong downtrend, RSI may spend much of its time below 50 and repeatedly approach 30. Buying every oversold reading can produce the same problem in reverse.
In a range-bound market, extreme readings may be more useful when they occur near established support or resistance and the price shows signs of rejection.
Before changing your RSI settings, ask whether the market itself has changed. Sometimes the problem is not the indicator. You may simply be applying a trend-following strategy to a market that is going nowhere.
How To Test Whether Your RSI Filter Works
An RSI filter can make a chart look more organized without improving your results. It may remove losing trades, but it might also eliminate some of your strongest winners.
You need to test both of them.
First, record only the performance of your present strategy without any RSI filter. Once that’s done, see what happens if you use the same entry, stop placement, profit objective, and position size as before, and you use your new RSI rule.
Review the number of trades, win rate, average winner, average loser, expectation with fees, and maximum drawdown. Determine whether the filter is improving the quality of your trades or if it’s causing you to miss opportunities.
RSI 9, for example, can get you in a little sooner, but it can give a few more false signals. RSI 14 might skip the earliest part of a move but filter out some of those entries on the weak side. There isn’t a ‘better’ one. Your outcomes should dictate what trade-off makes sense for you to pursue.
The DayTradersDiary guide to backtesting a day trading strategy can help you organize this process.
Test across different sessions and market conditions. A setting that performs well during one unusually strong week may not hold up when volatility changes.
Risk Management Still Comes First
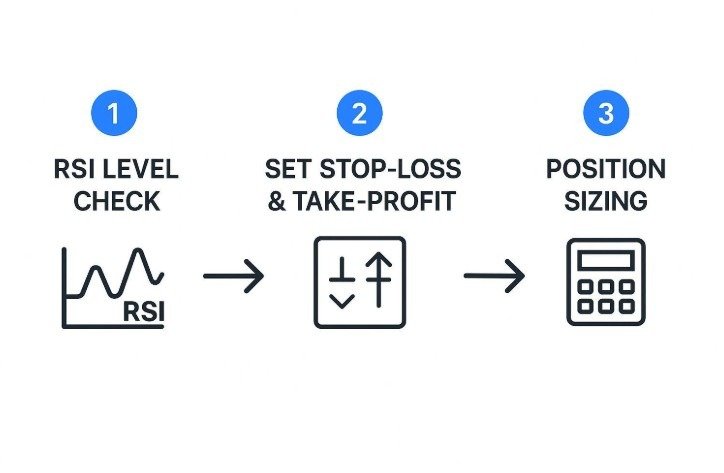
Even when RSI agrees with your analysis, it cannot tell you exactly where the market will stop or how far it will move.
Your stop should be based on the price structure that invalidates your trade. Once you know the stop distance, calculate a position size that keeps the potential loss within your risk limit.
The DayTradersDiary Position Size Calculator can help you work this out before entering.
If the logical stop is too wide for your preferred risk, reduce your position size or pass on the setup. Do not squeeze the stop closer to increase the number of shares or lots you can trade.
And if you’re in a trade, don’t let RSI final against you shake you off your notion for a pub or two. The indicator is there for context, but you need to keep the rules of your entry turned on.
Use Your Trading Journal to Improve the Filter
After a few sessions, you might feel that RSI 9 works better than RSI 14. That feeling is worth investigating, but it is not enough to justify changing your entire strategy.
Use the Trade Journal Template available through DayTradersDiary.com to record your RSI setting, market conditions, entry reason, stop distance, and outcome.
Note whether RSI was under or over 50, whether the price confirmed the indication, and if you were trading along the main trend.
After 30 to 50 deals, go back and see if any patterns emerge. Maybe the RSI 9 filter works OK in powerful movements but generates too many false signals during quiet sessions. Or maybe the RSI 14 filter clears out the weaker entries but doesn’t put too much lag time on you.
You may also discover that the setting makes little difference and that most of your losses come from entering too close to resistance or trading during poor conditions.
That is useful information. The purpose of journaling is not to find a perfect indicator setting. It is to discover which part of your trading process actually needs improvement.
Scaling Your Trading With a Tested Strategy
Once you have a strategy that produces consistent results and you can follow your rules under pressure, you may start considering how to access more trading capital.
Prop firms that provide evaluations are a choice, but only if their criteria fit your style. The5ers offers evaluation programs with targets and risk regulations. As TradeThePool is stock-based, traders are also advised to look at FTMO.
Before committing money, review the current fees, drawdown limits, trading restrictions, payout terms, and eligibility requirements directly through The5ers and FTMO.
An evaluation will not fix a strategy that has not been tested properly. It can add another layer of pressure if you are still changing indicators after every losing trade.
Begin by establishing your own track record. After your diary demonstrates that your RSI filter is improving your decision-making and that you are consistently managing risk, ask yourself if an evaluation account fits your aims. See it as a chance to trade with larger capital and not as a quick way to make a profit.
FAQs
What are the best RSI settings for a 15-minute chart?
RSI 14 is a good base point. RSI 9 is more sensitive; RSI 21 is smoother. Both have their advantages and it is dependent on your plan, market, and testing as to which one is better.
Is RSI 7 good for day trading?
RSI 7 can be useful you quickly identifying short-term momentum changes. However, it is more sensitive to small price movements and can produce frequent false signals in choppy markets.
Should I buy when RSI crosses above 50?
Not necessarily. Exceeding 50 could show momentum improvement, but examine the trend, support and resistance, and a price confirmation of your setup also.
Is RSI above 70 a sell signal?
No. RSI can remain above 70 during a strong uptrend. Before considering a short trade, look for evidence that the market structure is weakening or changing.
Can RSI be used with price action?
Yes. RSI can help you gauge momentum, while price action can assist you discover critical levels and possible zones of entry. Each can be helpful when used independently, but having both will provide more context.
Does an RSI filter improve win rate?
That may be true, but a higher victory rate is not a larger profit. Screening can weed out winners as well as losers. Compare expectancy, drawdown, and expenses of trading to determine whether it adds value.
Final Thoughts
You don’t need five indicators to improve your entries. Sometimes one well-tested filter for a clear purpose will be enough.
Begin with the RSI 14 on the 15m chart. Use the 50 level for momentum, and watch price to validate the setup, noting when the filter supports your trade and when it doesn’t.
For your next 30 trades, keep your rules consistent and test only one RSI setting at a time. Resist the urge to change it after a couple of losses. Let the evidence guide the decision.
For your next read, explore How to Backtest a Day Trading Strategy and use the same process to determine whether your RSI filter genuinely deserves a place in your trading plan.