
You have probably seen this happen. Price spends half an hour moving sideways. Resistance is clear, the candles are getting smaller, and you start waiting for a breakout. Then a large bullish candle pushes through the level. You buy, expecting the move to continue, but the price stalls almost immediately and drops back into the range.
Now you are sitting in a losing trade, wondering how a breakout that looked so strong could fail so quickly.
The problem is that a strong candle and a strong breakout are not necessarily the same thing. Price can jump through a level without attracting enough follow-through to keep moving. Sometimes the move is genuine, but you enter too late. Other times, the market briefly crosses a level before returning to the area it was trading in before.
Learning how to isolate breakout surges means understanding these differences. Instead of chasing every large candle, you look at what the price was doing before the move, how it breaks the level, and whether the market can hold the ground it has gained.
This approach will not eliminate false breakouts. It can, however, help you avoid trades that look exciting but offer little evidence of a worthwhile opportunity.
What Does It Mean To Isolate A Breakout Surge?
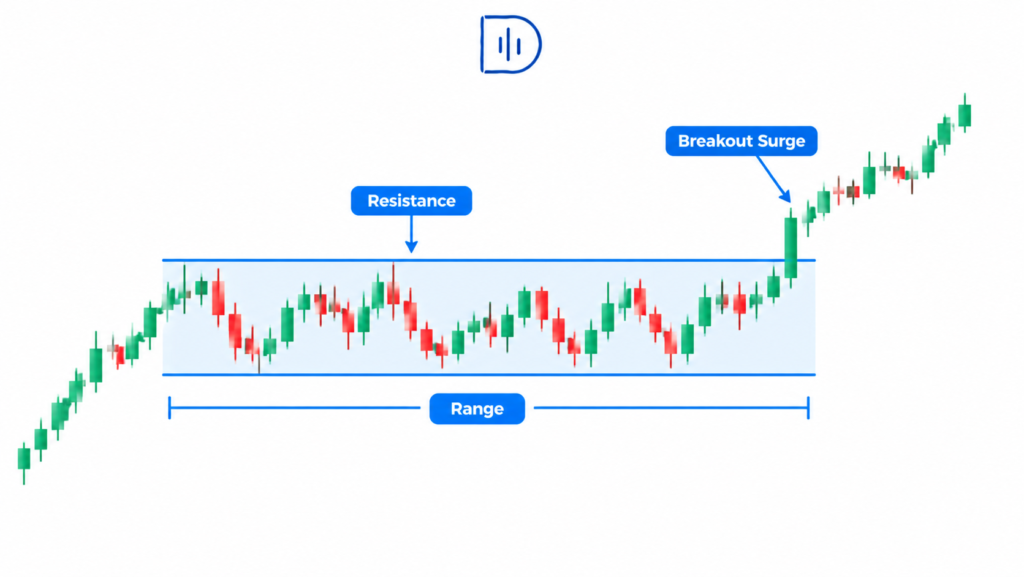
A breakout surge is a sharp move beyond a price level that the market has struggled to cross. That level might be the upper boundary of a consolidation range, a previous session high, or an important support or resistance zone.
The challenge is deciding whether the move has enough strength to continue.
Imagine EUR/USD has traded between 1.0820 and 1.0840 for the past hour. Buyers have tried to push through 1.0840 several times but have failed. Eventually, the price breaks above the level and reaches 1.0847 in a large bullish candle.
It is tempting to buy immediately. But what do you actually know at this point? Price has crossed resistance, and the upward move has been relatively strong. You do not yet know whether buyers will continue supporting higher prices.
Each time the price moves above 1.0840 and falls back below it before breaking out, the breakout becomes stronger. However, if price returns quickly to below 1.0840, perhaps the first increase was an unsuccessful effort at a breakout of the range afterward.
That is the difference you want to learn to recognize. You are not trying to predict every sudden move. You are looking for breakouts that develop in a way your trading plan can recognize and manage.
Why Some Breakouts Run And Others Fall Apart
Markets do not move in straight lines. Price can spend a long time within a narrow range before moving sharply when buying and selling pressure changes. New information, order flow, and activity around widely watched levels can all contribute to that expansion.
However, a break of a level does not mean that the price will continue in that direction. Early traders may take profits, new orders may not emerge, or the first move may not have adequate support.
The CME Group’s technical analysis education
explains how traders use support, resistance, and price patterns to interpret market behavior. For breakout trading, the important point is that a level gives you a place to evaluate price, not a guarantee of what happens next.
Volatility matters, too. If you have a period of silence followed by a big candle, then you want to go check that out because that means the level of activity has changed dramatically. However, big candles are also formed in volatile markets. Their prominence relative to the surrounding market.
You can explore historical market and economic data through the Federal Reserve Bank of St. Louis’s FRED database. It’s not a breakout signal type service, but it will assist you in examining how market conditions alter around different economic environments.
Participation provides another useful piece of context. The CFTC’s market reports offer positioning information for selected futures markets. These reports are not meant to be confirmation of an intraday breakout, but they give you a feel for why knowing who trades a market can offer context to price action.
Be careful when using volume to confirm forex breakouts. Spot forex does not have one central exchange that reports all trading activity. Tick volume from your broker can help you compare activity within that particular feed, but it is not a complete picture of global currency trading.
For a day trader, the lesson is simple: do not judge a breakout by the size of one candle alone. Look at the conditions that produced it and the price action that follows.
Start By Studying The Range
A useful breakout setup often begins before the breakout itself.
Look for an area where price has repeatedly struggled to move beyond a boundary. The clearer the boundary is, the easier it becomes to decide whether a genuine break has occurred.
For example, suppose NASDAQ repeatedly approaches the same resistance level during the morning session. Each attempt attracts sellers, and the price moves back into the range. You mark that resistance before the next attempt rather than drawing a new level after the price has already surged through it.
Also, pay attention to the candles inside the range. Are they becoming smaller? Is price spending more time near resistance? Are repeated attempts to move lower producing less distance?
These details can help you understand the situation, but they should not be treated as predictions. A tight range can break upward, break downward, or continue sideways longer than you expect.
The purpose of studying compression is to prepare for a possible expansion. It is not to convince yourself that a breakout must happen.
If you want to understand how these conditions affect your results, backtesting a day trading strategy can help you compare different range structures and entry methods using historical trades.
Learn To Read The First Surge
When the price finally breaks out, compare the candle with the recent price action.
A candle that is noticeably larger than the previous 10 to 20 candles may signal an increase in activity. Its closing location also matters. A bullish candle that closes near its high shows that much of the upward movement remained intact by the close. A candle that reaches far above resistance but closes near its low has given back a substantial part of its advance.
Neither candle tells you what will happen next. They provide different evidence about how prices behaved during that period.
You can measure the breakout candle against the average range of recent candles. Some traders test thresholds such as 1.5 times the recent average range, but there is no universal number that separates valid breakouts from failed ones. The appropriate threshold depends on the instrument, timeframe, session, and strategy.
The other thing to watch is how far the price has already traveled.
Suppose resistance breaks and price immediately rises 15 pips. If your planned stop needs to sit below the breakout level, entering at the top of that move may leave you with a poor reward-to-risk ratio. The breakout might continue, but the trade may no longer offer a sensible entry.
This is where patience becomes useful. You do not need to catch the first candle to trade a breakout well.
Watch What Happens After Price Crosses The Level
The most revealing part of a breakout often comes after the initial move.
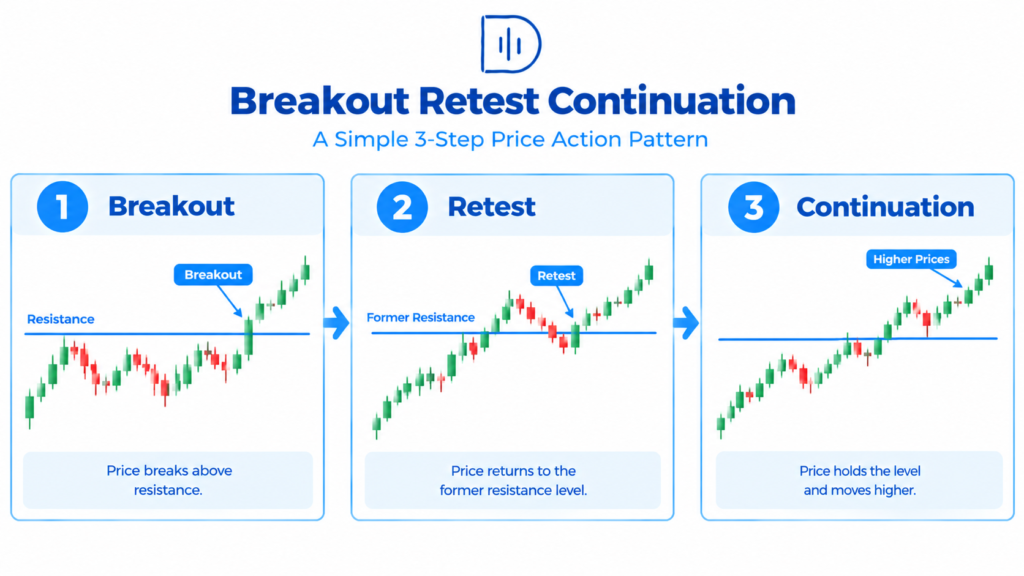
Suppose EUR/USD breaks above 1.0840 and reaches 1.0846. Rather than buying automatically, you watch how the price behaves around the former resistance.
If price pulls back toward 1.0840, holds above it, and begins moving higher again, that can suggest buyers are willing to defend the area. A trader whose strategy requires a retest might look for a suitable entry after the smaller bullish structure develops.
Now imagine price breaks above 1.0840 but quickly fall back to 1.0835. The market has failed to hold above the level. Buying simply because the first candle looked impressive would ignore the information that followed.
That doesn’t indicate that all breakouts will retest the level. The best moves aren’t always easy to second-entry. Waiting for confirmation can cost you part of the move, but an early entry will see you getting burnt more often than on a false breakout.
There’s no better way. The story will be in your records. Review instant entry and retest entries with the same price action, session, and setup conditions. Account for your spread and commissions/slippage, if relevant.
The goal is to find out which approach works for your strategy, not which entry looks best on a chart after the outcome is already known.
Check How Much Room The Market Has Left
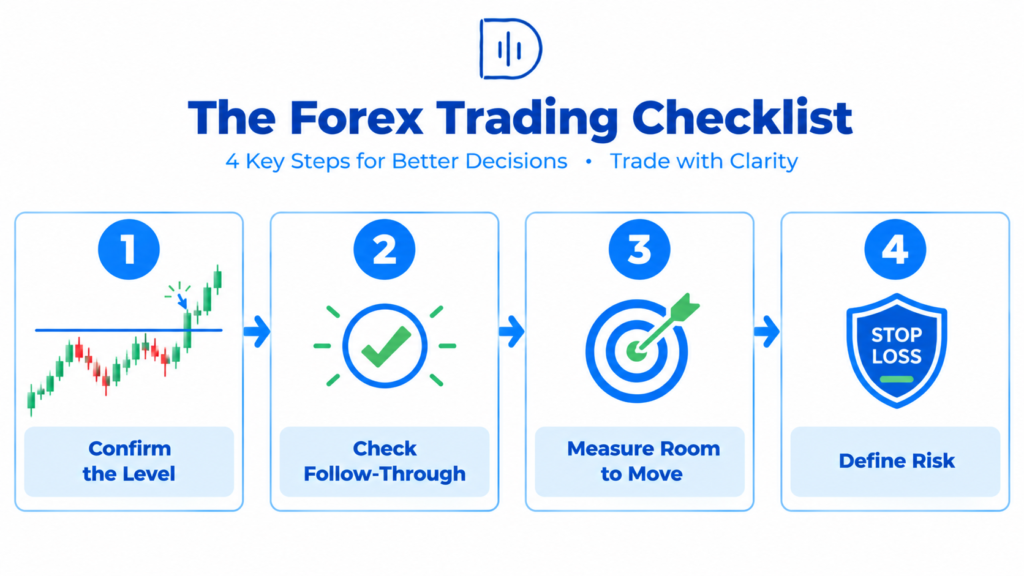
One mistake I see in breakout trading is paying too much attention to the level being broken and too little attention to what lies beyond it.
Say you want to buy a few pips above the prior day’s high, but the price is breaking out of a morning range. Sellers could have a target to start selling or taking profits at that level. And even if it is a true breakout, your trade could face resistance before reaching your goal.
Before entering, mark the next important swing high, swing low, session extreme, or higher-timeframe level. Then consider whether the available distance justifies the stop your setup requires.
A breakout with strong momentum is not necessarily a good trade if the potential reward is small. Likewise, a slower move may offer a better opportunity when the price has clear room to travel.
This is an important part of isolating breakout surges. You are not just looking for a fast move. You are looking for a move that offers a reasonable opportunity relative to the risk you must take.
Manage Risk Before You Enter
Fast breakouts can create a sense of urgency. You see the price moving quickly, worry that you will miss the opportunity, and enter before working out where the trade would be invalidated.
That is often when a promising setup turns into an avoidable mistake.
Enter a trade knowing what might break it. This depends on your plan; it could be a push back into range, a failed retest, or a break of the break to support structure. The stop should be dictated by the setup and not by your greed for a greater position.
Then calculate your position size. The Position Size Calculator can help you work out an appropriate size based on your stop distance and planned monetary risk.
If the stop needs to be wider than expected, reduce your position size or leave the trade alone. Do not force the stop closer to make the numbers look attractive.
And if price has already surged well beyond your intended entry, be willing to let it go. Missing a breakout is frustrating, but chasing an extended candle can leave you taking a trade with a poor entry and little room for further movement.
Use Your Journal To Find Your Best Breakout Conditions
You might believe that your best trades come from large breakout candles, only to discover after reviewing your results that those entries produce frequent losses because you are getting in too late.
Your journal can help you find these differences.
Record the market and session, the size of the range before the breakout, the breakout candle’s range, where it closed, whether the price retested the level, and how far you were from the next major obstacle when you entered. Also, record whether you followed your entry and stop rules.
The Trade Journal Template can help you keep this information organized.
After collecting enough trades, compare similar setups. You may find that breakouts from narrow ranges work better during certain sessions, or that waiting for a retest improves your results even though you miss some of the fastest moves. You might also discover that your worst losses come from entering after two or three large candles have already formed.
Review these patterns over a meaningful sample rather than concluding a handful of trades. Change one part of the method at a time so you can tell whether the adjustment actually helps.
When Should You Consider Scaling Up?
Once your breakout strategy has a reliable record, you may start thinking about trading with more capital. But a larger account will not fix poor entries, weak risk control, or the habit of chasing price.
Evaluation programs from The5ers, FTMO, and TradeThePool offer different routes for eligible traders seeking access to trading capital. Their markets, fees, evaluation rules, drawdown limits, and payout conditions vary, so compare the current terms before committing to a program.
The5ers may be worth researching if you want to explore a structured evaluation pathway. The sensible time to consider an evaluation is when your trading records show that you can follow your strategy through both winning and losing periods.
For example, if you’re a breakout trader, this entails knowing how your setup trades off erroneous breaks, how much of a losing streak it can sustain, whether your risk rules are within the assessment’s parameters, etc. For instance, a system that chases enormous candles could not have good drawdown control and could fail.
Treat an evaluation as a possible next step, not a way to force results from a strategy you have not tested. Prove that your process works first, then decide whether the program’s conditions suit it.
Frequently Asked Questions
What does it mean to isolate breakout surges?
That is, you know the difference between a sustainable breakout and merely a blip above support (or below resistance). You look at the range prior to the break, the size and close of the breakout candle, the follow-through, and the space ahead.
How can I tell whether a breakout is genuine?
One confirmation is not enough to be successful. A breakout over a defined level, followed by acceptance above that level and continued advance in that direction, is more evidence than a candle that simply ‘bounces’ right back down within the range. Check your requirements for your favorite time frame and market.
Is a large breakout candle a good entry signal?
Not by itself. A large candle may show strong price expansion, but it can also mean the move is already extended. Check where the candle closes, how it compares with recent candles, and whether there is enough room for the trade to develop.
Should I wait for a retest before entering?
It is contingent upon your view. Retests can help with assessing risk, although not all breakouts retest before continuing. Compare retest entries with the entry taken on the spot in your trading log and backtest to see which you prefer.
Which timeframe works best for breakout trading?
There is no universal best timeframe. Some traders use higher timeframes to identify important levels and lower timeframes to time entries. The right combination depends on the instrument, holding period, and the amount of price noise your strategy can tolerate.
How can I improve my breakout trading results?
Compare your losing breakouts with winning breakouts in like circumstances. Write down the size of the range, the kind of candles, the time of entry, retests, and how far the entry is from your next big level. Use that tracking to hone one guideline at a time; don’t keep tweaking your plan.
Final Thoughts
A breakout might be very convincing and go nowhere too. That’s why you never enter simply because of the magnitude of the first candle.
Look for a defined range and observe how the price breaks from the range and if the market can hold the breakout price level. First, you need to be sure you have room for the deal and a reward that might be worth your risk as you enter.
For your next 20 breakout setups, record whether the price holds beyond the breakout level or falls back into the range. Also note how far the price had already traveled when you entered. You may find that your problem is not identifying breakouts, but entering after the best opportunity has passed.
For your next read, explore how to find high-probability trading setups. The goal is not to catch every surge. It is to recognize which ones deserve your attention and your risk.