
You see a bullish fractal appear on your five-minute chart. Price looks ready to move higher, so you enter a buy trade. For a moment, it seems like the right decision. Then the price turns down, hits your stop, and moves in the opposite direction.
A little later, the market starts climbing again.
Situations like this can make you question whether fractals work at all. But often, the problem is not the indicator. It is how you are using it.
A fractal can show you where price has formed a potential swing high or low. What it cannot tell you on its own is whether that swing fits the bigger picture. That is where trend bias comes in.
When you combine fractals with trend bias, you stop treating every signal as an opportunity. Instead, you look for setups that make sense within the current market structure.
Let’s look at how to do that practically.
What Are Fractals, and Why Combine Them With Trend Bias?
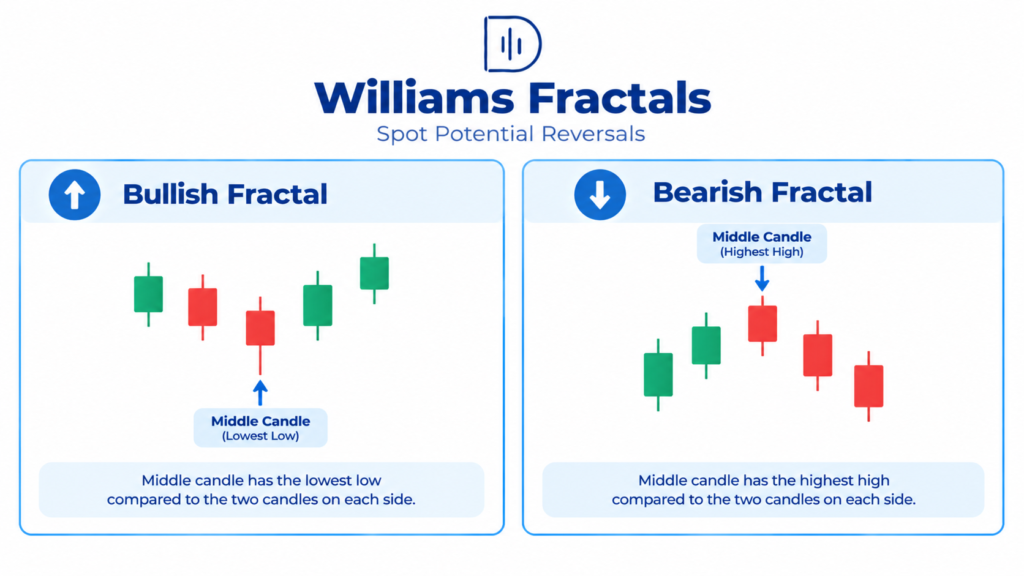
A standard Williams fractal identifies a potential turning point using a five-candle pattern. A bullish fractal forms when the middle candle has a lower low than the two candles before and after it. A bearish fractal forms when the middle candle has a higher high than the surrounding candles.
The pattern requires two candles on the right side to confirm. This delay matters. By the time the fractal appears, the price may already have moved away from the original swing point.
You can see how the indicator works in TradingView’s Williams Fractal guide.
Trend bias gives you the context that the fractal lacks. It helps you decide whether you should be looking for buying opportunities, selling opportunities, or staying out until the market becomes clearer.
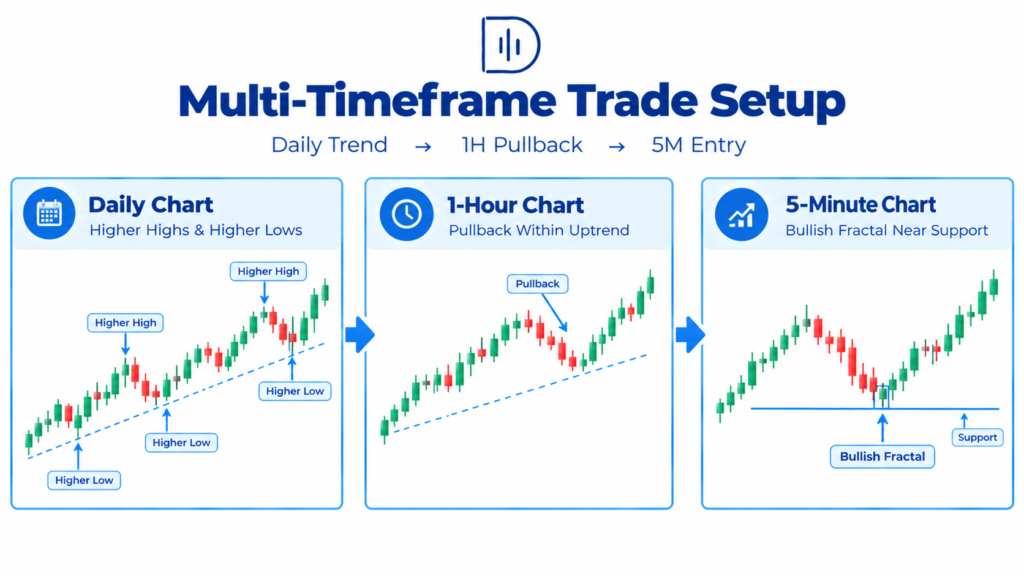
For example, imagine the one-hour chart is making higher highs and higher lows. Price pulls back, and a bullish fractal forms on your five-minute chart. That signal may offer a useful entry opportunity because it appears during a pullback within an established uptrend.
Now imagine the same bullish fractal appears while the one-hour chart is making lower lows. The pattern still exists, but buying it means fighting the current structure.
The difference is simple: the fractal helps you find a possible entry, while trend bias helps you decide whether that entry makes sense.
What Market Research Tells Us About Fractals and Trends
Fractals are useful for marking price structure, but it is important not to give them more predictive power than they deserve.
The MetaTrader fractal indicator guide explains how the indicator identifies local highs and lows. In practical terms, these are points where price has already shown a particular pattern, not promises about what it will do next.
The CME Group’s technical analysis education also covers trend identification, support and resistance, and reversals. These concepts are useful because a price pattern rarely tells the whole story on its own.
There is another issue worth understanding. Trend-following strategies can struggle when prices move sideways. The CME Group’s discussion of trend and anti-trend trading provides useful background on the difference between these approaches.
The takeaway for day traders is practical. You can use fractals to help you structure your submissions, but you still have to use your judgment as to the market environment. Fractal in clean trend is not same trade as fractal occurring in middle of choppy range.
How to Combine Fractals With Trend Bias
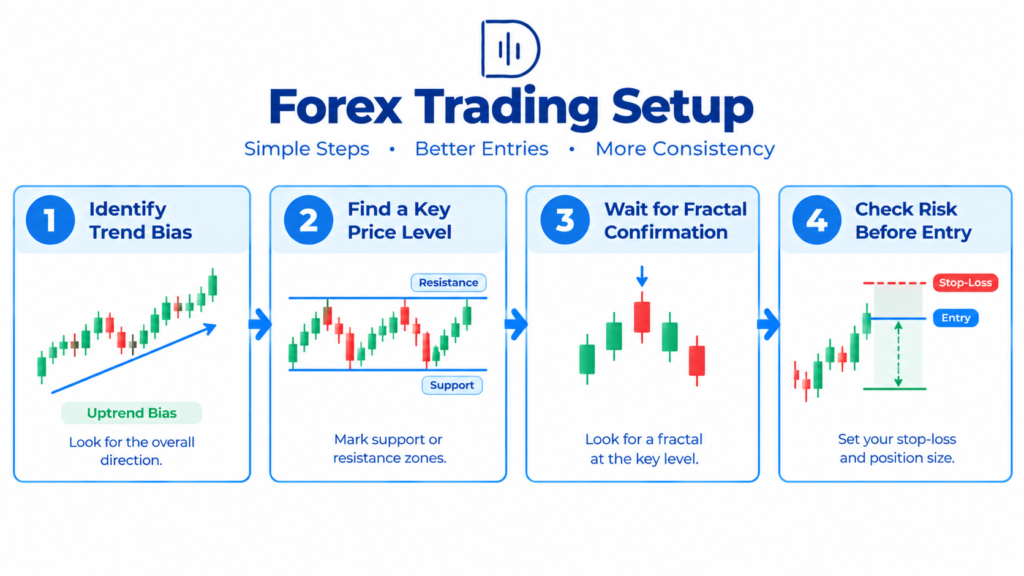
Start with the daily chart.
Before looking for an entry, take a few minutes to understand what the price is doing on the daily chart.
Is the market making higher highs and higher lows? Is it lowering the highs and lowering the lows? Or has the price been moving sideways between two clear levels?
You do not need to predict where the market will be by the end of the week. You need a working view of the current structure.
Suppose gold has been moving higher for several sessions. The daily chart shows higher swing lows, and the price remains above a previous breakout area. That gives you a bullish starting point.
It does not mean you should buy immediately. Gold may still pull back, sweep a previous low, or spend hours moving sideways.
Your job is to use the daily chart as a guide, not as a reason to ignore what happens next.
Check whether the one-hour chart supports your bias
The daily chart provides the bigger picture, but the one-hour chart can help you decide whether that direction is useful for an intraday trade.
Let’s say EUR/USD looks bullish on the daily chart. On the one-hour chart, the price breaks above a recent swing high and then pulls back without breaking the previous meaningful low.
That behavior supports the bullish idea.
You can now look for a bullish fractal on your five-minute or fifteen-minute chart. The goal is to find a possible entry as the pullback starts to lose momentum.
But what if the one-hour chart begins making lower highs and breaks below a key swing low? That should make you reconsider the setup.
A bullish daily chart does not guarantee a bullish session. If the lower-timeframe structure is moving against your plan, waiting is often better than forcing an entry.
Wait for the fractal to form at a meaningful level
This is where many traders get impatient.
They see a bullish fractal and buy, even though it has appeared in the middle of a messy range with no clear support nearby. When the price continues falling, they blame the indicator.
Instead, ask yourself where the fractal has formed.
Is it near a previous breakout level? Has price pulled back into an area where buyers previously stepped in? Is the market reacting to a meaningful intraday low?
The location matters because it gives you a reason to expect a reaction.
Once the fractal is confirmed, you can wait for the price to show some evidence that the pullback is ending. For example, price might hold the area and break a nearby minor high. That additional confirmation does not guarantee a winner, but it gives you a clearer basis for entering.
For bearish setups, reverse the process. Look for a bearish bias, a rally into a relevant resistance area, and a confirmed bearish fractal followed by evidence that sellers are regaining control.
A Realistic Example of a Fractal Trend-Bias Setup
Imagine the S&P 500 is trending higher on the one-hour chart. It breaks above a previous high, then pulls back toward that level.
You switch to the five-minute chart and notice a bullish fractal forming near the breakout area.
You do not buy the moment the indicator appears; you wait for confirmation. Price retains the area and breaks above a nearby minor swing high. Now you have three elements in play for your long setup: a bullish overall structure, a reasonable entry point, and a price action trigger.
Before entering, you identify the level that would invalidate the trade. You calculate your position size and decide where you will take profits or manage the position if the price moves in your favor.
Now consider a different outcome. The same bullish fractal appears, but the price breaks below the pullback low and continues to fall.
You skip the trade.
That is not a missed opportunity. It is your plan doing its job. The fractal gave you a point to watch, but the price failed to confirm the idea.
When This Strategy Stops Working Well
Combining fractals with trend bias is not a solution for every market condition.
Sideways markets are particularly difficult. Price may form bullish and bearish fractals repeatedly as it moves between nearby levels. If you trade every signal, you can end up taking several small losses without catching a meaningful move.
Late entries are another problem. The market may have already moved a big distance before you can act on it, because fractals need confirmation. If your stop gets too wide or the next resistance level is not offering much profit potential, the setup may no longer be worth taking.
Be careful around major economic announcements, too. A sudden burst of volatility can push the price through several short-term swing levels in seconds. A fractal that looked useful moments earlier may have little value once market conditions change.
The most important skill is knowing when not to trade. If the daily chart is bullish, the one-hour chart is bearish, and the five-minute chart is producing signals in both directions, you do not need to force a decision. Wait for the structure to become clearer.
Risk Management Still Comes First
Even a well-aligned fractal can fail. The point of combining it with trend bias is to make better decisions, not to eliminate losing trades.
Before entering, decide what would disprove your trade idea. Your stop should reflect that invalidation point and your strategy’s rules.
Then work out how much you can risk and calculate the position size accordingly. The DayTradersDiary Position Size Calculator can help you connect your stop distance to your planned risk.
One mistake worth avoiding is giving a losing trade extra room simply because the daily trend still looks strong. Your broader directional idea might remain valid, but your particular entry can still fail.
Keep those two things separate. A market can remain bullish overall while your long trade is no longer worth holding.
If you want to improve your results, backtesting your day trading strategy can help you determine whether your rules actually work under different conditions.
Use Your Trading Journal to Find Out What Works
After a trade closes, it is tempting to focus only on the result. A profit feels like proof that you were right, while a loss can make you question the whole method.
Neither reaction tells you much on its own.
Record the daily bias, one-hour market structure, fractal location, entry confirmation, stop distance, and final result. Note whether the market was trending or ranging when you entered.
You can use the Trade Journal Template available through DayTradersDiary.com to keep those records organized.
After you have collected a reasonable sample of trades, look for patterns. Are your entries more successful when fractals form near previous breakout levels? Do you lose more often when the one-hour chart disagrees with the daily bias? Are you entering too late after waiting for confirmation?
These answers can help you improve the rules instead of constantly changing indicators.
Can Better Trading Discipline Help You Scale?
Once you have tested your approach and can follow it consistently, you may start thinking about trading with more capital.
Some traders look to proprietary trading assessments since these programs can provide access to trading cash with certain rules. FTMO is another widely recognized one. The5ers has evaluation-oriented programs. Those who focus on stocks might also look at TradeThePool, which caters to a different market niche.
If you’re considering The5ers, then read over its current program rules, fees, drawdown restrictions, and payoff terms before you become involved.
An evaluation account won’t fix inconsistent execution. If you take every fractal, don’t bother with your stop, or raise risk after a loss, tighter account rules might make those concerns more apparent.
A better way is to first establish a repeatable procedure. Keep track of your performance, discover how your strategy performs under different conditions, and only consider it for evaluation if its rules fit the way you trade.
FAQs
Are fractals useful for day trading?
Can we utilize fractals to find possible swing highs and lows? These are frequently more beneficial when utilized in conjunction with market structure, directional bias, and a stated entry rule rather than alone.
Which timeframe should I use for trend bias?
It is dependant upon how long you hold the trades. A day trader might use the daily chart for perspective, the hourly chart for structure, and the five-minute chart for entry—test several combinations that fit your plan, not simply one that fits all.
Can I use fractals with a daily bias indicator?
Yes. A daily bias indicator can help you organize your directional outlook, while fractals can identify potential entry points. But an indicator should complement your price analysis, not replace it. Make sure you understand how your selected bias indicator generates its signals.
Do fractals repaint?
Standard Williams fractals require candles on both sides of the potential swing point. The pattern is confirmed only after the required candles have closed. If you test a strategy, make sure you use the time when the signal actually became available, not the earlier candle where the arrow is displayed.
Should I trade every fractal that agrees with the trend?
No. A fractal may form in a poor location, too close to resistance or support, or during a choppy session. Look for a setup that fits your rules and offers enough room for the trade to work.
How can I improve a fractal trading strategy?
Set explicit rules: set your bias time period, the market condition you will trade, where a fractal has to emerge, what confirms the entrance, and where the setup is invalid. Then test those criteria on a meaningful sample of trades.
Final Thoughts
Combining fractals with trend bias is not about finding more signals. It is about becoming more selective with the signals you already have.
Use the higher timeframe to understand the market, the lower timeframe to find a potential entry, and price action to decide whether the setup is developing as expected. If those pieces do not agree, there is no need to trade.
Try this simple exercise for your next 20 trades: put down your directional bias before you seek fractals. Take only settings that fit your pre-defined conditions, then review the findings honestly.
You may discover that your biggest improvement does not come from a better indicator. It comes from learning which signals are worth acting on and which ones are better left alone.
Next read: How to Find High-Probability Setups.