
Many traders believe better entries come from lower timeframes.
So they spend hours switching between the 1-minute, 5-minute, and 15-minute charts, searching for the perfect setup.
Ironically, the more charts they watch, the less clarity they have.
I’ve seen traders correctly identify the long-term trend on the daily chart, only to abandon their plan because of a five-minute pullback that ultimately meant nothing.
The result is familiar.
Late entries.
Early exits.
Overtrading.
Constant second-guessing.
The problem isn’t a lack of information.
It’s too much information.
Professional traders don’t use daily charts because they’re slower to process.
They use them because they remove noise and improve decision quality.
Even active day traders who execute on intraday timeframes often begin every trading day with the daily chart. It provides the context that lower timeframes cannot.
This guide explains how to build an effective daily chart setup for forex trading, how successful traders use higher-timeframe analysis to improve intraday execution, and why your daily chart may be the most valuable tool on your screen.
Why the Daily Chart Matters More Than Most Traders Think
The daily chart is often treated as something only swing traders need.
That is a costly misconception.
The Bank for International Settlements (BIS) research shows that longer-term market direction is affected by institutional participation, macroeconomic developments and liquidity flows. These dynamics are best seen on greater timeframes rather than on intraday charts.
Research published by the CFA Institute also emphasizes that investors who focus on a broader market context tend to make more consistent decisions than those reacting to short-term price fluctuations.
For day traders, this means the daily chart provides context rather than entries.
It answers questions such as:
Which direction has the highest probability?
Where are the major support and resistance levels?
Is volatility expanding or contracting?
Is the market trending or ranging?
Those answers influence every trade that follows.
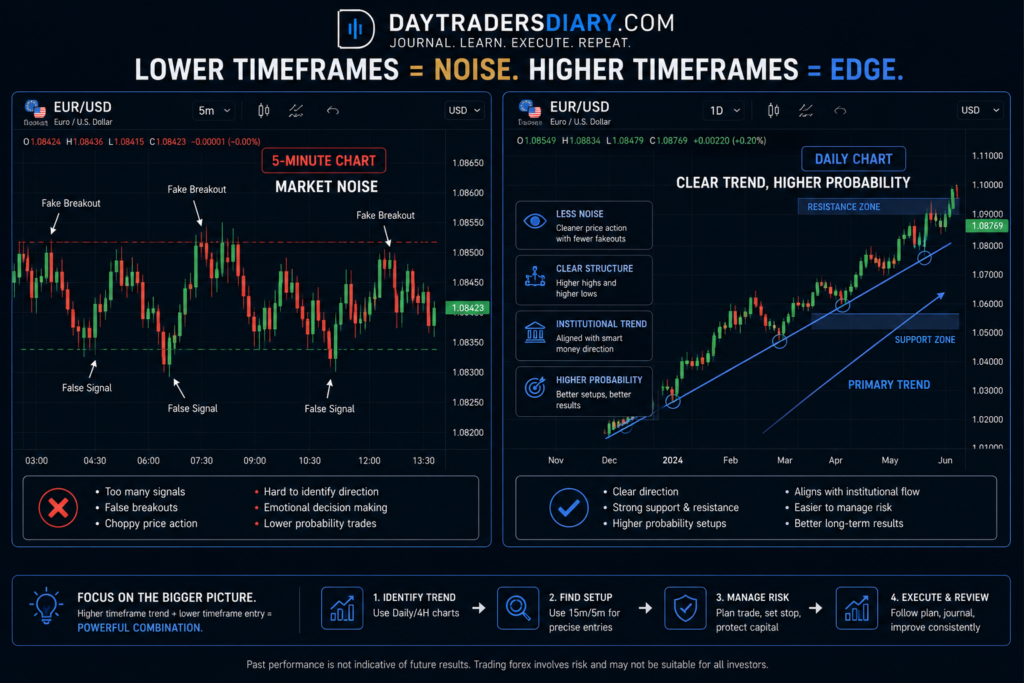
The Biggest Mistake Traders Make With Daily Charts
Many traders open the daily chart, identify the trend, and immediately switch to lower timeframes.
Then they forget everything they just learned.
Five minutes later, they’re trading against the higher timeframe because a short-term pattern appeared attractive.
Professional traders treat the daily chart as the foundation of every trading decision.
Lower timeframes simply refine execution.
The hierarchy matters.
A higher timeframe determines context.
Lower timeframe determines timing.
Reversing that process often creates inconsistency.
Build Your Daily Chart Before the Trading Session Begins
One habit shared by experienced traders is preparing before the market becomes active.
The daily chart should be reviewed before searching for intraday setups.
Every morning, ask yourself:
Has yesterday’s candle changed the market structure?
Did price break an important level?
Has volatility increased?
Is the market trending or consolidating?
What major levels deserve attention today?
This process takes only a few minutes but often prevents hours of poor decision-making.
If you’ve read our article on What Is the Daily Routine of Successful Day Traders, you’ll recognize that preparation consistently outperforms reaction.
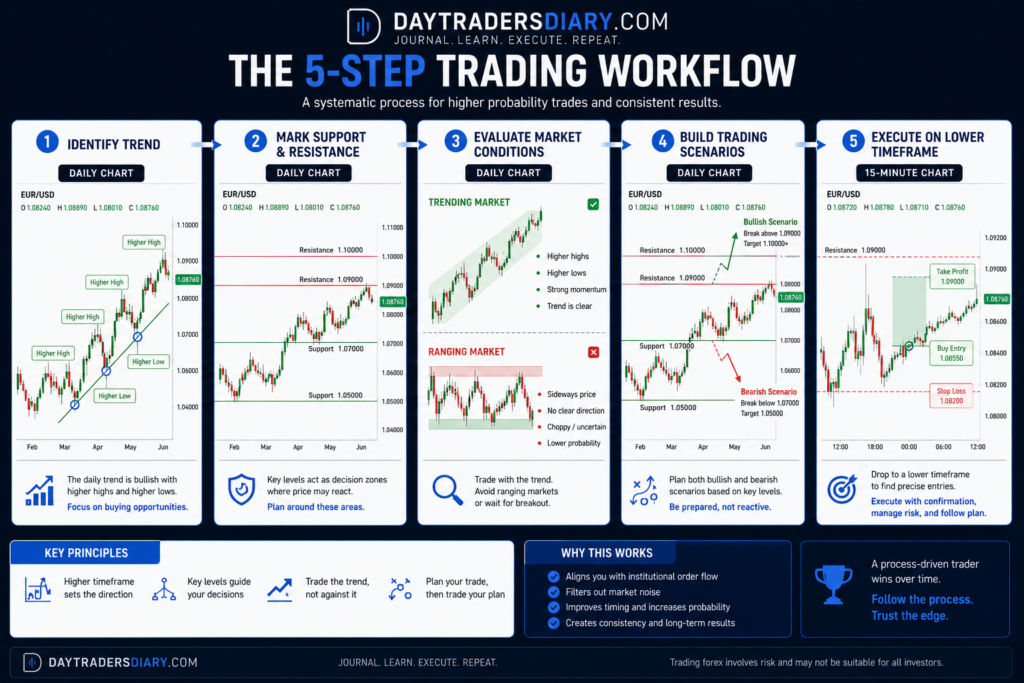
Step One: Identify the Primary Trend
The first objective is understanding market direction.
Forget indicators for a moment.
Study the price.
Is the market creating higher highs and higher lows?
Lower highs and lower lows?
Or neither?
This simple observation eliminates countless low-quality trades.
For example, if EUR/USD has produced a strong daily uptrend for several weeks, short positions require significantly stronger evidence than buying pullbacks.
Trading with higher-timeframe momentum often improves the probability before you even analyze an entry.
Step Two: Mark Major Support and Resistance
Daily charts show levels that matter.
Not because they’re magical.
Hedge funds and huge market players look at a lot of the same areas as institutional traders.
Focus on obvious swing highs.
Swing lows.
Major breakout points.
Previous weekly highs and lows.
These levels frequently influence price long after they first appear.
Many failed intraday trades occur because traders ignore significant daily support or resistance directly ahead of their entry.
Step Three: Evaluate Market Conditions
Before you arrange trades, find out what kind of market you are dealing with.
Is there a strong trend in price?
Is it being incorporated?
Did volatility just implode?
Are we waiting for big economic news?
Different market conditions require different strategies.
If the daily chart shows an extended range, breakout strategies may struggle.
Range-based strategies may become more appropriate.
This idea aligns with our guide on How to Trade Flat Markets, where adapting to market conditions is more important than forcing a single strategy into every environment.
Step Four: Build Intraday Scenarios
Professional traders don’t predict.
They prepare.
After reviewing the daily chart, create several possibilities.
If price pulls back toward daily support, look for bullish confirmation on lower timeframes.
If price breaks daily resistance, look for reversal opportunities.
If price breaches yesterday’s high with momentum strong then prepare for continuation.
See the difference.
There is no prediction.
Thinking forward.
That shift creates flexibility.
Step Five: Drop to Execution Timeframes
Only after completing higher timeframe analysis should you move to execution charts.
Many traders use the:
4-hour chart for intermediate structure.
1 hour chart for proof of setup.
Entries are taken from 15 minute or 5 minute charts.
The daily chart is the reference during the session.
Whenever you’re unsure, fall back on the daily structure.
It often provides clarity that lower timeframes cannot.
Why Fewer Indicators Often Produce Better Decisions
Many traders cover their daily charts with moving averages, oscillators, volatility bands, and custom indicators.
Eventually, the chart becomes difficult to interpret.
Professional traders often simplify.
Price.
Structure.
Support.
Resistance.
Volume when appropriate.
The objective is to understand market behavior.
Not creating more signals.
If you’ve already explored our guide on How to Use Price Action Only Trading, you’ll understand why experienced traders often rely on clean charts to identify higher-probability opportunities.
Daily Charts Reduce Emotional Trading
There is another benefit to greater time frame analysis that is often missed and that is psychological.
Daily charts update rather slowly.
That slower pace means fewer rash decisions.
When traders are watching every tick all the time, they begin executing rather than reacting.
Daily chart preparation creates patience.
It reminds traders of the larger picture.
That perspective often prevents unnecessary trades during quiet market conditions.
Risk Management Starts With the Daily Chart
Many stop-loss mistakes begin before traders enter the market.
Ignoring daily structure often results in placing stops directly inside areas where institutional liquidity naturally exists.
Professional traders use higher timeframe support and resistance to determine whether a trade offers sufficient room to develop.
Once the trade idea is validated, the Position Size Calculator ensures the position size matches the required stop-loss distance rather than forcing an arbitrary lot size.
This approach creates consistent risk across changing market conditions.
Review Your Daily Chart Analysis
One of the fastest ways to improve is reviewing your daily analysis after the trading session ends.
Ask yourself:
Did my daily bias prove accurate?
Did I trade with the higher timeframe trend?
Did I ignore important levels?
Did market conditions change during the session?
These observations become increasingly valuable over time.
The Trade Journal Template provides a structured way to record both your daily market analysis and the quality of your execution.
Eventually, you’ll discover patterns that improve every future trading session.
The Daily Chart Is a Decision Filter
The greatest value of the daily chart isn’t finding trades.
It’s avoiding the poor ones.
Many losing trades disappear before they’re ever placed simply because the higher timeframe contradicts them.
Professional traders understand that avoiding bad trades contributes just as much to profitability as finding good ones.
Sometimes your greatest edge is saying no.
Scaling a Structured Trading Process
Consistent higher timeframe analysis is one characteristic shared by many successful funded traders.
Evaluation programs reward discipline, preparation, and repeatable execution far more than aggressive trading.
Proprietary firms such as The5ers, FTMO, and FundedNext all expect traders to operate with structured risk management and clear market analysis.
Using the daily chart as the starting point of every trading session helps build the consistency these firms value.
If your journal demonstrates a disciplined approach to preparation, consistent execution and a high regard for the market structure on higher timeframes then an evaluation account with The5ers is a reasonable next step in your pursuit of trading more capital without necessarily increasing your own financial risk.
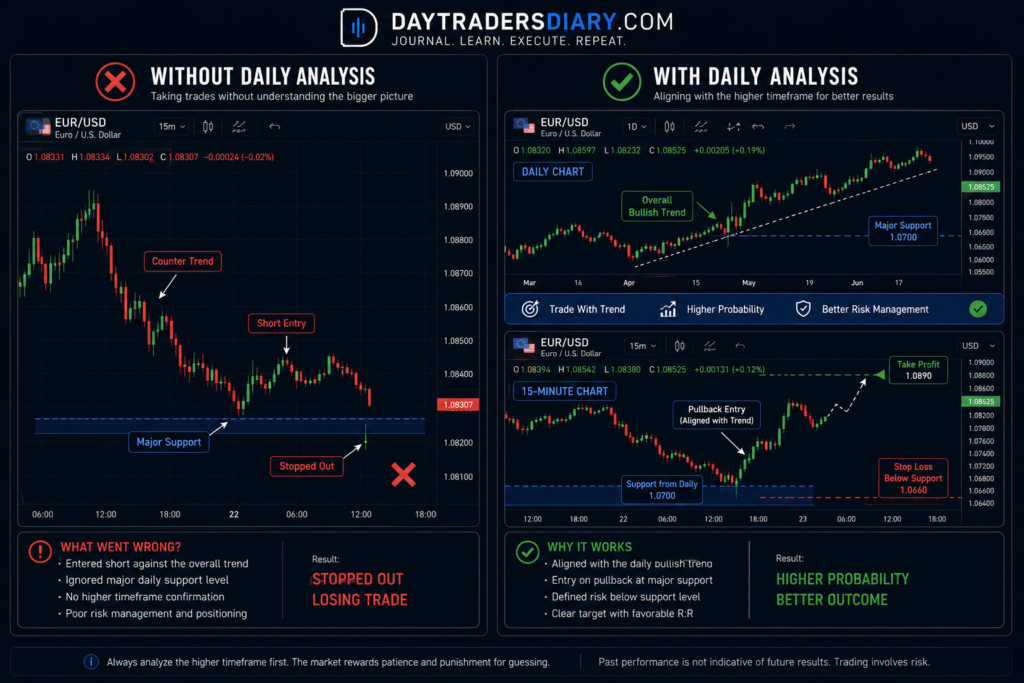
Final Thoughts
The daily chart won’t tell you exactly where the next candle will close.
It doesn’t need to.
Its job is to provide context.
Context improves decisions.
Better decisions improve execution.
Better execution produces better long-term results.
Tomorrow morning, before opening your favorite intraday chart, spend five minutes studying the daily timeframe.
Mark the trend.
Identify the key levels.
Build your scenarios.
Then let the lower timeframes do what they do best.
Help you execute a plan that already exists.
For your next read, explore our guide on How to Evaluate Your Day Trading Performance to learn how reviewing your daily decisions can steadily improve your long-term results.
Frequently Asked Questions
Why should day traders use daily charts?
Daily charts provide market context, reveal major support and resistance levels, identify long-term trends, and help traders avoid taking low-probability trades against the broader market direction.
What is the best daily chart setup for forex?
A good setup is a clear price chart with important support and resistance levels, trend analysis, market structure and moving down time frames for execution.
Which timeframe should I use after the daily chart?
Traders use 4-hour or 1-hour chart to confirm the setup and 15-minute or 5-minute chart to enter the trade, while using the daily chart as the main reference for the market.
Are daily charts useful for scalpers?
Yes. Even scalpers benefit from identifying higher timeframe trends and key price levels before executing trades on lower timeframes.
Should I use indicators on the daily chart?
Indicators can be useful, but many experienced traders prioritize price action, market structure, and major support and resistance levels to maintain a clear view of market conditions.
How do daily charts improve trading discipline?
Daily charts reduce market noise, encourage patience, and help traders focus on higher-probability opportunities instead of reacting emotionally to every short-term price movement.