
A breakout trader can get the entry almost perfectly right and still lose money because the target was wrong.
This happens constantly. Price breaks resistance, momentum accelerates, the trader enters with confidence, and then places a take-profit at an arbitrary 2R or at the next round number. Price reaches 1.6R, stalls at a previous high, reverses, and eventually stops the trade.
The trader says, “The breakout failed.”
Sometimes it did.
But sometimes the breakout worked exactly as expected. The mistake was expecting the price to travel through a target zone that was already showing evidence of opposing interest.
Determining breakout target zones in forex is therefore not simply about measuring the Height of a pattern. It is about identifying where the market has a reason to slow, react, consolidate, or continue.
That distinction can materially change how you manage a breakout.
What Is A Breakout Target Zone?
A breakout target zone is a price area where a trader expects the post-breakout move to encounter meaningful resistance, support, liquidity, or exhaustion.
Notice the word zone.
Experienced traders rarely need a target accurate to the last pip. Markets do not consistently respect single-price predictions.
A better approach is to identify an area where the probability of a reaction increases.
Fidelity’s technical-analysis material describes support and resistance as areas where supply and demand can influence price, and notes that broken support or resistance can reverse roles.
For a breakout trader, that creates an important framework.
The breakout level tells you where the market escaped.
The target zone tells you where the next meaningful obstacle may exist.
Those are two different pieces of information.
Why The Pattern Height Is Not Enough
One of the oldest breakout techniques is the measured move.
If EUR/USD forms a 20-pip range and breaks upward, the trader projects another 20 pips above the breakout.
It is simple.
It is also incomplete.
The measured move can give you a useful projection, but it does not know that there is a previous daily high 12 pips beyond your calculated target.
It does not know that the Asian session high is sitting directly in the path.
It does not know that the pair has already traveled most of its normal daily range.
This is why I treat the measured move as a candidate target, not the final answer.
Fidelity’s research glossary similarly describes target price ranges based on classic patterns as possible price movement rather than guaranteed outcomes.
That is the mindset you want.
A target is a planning area, not a promise.
Start With The Breakout Structure
Before projecting anything, define exactly what price broke.
Suppose EUR/USD spends two hours between 1.0840 and 1.0860.
The breakout takes place above 1.0860.
Range 20 points.
A simple measured target becomes:
1.0860 + 20 pips = 1.0880
That’s your initial projection.
But do not rush to set a take-profit at 1.0880.
Look left.
If 1.0876 to 1.0883 contains a previous swing high, your target is no longer simply 1.0880.
You now have a target zone around 1.0876 to 1.0883.
That is much more useful.
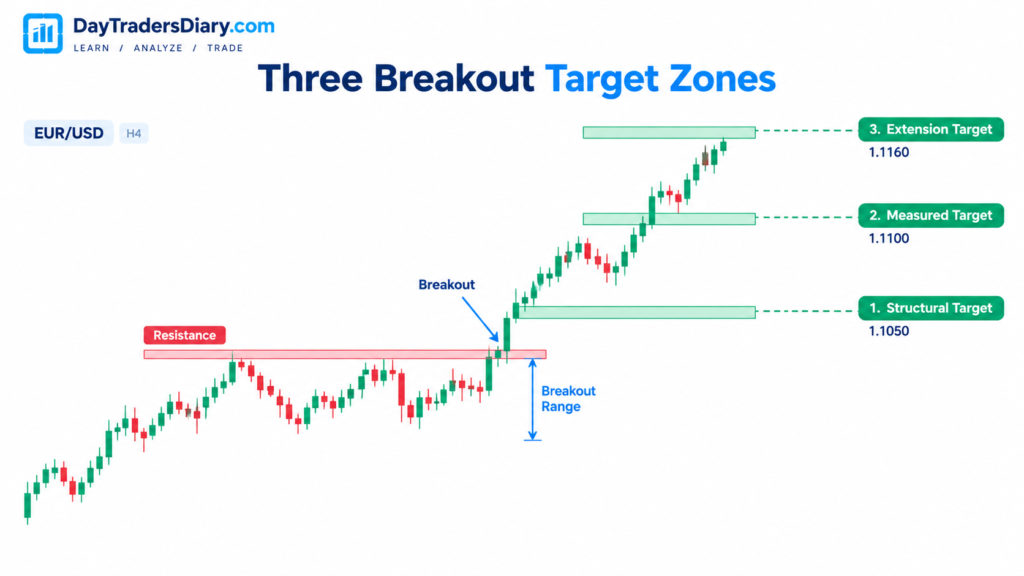
The Three-Target Framework
For active day trading, I prefer thinking about three potential target areas.
The first is the structural target.
This is the nearest obvious opposing level, such as a previous swing high, session high, daily high, or established resistance.
The second is the projected target.
This comes from the breakout range, measured move, volatility expansion, or another tested projection method.
The third is the extension target.
This is the area price that the market could reach if momentum continues beyond the initial objective.
The important part is that these three targets do not have to agree.
Suppose your breakout occurs at 1.0860.
The previous high is 1.0874.
Your measured move points to 1.0880.
Your extension projection points to 1.0892.
Now you have a map.
1.0874 is the first decision zone.
1.0880 is the measured target.
1.0892 is the extension.
Instead of asking, “Where should I put my TP?” you can ask:
What is the price likely to do as it approaches each zone?
That is a much better trading question.
Target Zones Should Be Wider Than Your Stop Precision
Common mistake: targets drawn as exact horizontal lines.
Resistance has reacted regularly in the zone between 1.0875 and 1.0882.
Too much precision is implied in saying 1.0878 is “the resistance level“.
The market has already shown you that the relevant area is wider.
Treat it as a zone.
This also changes trade management.
If your breakout reaches the lower edge of the target zone and momentum starts weakening, you have information.
You do not need to wait for the price to hit the exact center of the zone before recognizing the reaction.
Use Previous Highs And Lows Before Indicators
The strongest starting point for breakout target zones is often a visible price structure.
Look for the previous day’s high and low, Asian session extremes, London session high or low, recent intraday swing points, consolidation boundaries, and higher-timeframe support or resistance.
These areas matter because other traders may already be watching them.
Fidelity explains that technical analysts use support and resistance to interpret areas where buying and selling pressure may affect price.
For a day trader, the practical lesson is simple.
Before calculating a theoretical target, check whether the market already has a visible reason to react there.
Add The Measured Move
Now, calculate the breakout projection.
For a bullish range breakout:
Target = Breakout Price + Range Height
For a bearish breakout:
Target = Breakout Price − Range Height
Suppose GBP/USD forms a 35-pip consolidation.
The breakout occurs at 1.2700.
The basic bullish projection is:
1.2700 + 35 pips = 1.2735.
Now check the chart.
If the previous four-hour swing high sits at 1.2728, the measured target at 1.2735 may be too aggressive for a conservative first exit.
The structural zone comes first.
The measured move remains useful as an extension objective.
This is how you combine the two rather than allowing one formula to control the entire trade.
Volatility Changes Target Quality
A target also needs to make sense relative to current volatility.
Suppose GBP/USD normally travels 80 pips during the relevant session.
Your breakout target requires another 65 pips.
That is possible.
But if the pair has already traveled 75 pips before your entry, expecting another 65 pips requires a much stronger assumption than entering earlier in the session.
This is where a pip-based volatility filter becomes relevant.
A breakout target should not be evaluated independently from the amount of movement already consumed.
A target 30 pips away can be realistic early in a session and ambitious late in an already extended session.
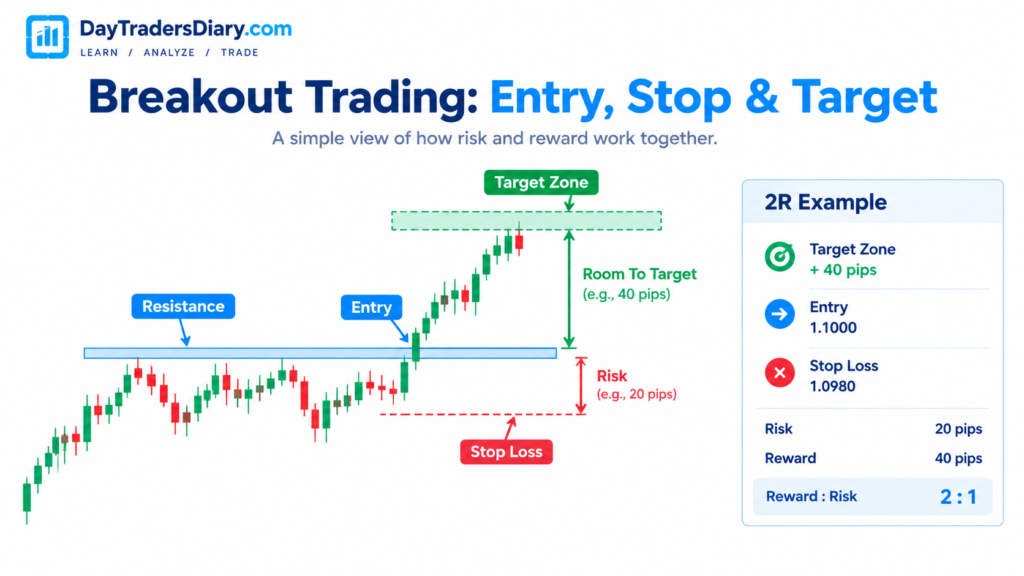
The Most Important Target Metric: Room To Target
I like to think about breakout quality in terms of the room.
Suppose your breakout entry is 1.1000.
Your structural stop is 10 pips.
Your first target zone begins at 1.1025.
You have 25 pips of room.
That gives you 2.5R before the first major obstacle.
Now imagine the same setup with resistance at 1.1012.
You have only 12 pips of room for a 10-pip risk.
The chart may still show a beautiful breakout.
But the trade has poor target geometry.
This is one reason a high-quality entry does not automatically create a high-quality trade.
The space between entry and opposition matters.
Do Not Ignore The Breakout Candle
The breakout candle itself contains useful information.
A large bullish candle closing near its high suggests stronger directional participation than a candle that briefly breaks resistance and closes back inside the range.
Your target framework should therefore consider how the breakout occurred.
A clean close beyond resistance with expanding volatility can justify looking toward the next structural zone.
A thin breakout with a long upper wick deserves more caution.
This is, of course, relevant to DayTradersDiary.com’s research on how to identify phony breakouts with a volume filter which suggests that instead of just labeling a trade as a win or loss, you should be documenting breakout range, relative volume, maximum extension, reclamation behavior and higher-timeframe context.
The target decision should use the same mindset.
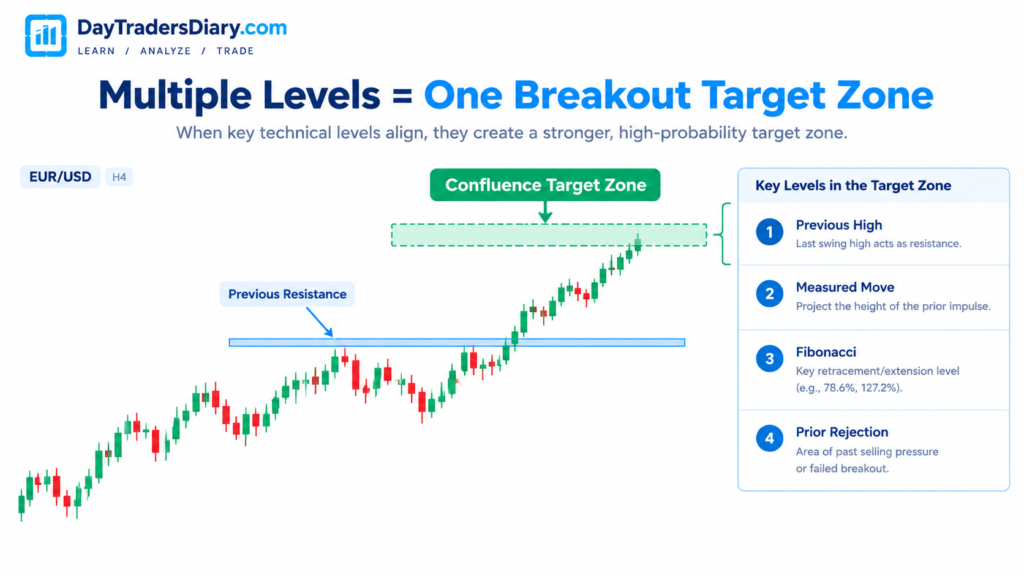
Build A Target Confluence Zone
The strongest target zones often have multiple reasons to exist.
Imagine EUR/USD has:
A previous daily high at 1.0910.
A measured breakout projection at 1.0914.
A Fibonacci extension around 1.0912.
A prior intraday rejection near 1.0908.
Instead of choosing one exact price, you have a confluence zone around 1.0908 to 1.0914.
That is a much stronger target area than any individual calculation.
Fibonacci tools are commonly used to create potential price objectives and support or resistance areas, although they should be combined with other analyses rather than treated as standalone forecasts.
Target Zones And Partial Profit Taking
There are several target zones, so it is easier to manage transaction.
You could take some partial profit at the first structural zone, hold another amount toward the measured projection and leave a tiny residual for an extension if momentum is still strong.
The exact percentages should come from your tested strategy.
The important point is that you are no longer forcing the entire position to reach the furthest possible target.
You are responding to the market’s demonstrated ability to continue.
This can also reduce a common psychological problem: watching a profitable breakout reach a logical resistance area, refusing to take anything because the trader wants the maximum move, and then giving the entire unrealized profit back.
When The Breakout Target Should Be Reduced
There are several situations where a calculated target deserves skepticism.
One is when the breakout occurs late in the trading session.
Another is when the market has already traveled an unusually large portion of its typical daily range.
Another is when a major higher-timeframe level sits between the entry and the projected target.
News is another.
A news-driven breakout can travel far beyond a normal projection, but it can also reverse violently.
Your target model should therefore distinguish ordinary expansion from event-driven movement.
Risk Comes Before The Target
Do not choose a target and then work backward to justify the stop.
The stop should be based on structural invalidation.
Then decide if the distance to the target area provides appropriate geometry for the deal.
For instance:
Price: 1.0860
Stop: 1.0848
Risk 12 pips
1.0884- 1.0889 First Target Zone:
Potential reward to the bottom edge: 24 pips
Initial reward-to-risk: 2R.
That is a more useful framework than simply deciding beforehand that every breakout must achieve 3R.
If the first meaningful target is only 1.2R away, forcing a 3R target may turn a realistic trade into an unrealistic one.
Position Size Must Adapt To The Stop
Breakout volatility can change the required structural stop.
That means position size may need to change as well.
If your stop increases from 10 pips to 16 pips, keeping the same lot size increases your monetary exposure.
This is where many traders miscalculate risk.
The DayTradersDiary.com Position Size Calculator can be used to calculate size from account risk and actual stop distance rather than forcing every breakout into the same position size.
Your target should never be used as an excuse to increase risk.
Journal The Target, Not Just The Result
Most traders record entry, stop, target, and profit.
That is not enough if you want to improve breakout targeting.
Log breakout range. First target zone. Measured target. Higher timeframe obstacle. Max favorable excursion. Actual exit & if price hit target zone before reversal.
Then ask a better question:
Where did the market actually tend to stall?
The downloadable DayTradersDiary.com Trade Journal Template can provide the base for this analysis.
After 50 or 100 breakout trades, you may discover that your theoretical 3R target is rarely reached, while your first structural zone is reached consistently.
That finding can change your entire management model.
Scaling An Edge Beyond Personal Capital
Once your breakout strategy has a demonstrated edge, capital becomes a separate problem.
The answer is not automatically increasing risk on your personal account.
Evaluation programs can provide a structured route for traders who already have a tested process and want to operate with larger account limits while accepting defined rules and drawdown constraints.
The5ers’ current High Stakes program is a two-step evaluation with published daily and maximum loss limits, and its current rules allow open positions to remain through news while restricting new order execution around high-impact news.
That difference is important to breakout traders.
If your strategy is jumping right in at big releases, the rules may impact whether or not the program suits your way.
If your technique is trading normal session breakouts and avoiding restricted news-entry periods, then the structure may be more compatible.
Other evaluation firms have different rules, so compare the actual drawdown, news, holding, consistency, and payout conditions rather than choosing based only on advertised account size.
If your data already demonstrates consistency, you can explore The5ers’ current evaluation programs and determine whether their rules fit your breakout methodology.
An evaluation should be viewed as a capital-allocation decision, not a shortcut around developing an edge.
FAQs
How do you determine breakout target zones in forex?
Look for structural resistance or support nearby. Compare with breakout range prediction, higher timeframe levels, volatility and prior session extremes. In fact, the best target zones generally have several of these qualities.
Is the measured move reliable for breakout targets?
It is useful as a projection, but it should not be treated as a guaranteed destination. A nearby structural level can be more relevant than the measured move.
Should breakout targets be exact prices or zones?
Zones are generally more practical because markets often react across an area rather than at one precise price.
What is the best first target for a breakout?
There is no universal target. The first meaningful opposing structure that provides adequate reward relative to your actual risk is often more useful than an arbitrary fixed-R target.
Should I use Fibonacci for breakout targets?
Fibonacci can provide additional target confluence, but it should normally be combined with market structure, volatility, and price behavior rather than used alone.
How does volatility affect breakout targets?
More volatility can drive prices to distant targets, but comes with more weariness and execution risk. It is particularly vital to know how much of the typical range for the session has already been utilized.
Final Thoughts
The biggest improvement you can make to breakout targeting is to stop asking, “How many pips should this breakout move?”
Ask instead:
Where is the next area where the market has a reason to react?
Then combine that answer with the measured range, volatility, session context, and actual risk.
A breakout entry gives you participation.
A properly defined target zone gives you a plan for what happens after participation.
For your next 30 breakout trades, record one additional number: the distance from entry to the first meaningful target zone.
Then compare it with your initial risk and with the actual maximum favorable excursion.
That single change can reveal whether your targets are genuinely aligned with the market or simply with your expectations.
For the next step, read How To Measure Entry Delay Risk in Forex. A breakout target can be perfectly calculated at the moment of the signal, but a delayed entry can quietly destroy the reward-to-risk structure you originally planned.