
One of the easiest ways to sabotage a good trading strategy is to use the same stop-loss Distance in every market session.
A trader might use a 15-pip stop on EUR/USD because it worked during London trading.
And then we go into the New York session.
Increased volatility.
The market starts printing larger candles and deeper pullbacks.
The trader takes the same setup, puts on the same 15-pip stop in the same relative location, and is stopped out.
Five minutes later, the price moves exactly where the trader expected.
The immediate conclusion is usually:
“The setup failed.”
Sometimes it did.
But sometimes the setup didn’t have enough room to withstand the normal movement during that session.
That distinction matters.
A stop-loss is not supposed to be an arbitrary distance from your entry. It is supposed to sit beyond the price behavior that would disprove your trade idea.
The problem is that the amount of normal price behavior changes throughout the trading day.
The London open is not quite like the late New York open.
New York’s first hour is not the same as the middle of the Asian session.
The post-news market is not a tranquil pre-session range.
So why should your Stop be identical?
This is the basis of a session-specific stop-loss strategy.
We are not trying to widen stops in volatile sessions and narrow them in quiet sessions just because volatility altered.
The aim is to see how much leeway the market usually gives in each session, place the Stop order behind meaningful invalidation and then size the position such the monetary risk is managed.
That is a much more professional way to go about it. Why Fixed Stops Create Hidden Problems
Fixed-pip stops look attractive because they simplify trading.
EUR/USD gets 15 pips.
GBP/USD gets 20 pips.
Gold gets 50 points.
The problem is that the price does not move according to your preferred number.
A 15-pip move can be a major event in one environment and ordinary noise in another.
Imagine EUR/USD is trading during a quiet Asian session.
The market has been trading within a tight range for 30 minutes.
A 12 pip halt beyond the recent swing could be quite acceptable.
Compare now with the first hour of London.
This very pair is creating larger candles, sweeping local highs and lows, and moving quickly between liquidity zones.
That same 12-pip Stop may sit directly inside normal session noise.
The trade idea has not necessarily become worse.
Your Stop has become less compatible with the environment.
This is one of the most important ideas in stop-loss design:
A stop should be based on the behavior required to invalidate your thesis, not the number of pips you happen to prefer.
What a Session-Specific Stop Actually Means
A session-specific stop-loss approach is one where you tailor the stop-loss placement process to the statistical and structural features of the trading session.
What you are not saying:
London always needs a 20 pip stop.
That would merely be replacing one set of rules with another one.
But you are rather asking:
“How much movement is normal for this setup for this session? And where does my trade idea become structurally invalid?
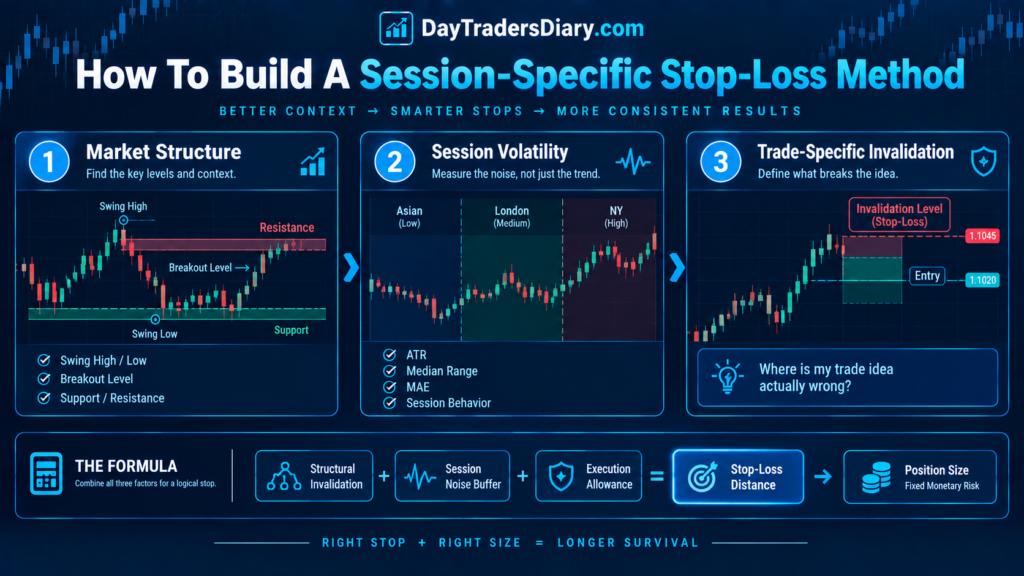
That usually requires three layers of information.
The first is market structure.
The second is session volatility.
The third is trade-specific invalidation.
Structure tells you where the idea fails.
Volatility tells you how much ordinary movement can occur before that failure.
The trade particular context will tell you if the set up is having enough room and reward for the eventual Stop to be worth taking.
This combination is much more powerful than just using ATR.
The Research Behind Session-Specific Risk
Session based stop placement makes sense for more than just glancing at the charts.
This is because the intraday FX behavior has been well studied and it has been shown time and again that volatility and trading activity are not evenly spread throughout the day.
Takatoshi Ito and Yuko Hashimoto, in an NBER investigation employing electronic brokerage data, revealed that USD/JPY and EUR/USD had different patterns of intraday seasonality in activity and volatility. The investigation showed different patterns around trading hours in Tokyo and London and linkages between trading activity, volatility and bid-ask spreads.
For a day trader, this has a direct practical implication.
If the typical range of price movement changes throughout the day, then the Distance required to avoid ordinary market noise can change too.
That does not mean volatility should mechanically dictate your Stop.
It means volatility should influence how much breathing room your structure may require.
The Bank for International Settlements has also highlighted the importance of London and New York in global FX liquidity. Its research notes that liquidity is typically highest around the London open and during the London-New York overlap.
Again, this is not to say “Trade London as liquidity is high.”
The better conclusion is a valuable one:
Your stop technique needs to account for the variations in execution and movement contexts across different sessions.
In addition, CME Group’s risk-management guidance adds the complementing point that stops should be placed at sensible levels, not random distances. That position size should be scaled for the stop placement and the capital being risked.
That is the exact philosophy needed for a session-specific stop.
Stop Location Comes Before Position Size
This is where many traders get the process backward.
They decide:
“I want to risk $100.”
Then they decide:
I want a 15 pip stop.
Then they figure out how big the lot is.
That sounds disciplined, yet the first two decisions were random.
A more elegant sequence is:
What is the arrangement?
Specify the non-validity range of the setup.
Account for normal session volatility.
Determine the stop distance.
Then calculate the position size required to keep the monetary risk within your limit.
CME’s position-sizing guidance follows the same basic logic. The logical Stop comes first, followed by position sizing based on account risk.
This is a really significant principle to keep in mind when you go from one session to another.
The Stop could get broader.
That doesn’t mean your risk should automatically increase.
Position size should be scaled down.
The Three-Layer Stop Model
You can make a working three-layer stop for a certain session.
Our initial layer is the structural perimeter.
And this is where your first thesis fails.
In a positive pullback it may be below the swing low that made the setup.
For breakout, it can be under breakout structure or failed acceptance zone.
For a trend continuation entry it might be below the last significant higher bottom.
The second layer is the session noise buffer.
This accounts for the amount of movement that can occur without actually invalidating the setup.
The third layer is the execution buffer.
This accounts for spread, slippage, and the possibility that the exact trigger price is not the exact price at which your order is filled.
The worst place you want to be is where the transaction is uncomfortable, not where the basis of the trade is fundamentally incorrect.
Why Session Volatility Changes Stop Requirements
Consider two EUR/USD trades.
Both are upward pullbacks.
They both have the same structural low swing.
Quiet session : Entry to swing low distance = 9 pips.
The Distance is 15 pips during a volatile session.
The second trade is not always worse in terms of risk management.
It simply requires a larger structural stop.
If you force the second trade into a 9-pip stop, you may place the Stop inside ordinary price fluctuation.
This is exactly why a fixed stop can produce a misleading sequence of losses.
The trader sees:
Entry.
Stop-out.
Immediate reversal.
They think the market hit their Stop.
Sometimes there is no mystery.
The Stop was too close to the environment.
Use ATR, But Do Not Let ATR Make the Decision
ATR is useful because it gives you a way to normalize volatility.
But using a rule such as:
“Stop = 1 ATR”
For every setup and every session, it is still too mechanical.
Suppose EUR/USD has a 5-minute ATR of 8 pips.
A 1 ATR stop gives you 8 pips.
But what if the structural invalidation level is 14 pips away?
Your ATR rule is now forcing the Stop into the structure.
That is backward.
ATR should help you answer:
“How much movement is normal?”
Structure should help you answer:
“What’s wrong with my plan?”
Your Stop has to respect both.”
The value of ATR lies in its application with support and resistance, and DayTradersDiary.com has a good tutorial on this. ATR makes much more sense when applied to actual market structure than when used as a stop generator.
Build a Volatility Profile for Each Session
Don’t guess at how much space each session takes up, measure it.
Let’s say you are trading EUR/USD on a 5 minute chart.
Collect statistics for London, New York and Asian sessions separately.
Measure the average 5-minute range.
Then measure the median range.
Then measure the upper percentile, such as the 75th or 80th percentile.
You may discover something like this:
Asian session median 5-minute range: 4 pips.
London session median: 7 pips.
New York session median: 9 pips.
Those numbers are only illustrative.
Your own market will produce its own distribution.
The important point is that you now have evidence.
If your setup normally requires the price to move 1.5 times the median 5-minute range before the structure is invalidated, you can begin designing a more realistic stop framework.
You are no longer saying:
“I think London needs a wider stop.”
You say: “
My data shows that regular London movement is considerably bigger therefore my stop mechanism must adjust for it.
That is a tremendous upgrade in thinking.
Median Volatility Is Often More Useful Than Average Volatility
This is a subtle point.
A few enormous candles can distort the average range.
Suppose most 5-minute candles during your session range between 5 and 9 pips.
Then one big news candle moves 60 pips.
The average increases many times.
But the average is not an average of regular trading conditions any longer.”
The median gives a more consistent image of what a typical movement looks like.
Percentiles can also be used.
For example you can find that 75% of your London-session 5 minute candles have a range under 11 pips.
That’s a good point of comparison for you.
It doesn’t tell you where to put your Stop.
It describes what regular movement is.
Then your structural level completes the analysis.
The Session-Specific Stop Formula
Here is a relevant conceptual framework:
Stop Distance = Structural Invalidation Distance + Session Noise Buffer + Execution Allowance
The most significant is the structural component.
The session noise component protects the trade against normal variation.
The allowance for genuine fills recognizes that real fills are imperfect.
Don’t take this as a universal mathematical formula that every trader should add certain pips.
The components should be based on your own market data. For example, your London breakout approach may demonstrate that price often retraces to the breakout level by 0.3 to 0.5 times the recent 5-minute ATR before continuing.
That behavior can inform your buffer.
The New York strategy may yield deeper retests.
That discrepancy should be factored into the stop methodology.
Stop-Loss Design Should Follow the Setup Type
Session-specific does not mean session-only.
The setup still counts.
A London breakout stop does not have to be based on the same logic as a London pullback stop.
Look for a breakout.
The market breaks out of resistance and retests the level.
A logical stop could be below the retest low.
Now consider a trend pullback.
The Stop may need to sit beyond the swing structure that defines the pullback.
Now consider a mean-reversion trade.
The Stop may need to sit beyond the extreme that invalidates the reversion thesis.
Predicted changes in the noise level of the session.
The way it’s set up tells you what matters.
This distinction implies you can’t just do a simple “London stop” or “NewYork stop”
The Best Stop Is Not the Tightest Stop
This is one of the most damaging beliefs in day trading.
Traders often think a tight stop is automatically safer.
It is not.
A tight stop reduces the amount of capital lost if triggered.
But if it is placed inside normal price movement, it can increase the probability of being stopped before the trade has a chance to work.
The correct question is not:
“How can I make my stop smaller?”
It is:
“What is the smallest stop that remains beyond meaningful invalidation?”
That is a completely different question.
Sometimes the answer is 8 pips.
Sometimes it is 20.
Sometimes the trade is not viable at all because the structurally correct Stop makes the reward-to-risk relationship unattractive.
That outcome is important.
A session-specific stop method should sometimes tell you not to trade.
Example: London Pullback
London is pushing EUR/USD higher, let’s say.
The price breaches a resistance level at 1.0800.
It goes to 1.0820 and then retraces.
The new support area is approximately 1.0805.
You buy at 1.0810.
Current pullback low is 1.0803.
A naïve trader might place a 5 pip stop-loss order because it limits risk.
Still London volatility informs us that pullbacks are normally 8-10 pips before they carry on.
A better structural stop might sit around 1.0799.
Now the Stop is wider.
That does not mean you should risk more.
If you normally risk $100, reduce the position size so that the larger Stop still represents approximately $100 in risk.
The market has more room to run.
Your account doesn’t.
This is one of the most important elements of session-specific stop-loss trading.
Example: New York Expansion
Now imagine the same EUR/USD strategy during the early New York session.
The London collection has already arrived.
US statistics due.
The market is moving more quickly.
You see a continuation setup bullish.
The structural Stop is 14 pips distant.
Maybe you have 9 pips in your regular London configuration.
Instead of driving the trade into a 9 pip stop you consider if the wider Stop still has adequate expected reward.
Perhaps if the projected aim is 35 pips.
If the aim is merely 17 pips expected then the trade may not be asymmetrical enough any more.
That is an important outcome.
Volatility can turn a technically valid setup into a mathematically unattractive trade.
The Session Should Affect Your Stop, Not Your Risk Percentage
This distinction deserves emphasis.
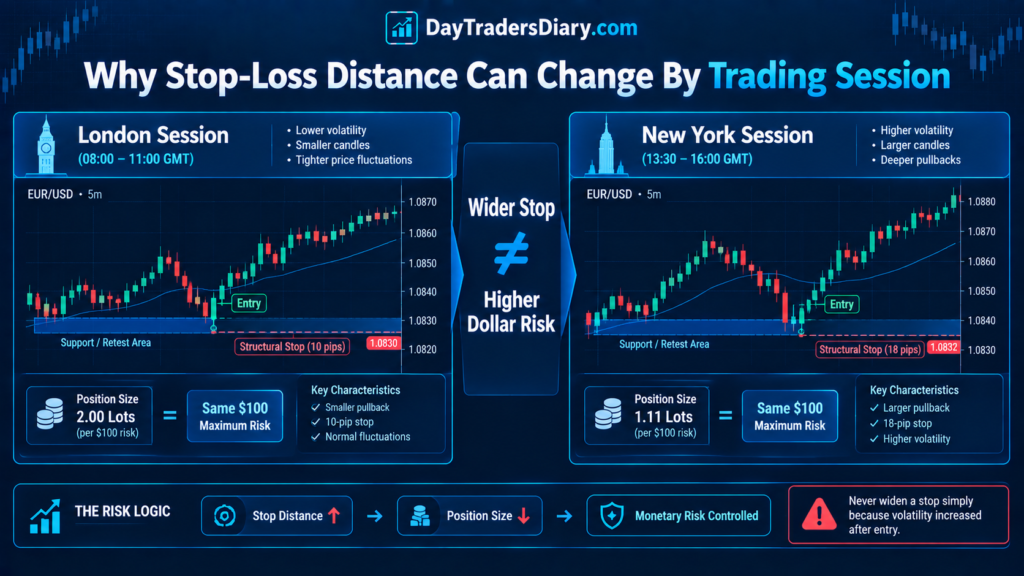
Suppose you risk 0.5% per trade.
Your London setup requires a 10-pip stop.
Your New York setup requires an 18-pip stop.
You do not automatically increase the risk to 0.9% because the Stop is wider.
You reduce position size.
The monetary risk is still at 0.5%.
This provides a steady risk framework and allows the stopping distance to change.
CME’s risk management documentation stresses that exposure should be limited via position size and rational stops, not trading the greatest size possible.
This is where the Position Size Calculator becomes particularly useful.
The calculator should not tell you where your Stop belongs.
Your market analysis should do that.
The calculator tells you how much you can trade once the Stop has been determined.
Build a Stop Multiplier From Data
This is a more advanced way.
Measure how far price tends to go against winning trades before moving on instead of a fixed distance to exit at.
This is your MAE, max adverse excursion.
Suppose you collect 100 winning London breakout trades.
You discover that the median MAE is 4 pips.
The 75th percentile is 8 pips.
The 90th percentile is 12 pips.
That tells you much more than saying:
“London usually needs a 10-pip stop.”
You can now ask:
If I place my Stop beyond 8 pips of adverse movement, how many historically successful trades would I preserve?
And what happens to expectancy if I move the Stop to 12 pips?
That is how a session-specific stop becomes a research problem instead of a chart preference.
MAE Can Expose Bad Stop Placement
Suppose your strategy has a 55% win rate using a 10-pip stop.
You review your losing trades.
Many losses are 8 or 9 pips against you before reversing.
This indicates the Stop is too close.
But there is a great trap.
You can’t just open up the Stop and think the strategy is better.
You need to test how position size, reward to risk ratio, win rate and expectancy changes.
A wider stop can reduce stop-outs while also reducing the amount of profit available relative to risk.
The answer comes from the distribution of outcomes.
That is why your stop methodology should be tested in R, not simply judged by the number of trades that survived.
Session-Specific Stops and Breakouts
Breakout traders often require a very careful stop tactic.
A breakout can be a temporary expansion and then a retest.
If you place your Stop right behind the breakout candle, you might be putting your stop inside the precise retest behavior that your method is looking for.
This is one reason your work on false breakouts and volume filters fits so well with session-specific stops.
You want to determine if the level actually failed or if the price is simply testing liquidity at that level.
A breakout strategy may therefore require a stop beyond the structure that defines failed acceptance, rather than simply below the entry candle.
The session determines how much noise may occur around that level.
Session-Specific Stops and Entry Delay
There is another variable traders often overlook.
Your Stop may have been correct when the setup appeared.
It may become inappropriate if you enter late.
Imagine your signal appears at 9:05.
The structural Stop is 10 pips away.
You hesitate.
At 9:20, the price has moved significantly.
You enter at a worse price.
Now the same structural Stop is 18 pips away.
Your reward has fallen.
Your risk distance has expanded.
The trade you are taking is no longer the trade you tested.
This is closely related to measuring the risk of entry delay in forex.
A session-specific stop method should therefore record both signal time and actual entry time.
Otherwise, you may incorrectly blame the Stop for a problem caused by delayed execution.
Do Not Use the Same Stop During Pre-News and Post-News Conditions
This is one of the easiest adjustments to make.
Suppose your strategy normally trades the New York session.
A major US economic release is scheduled for 8:30 New York time.
The market may compress before the release.
The release can then produce an abrupt expansion.
The five minutes after the discharge can act significantly differently from the five minutes before it.
Applying the one-stop rule in both situations does not make much sense.
Or you can leave the event window out of your plan and have an independently validated post-news arrangement.
The DayTradersDiary.com guide to measuring news volatility before you trade is important here as it treats event-driven volatility as a measurable movement in market conditions, rather than just another calendar tag.
A Better Session Stop Framework
Rather of classifying sessions, I would identify behavioral phases during the trading day.
Think about this:
Light squeeze.
Extended opening session.
Movement direction set.
Decline in mid-session.
Expansion spurred by news.
After the news things settled down.
– Reduce late session liquidity.
It’s more useful than just saying “London stop” or “New York stop.”
Why is that?
Because the conditions can be radically different during the same session.
London can begin with explosive expansion and later become a mature trend.
New York can open quietly and then explode after the economic data.
The Stop has to react to actions.
Watches give perspective.
Markets motivate people to act.
The Stop Should Be Tested Against Normal Excursions
Before choosing a stop strategy, ask yourself a simple question:
How frequently does the market go this far against my set up before it works?
This is one of the best daytrader questions.
Your Stop may be too tight if 35% of your eventual winners first go 9 to 12 pips against you.
If your Stop is 20 pips and nearly all successful trades begin moving in your direction within 5 pips, you may be giving the trade unnecessary room.
Neither conclusion can be reached from one or two trades.
You need a sample.
Stop-Loss Efficiency
You can also evaluate your Stop using a simple metric:
Stop-Loss Efficiency = Median MAE of Winners ÷ Stop Distance
Suppose your Stop is 12 pips and the median MAE of winning trades is 6.
Your ratio is 0.50.
The average successful trade uses half the stop distance before moving positively.
Now, suppose your Stop is 8 pips.
The ratio becomes 0.75.
That may mean you are operating closer to the edge of normal adverse movement.
Again, this is not a universal benchmark.
It is a diagnostic tool.
The real question is how changing the Stop changes expectancy.
The Psychology of Getting Stopped Before the Move
Repeatedly tight pauses do psychological damage.
You go in.
Markets block you.
Prices change.
See the original setup work without You.
After three or four repetitions, your brain begins to anticipate the Stop.
You hesitate on the next trade.
Now the problem is no longer just the Stop.
It has become a confidence problem.
You start moving stops farther away.
Then you take larger losses.
Then you become afraid of taking the next trade.
This is how poor stop design can create a psychological feedback loop.
The solution is not motivational.
It is statistical.
You need evidence showing how much adverse movement is normal for your setup during the specific market condition.
Once you know that, you can place the Stop with less emotional interference.
The Stop Should Never Be Moved Just Because the Session Changed
There is another mistake on the opposite side.
A trader enters London with a 10-pip stop.
New York opens.
Volatility rises.
The trader thinks:
I better widen my stop. New York’s more turbulent.
That is not necessarily the case.
Once you’re in the trade, the initial invalidation logic still holds.
A session-specific method is primarily an entry and risk-design framework.
It should not become an excuse to move stops farther away after the trade starts losing.
If the market invalidates your thesis, exit.
If volatility changes but structure still valid then handle according to pre-defined rule.
Don’t improvise because the chart is unpleasant.
Session-Specific Stops and Position Sizing
The relationship can be written:
Position Size = Max $ Risk / $ Risk per Unit at the Stop
The larger the stop, the smaller the position size, assuming you’re risking the maximum amount.
This sounds obvious.
Yet it is one of the most frequently violated principles in active trading.
A trader gets a wider stop.
They keep the same lot size.
The trade now carries significantly more monetary risk.
That is not adaptation.
That is uncontrolled exposure.
DayTradersDiary.com’s Position Size Calculator is useful because it forces the calculation to use the actual stop distance rather than mechanically applying the same lot size.
Your Stop Method Should Include a No-Trade Zone
Sometimes the structurally correct Stop is too wide.
Imagine your strategy normally targets 30 pips.
The session is highly volatile.
The structural Stop is 24 pips away.
The return is not worth the risk after accounting for spread and execution fees.
You have two options.
Force the transaction with a bad reward to risk ratio.
Forget it.
The second decision is usually superior.
This is one of the most important benefits of session-specific risk analysis.
It does not merely tell you where to put the Stop.
It can tell you when the trade itself is no longer economically attractive.
Journaling Your Stop-Loss Method
For a session specific stop mechanism your journal needs more than entry and exit.
Save the session.
Save market status
Say what kind of setup.
Measure the distance to the first stop.
Record the session ATR or range measurement
Record the level of invalidation structure.
MAE record.
Record MFE.
Note if the deal would have survived a larger halt.
Then write down the resulting multiple of $R$.
Then compare the distributions.
You may find that your London pullbacks perform best with stops around the 70th percentile of historical MAE.
Your New York breakouts may require a different profile.
Your late-session trades may perform poorly regardless of stop size.
That last finding is important.
Sometimes the problem is not the Stop.
It is the session.
The Trade Journal Template can provide the structure for tracking these variables and turning individual trades into a larger dataset.
Do Not Optimize the Stop Using Win Rate Alone
Suppose you test three stops.
A 10-pip stop produces a 48% win rate.
A 15-pip stop produces a 55% win rate.
A 20-pip stop produces a 61% win rate.
The obvious conclusion might be:
“Use the 20-pip stop.”
But that could be completely wrong.
The wider Stop may reduce the average reward relative to risk.
It may increase the average loss.
It may reduce position size.
It may affect the number of trades that reach the target.
You need expectancy.
A simplified expectancy formula is:
Expectancy = (Win Rate × Average Win) − (Loss Rate × Average Loss)
Then evaluate the results separately by session.
The best Stop is not necessarily the one producing the highest win rate.
It is the one that produces the strongest risk-adjusted performance after realistic execution.
Use Walk-Forward Testing
Once you discover a promising session-specific stop relationship, do not immediately assume it will continue forever.
Markets change.
Changes to session behavior.
Volatility regimes change.
You shift your strategies.
Try the stop methodology on one historical time period.
Then try again another time.
Then, test again in real or virtual situations.
This is especially true in the case of volatility based measures, since a period of abnormally high volatility might make a stop rule appear to be more resilient than it actually is.
Your day trading backtesting framework is a good start for this approach.
The objective is not to find the perfect Stop.
It is to find a stop methodology that remains reasonably effective across different market conditions.
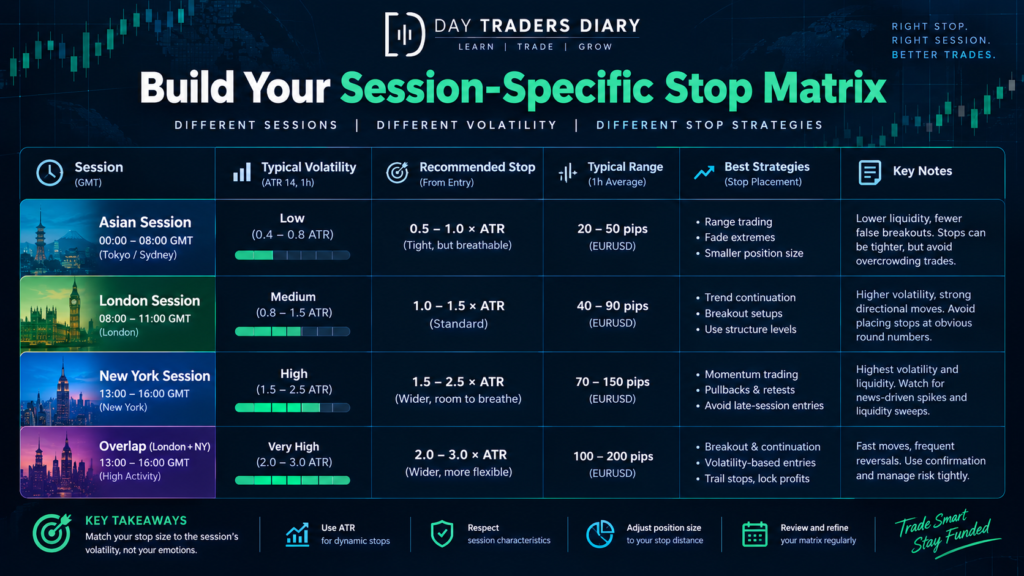
The Session Stop Matrix
A useful practical tool is to create a session stop matrix.
For each session or market state, record the median MAE of your setup, the 75th percentile MAE, the median ATR, the average target distance and the resulting expectation.
As time goes on the matrix becomes a decision framework.
London continuation trades with the Stop outside the 75th percentile MAE may work.
The criterion for New York breakouts varies.
Asian range trades rely on modest mean-reversion moves, thus structural invalidation may need to be tighter.
The aim is not to establish dozens of intricate rules.
The idea is to see where the real boundaries of your strategy are.
A Simple Daily Routine
What’s your market outlook before the start of the session?
“Compare to your regular session baseline for current volatility.”
If there is a set-up, first identify the level of structural invalidation.
Compare the required Bad move to stop normally for that setup and session.
Calculate the position size from your fixed monetary risk.
Then ask whether the resulting Stop and target still produce an acceptable expectancy.
If they do, execute.
If they do not, pass.
After the trade, record what happened.
That routine is simple enough to do while you’re under pressure.
Well, that’s something.
Complex systems that can’t be followed consistently are less useful than simple systems you can truly follow.
Scaling the Method With Larger Capital
There is an interesting connection between session-specific stops and capital growth.
As account size increases, execution discipline becomes more important, not less.
A 5-pip difference in stop distance may seem insignificant on a small account.
With larger position sizes, the same difference can represent a meaningful amount of money.
This is why traders who eventually pursue larger capital allocations need to understand their risk process more deeply.
Capital does not repair poor stop placement.
It magnifies the consequences.
An evaluation program makes sense only once a trader has already demonstrated a repeatable process.
The5ers is one example of this route. Its current High Stakes offering is structured as a two-step evaluation with unlimited time, three profitable trading days, and published maximum loss parameters. Its current New version lists a 10% Phase 1 target and 5% Phase 2 target, with a 5% daily loss limit and 10% maximum loss.
The important point is not that an evaluation creates an edge.
It does not.
The value is that a trader with a validated process can pursue greater capital without simply increasing personal account exposure.
Other firms, such as FTMO and a host of futures-focused evaluation providers, have distinct regulations and drawdown structures. Therefore, the right judgment should be weighed against your actual trading strategy.
If your strategy requires wider stops during volatile periods, you need to understand how an evaluation calculates daily and maximum drawdown.
If your strategy trades around news, you need to understand the firm’s news-related execution rules.
If your approach relies on holding positions over session borders, overnight policies are important.
That’s why the professional way is to validate your trading method first, and then choose capital based on the process.
After testing and journaling your session-specific stop mechanism, consider a The5ers evaluation as a next step toward scaling, rather than using funds as a shortcut.
Frequently Asked Questions
What is a session-specific stop-loss?
Session-specific stop-loss is a way of placing a stop that considers volatility, liquidity, market structure and normal price action of the trading session, instead of one predetermined stop distance for the day.
Should the stop-loss size change between London and New York?
It can. It shouldn’t change because the clock changed. If your data indicates that the setup has different adverse movement or volatility in different sessions then the Stop may require to change. Then change position size so monetary risk stays under control.
Is ATR good for setting stop-losses?
ATR is a good volatility measure but is not a good measure of market structure. A better way would be to utilize ATR or other volatility measure to assess normal movement and set the actual Stop beyond the structural level that would invalidate the trade.
Should I use the same Stop for every trading session?
Normally no, if your method trades markets with fundamentally differing volatility conditions. A fixed stop might be oversized in quiet periods and undersized during active periods. The best is to evaluate the stop behavior separately by session and setup.
Does a wider stop mean a higher risk?
Not necessarily. The larger the stop , the further away in price . You can trade position size so that the dollar risk is the same . Risk is a function of stop distance and position size.
How do I know if my Stop is too tight?
Review the MAE of your winning trades. If a large percentage of successful trades regularly move beyond your stop distance before eventually reaching the target, your Stop may be inside normal adverse movement.
How much should I add as a volatility buffer?
There is not one number. Your buffer should be based on your historical data. Measure the typical unfavorable movement of winning trades throughout the session and setup in question and then try different stop locations to see how expectation changes.
Should I widen my Stop after entering a trade?
Not just because the trade goes against you or volatility increases. You need to set your Stop depending on pre-defined invalidation logic. Without an established rule, moving it further away generally changes original risk profile.
Can session-specific stops improve win rate?
They can but winning rate shouldn’t be the major aim. A wider stop increases the amount of transactions that survive normal noise but decreases reward-to-risk. Check expectation, MAE, MFE, average win and average loss.
What is the best stop-loss method for day trading?
There are no “best” methods. A strong method is to combine structural invalidation with session specific volatility, then tweak position size to maintain consistent monetary risk.
Final Thoughts
The biggest mistake with stop-loss placement is treating the Stop as a number.
It is not.
It is a statement.
It says:
“If price reaches this area, my original trade thesis is no longer valid.”
That statement needs to make sense in the environment where you are trading.
A 10-pip stop may be perfectly logical during one market state and completely irrational during another.
The answer is not to keep widening stops until trades survive.
The trick is to learn how your setup generally behaves, how it varies between sessions, and where the market truly proves you incorrect.
For your next 30 trades, change one thing.
Record your session, setup type, stop distance, MAE, MFE, and result in R.
Don’t adjust your strategy yet.
Just gather the data.
Then divide London, New York, Asian and other appropriate trading windows.
Watch the point where your stops cease to protect the transaction from actual invalidation and start protecting it from everyday noise.
That border beats a standard “10-pip stop” rule by a mile.
And when you know it, position sizing becomes easier, execution becomes more regular, and the emotional experience of getting stopped out becomes lot less odd.
Your next read should be “How To Use Session Heatmaps For Entry Timing,” The same session data that informs you when your setup is at its best opportunity will also tell you how much breathing room that setup generally needs.