
One of the easiest ways to misuse volume in forex is to look at a large-volume bar and immediately conclude that a large amount of money has just entered the market.
That conclusion is usually inaccurate.
Most retail FX systems don’t show centralized transaction volume as volume on a regular FX chart. Usually, it is tick volume, i.e., the number of price changes or quote updates that occur during a given period.
That sounds like a technicality.
That’s consideraThat’sre necessary for an active day trader.
You can misunderstand breakouts, liquidity, session transitions, news reactions, and even the quality of your entries if you treat tick volume as actual traded volume.
But if you use tick volume effectively, it can be a remarkably excellent proxy for liquidity.
Not an exact measurement.
Not a direct measure of sales numbers.
Distraction.
And therein is the real worth.
The practical question, therefore, is not:
Does high tick volume equal high liquidity?
A more important question:
What does an abnormal high or low market activity tell me about the market conditions in which I am trying to execute?
That is the framework we shall construct here.”
What Is Tick Volume?
Tick volume measures the number of price updates you receive over a given period.
For instance, on MetaTrader, the software differentiates between tick volume and real trading volume. For Forex symbols, the volume indicator displays the number of price movements in the given period. Actual traded volume may be available for exchange-traded instruments.
Suppose a five-minute EUR/USD candle has a tick volume of 850.
That does not mean 850 lots were traded.
It means the feed received a large number of price changes during those five minutes.
Now consider another five-minute candle with a tick volume of 220.
That tells you that the market was much less active from the perspective of that particular feed.
That difference can still be useful.
Why?
Active markets tend to generate more quote updates, more price negotiation, more short-term movement, and more interaction between buyers and sellers.
But there is an important catch.
Tick volume is feed-dependent.
Your broker receives quotes from its liquidity providers or pricing network. Another broker may receive a somewhat different stream of quotes.
So two traders can look at EUR/USD at 10:00 precisely and see different tick volume readings.
This is why tick volume should normally be considered as a relative indicator of activity, rather than an absolute measure of liquidity.
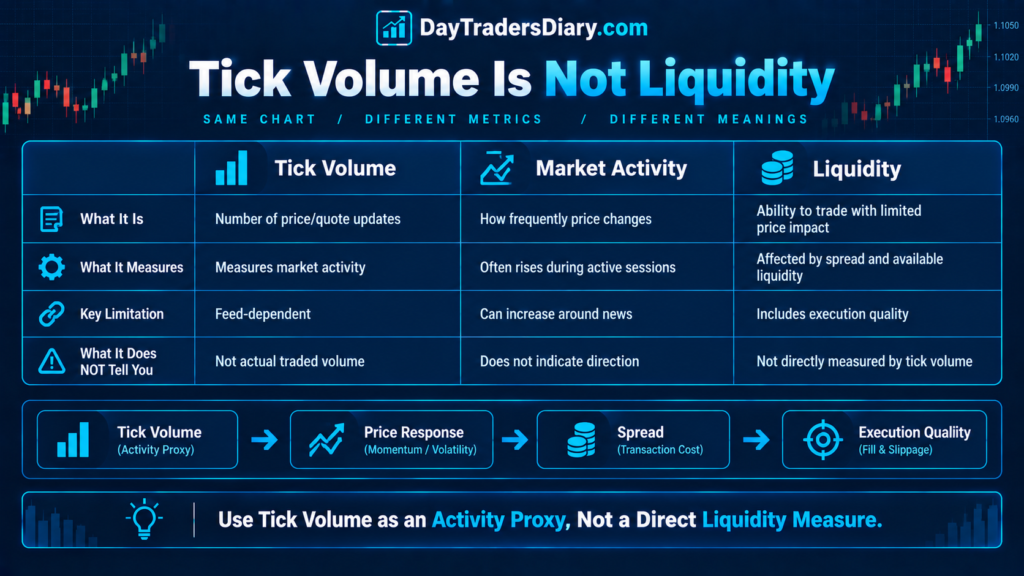
Tick Volume Is Not Liquidity
This is probably the most important distinction in the entire article.
Liquidity is not simply “how much activity is happening”.
“A liquid market is one where you can transact with relatively limited price impact.
This includes such things as spread, liquidity available, order flow, execution quality, and how much the price moves as a consequence of trades.
CME studies particularly effectively illustrate this. It was discovered that order-book depth alone can give a false sense of liquidity and calls for looking at indicators such as price effect, trading activity, and fill quality in conjunction. During the April 2025 volatility episode, E-mini S&P 500 futures volume increased dramatically, even as displayed order-book depth declined substantially.
That creates an important lesson for forex traders.
A high tick-volume bar does not automatically mean:
“Liquidity is excellent.”
“It means:
“Market activity is elevated.
You then need to determine what that activity is doing to execution.
Is the spread tight?
Is the Price moving efficiently?
Are candles becoming wider?
Is the Price absorbing orders without excessive movement?
Is the market moving several pips for relatively little time?
Those questions tell you much more about actual liquidity conditions.
Why Tick Volume Can Still Be Useful
Why bother if tick volume is not equal to transaction volume?
You do not need precise measurements to obtain valuable information.
You need a consistent measurement that helps distinguish one market condition from another.
Imagine EUR/USD typically produces around 400 tick updates over a given five-minute period.
Today you see:
220
380
420
460
1,050
1,240
The numbers are not the point.
What’s changed is.
Clearly, the market has moved from relatively normal activity to abnormal activity.
That change is important.
Perhaps London has just opened up.
Participants from New York might have been attracted by the economic release that beat expectations.
A breakout might have tempted short-term traders.
Hard may charge liquidity providers.
Quantity of Ticks does not equal Quality of Ticks.
The Right Mental Model: Tick Volume Measures Market Activity
The market’s sick volume is the lifeblood of quote activity.
You’re not measuring the money that came in.
You are measuring the frequency of market changes.
Low tick volume often accompanies periods of price inactivity.
High tick volume tells you the market is updating more frequently.
Neither condition is automatically bullish or bearish.
Neither is automatically liquid nor illiquid.
The same high tick volume can appear in two completely different situations.
Scenario One: High Activity, Good Execution
EUR/USD is coming into the London session
Ticks with volume spikes.
The spread is still narrow.
Price continues to batter away at his opponents.
Candles reach up. Price does not go back and forth and forth and forth.
It would be a good expansion.
Scenario Two: High Activity, Poor Execution
A major economic release hits.
Tick volume explodes.
Spread is out.
Price moves aggressively in both directions.
The first candle is a big range.
Your order is a few pips from where you anticipated it to be.
This is really active.
It may also be poor execution.
Calling both situations “high liquidity” implies that, because tick volume is high, doing so would be a mistake.
The Three-Layer Tick Volume Framework
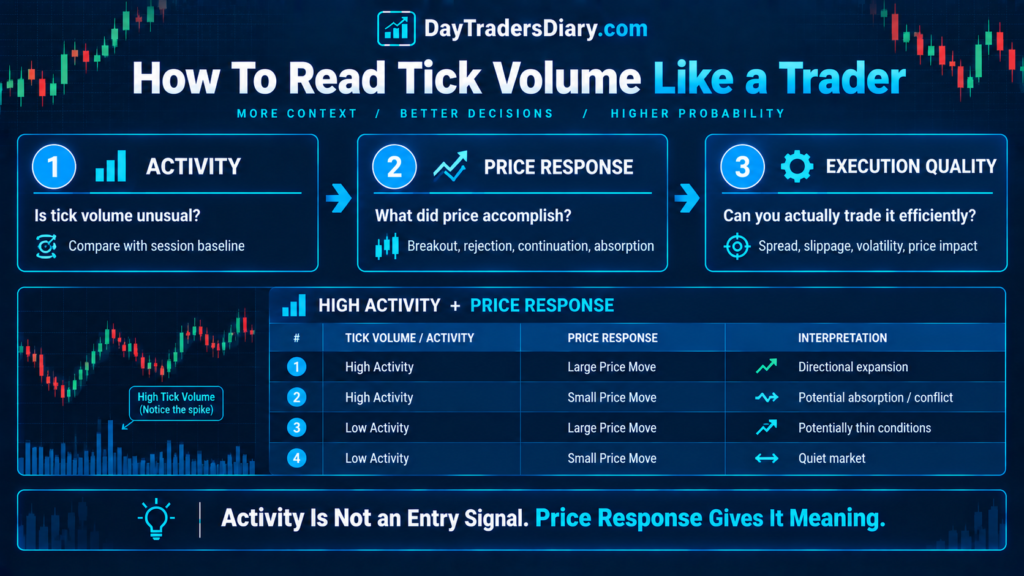
I prefer to read tick volume through three layers.
The one layer is active.
How unusual is the tick volume compared with its recent baseline?
Layer two is price response.
What did Price actually accomplish while that activity occurred?
Layer three is execution quality.
What happened to spreads, slippage, and price impact?
This provides a far more useful interpretation.
You could imagine it like this:
Execution Quality Price Response Tick Volume
That process avoids one of the most common pitfalls in volume analysis – confusing activity with directional information without checking what Price did with that activity.
Build a Relative Tick Volume Baseline
Never look at raw tick volume and say 1000 is high.
High compared to what?
That’s a good question.
For example, EUR/USD may be regularly printing 1,000 ticks during a bustling London session but only 250 during a calm Asian session.
So 1,000 isn’t a high number everywhere.
A preferable technique is to compare the present tick volume to a relevant historical baseline.
A simple relative metric of tick volume is:
Relative Tick Volume = Current Tick Volume / Average Tick Volume
Suppose your current five-minute candle has 900 ticks.
The average of the five most recent comparable five-minute candles is 450.
Your relative tick volume is:
900 ÷ 450 = 2.0
The current activity is approximately twice the baseline.
That is much more informative than saying:
“Volume is 900.”
“See Median Instead of Only Average
There is another improvement I strongly recommend.
Do not automatically use a simple average.
News spikes can dramatically divert the average. Now, let us say your equivalent five-minute tick volumes are:
350, 390, 410, 430, 450, 470, 2200
The 2200 reading can skew the average, and make regular activity look like less than it is.
A median or percentile baseline is stronger.
For example, you might compare the current tick volume to:
the median of the last 20 comparable periods
or
the 75th percentile
or
the 90th percentile.
Now you can classify activity more meaningfully.
For example:
Below 50th percentile = quiet
50th to 75th = normal
75th to 90th = elevated
Above 90th = exceptional
These thresholds are not general guidelines for trading.
They are a framework to test your own market.
The Session Problem
Tick volume becomes particularly interesting when you analyze it by session.
FX activity is not evenly distributed throughout the day.
Research using high-frequency FX data has documented significant intraday patterns in trading activity and volatility. Federal Reserve research using EBS data found distinct regional patterns in FX trading activity and volatility. In contrast, BIS research continues to show the highly decentralized and fragmented nature of modern FX execution.
For the day trader, this means the same tick-volume reading can have different meanings depending on when it occurs.
Suppose EUR/USD normally produces 700 ticks during your London window.
A reading of 1,000 is elevated.
During a quiet period, you might have a reading of 250. Several 700 would indicate a substantial surge in activity.
A session-specific baseline is therefore superior to a universal volume threshold.
The same concept comes in handy when generating a session heatmap. Rather than treating the trading day as a single, uniform environment, time, volatility, market conditions, and execution quality can be combined to inform entry timing. Your existing DayTradersDiary guide on session heatmaps gives you an idea of how to do this.
Tick Volume and the Spread Tell Different Stories
This is where tick volume becomes much more useful.
Imagine tick volume rises.
You might initially think:
“Liquidity is increasing.”
“How do we check the spread.
If tick volume rises while the spread stays stable or narrows, the market may be experiencing greater activity without a major deterioration in execution on conditions.
That is interesting.
Now imagine tick volume rises while the spread suddenly expands.
The interpretation is different.
Execution may be worsening, yet the market is busy.
This distinction is especially relevant in the case of big news.
A trader who only looks at tick volume can detect a big rise and think:
“Excellent. Lots of liquidity.”
“Trader watching tick volume and spread might see:
“Activity is extreme, but the cost of immediate execution has increased.”
Those are completely different trading decisions.
If you want a deeper explanation of why this matters, the DayTradersDiary guide on what a forex spread is and why it matters provides the execution-cost side of the equation.
Tick Volume and Price Range
Now add a third variable.
Price range.
Suppose two candles both have a relative tick volume of 2.0.
Candle A moves only 3 pips.
Candle B moves 18 pips.
The activity level is similar relative to baseline.
The price response is not.
This difference can tell you something about the market’s ability to absorb activity.
You can create a simple concept:
Price Response per Tick = Price Range ÷ Tick Volume
You should not treat this as a precise measure of institutional liquidity.
It is a diagnostic measure.
If tick volume is rising rapidly but price range remains contained, the market may be absorbing a substantial amount of activity without much displacement.
If tick volume is rising and the price range is expanding dramatically, the market is moving more aggressively relative to the amount of quote activity.
That distinction becomes particularly useful around breakouts.
High Tick Volume With Small Price Movement
It is one of the most intriguing scenarios to study.’
Just imagine:
Tick volume: very big
Candle range: rather narrow
Close: near the middle of the candle
Spread: stable
What happened?
There was a lot of market activity, but the Price did not travel very far.
That can indicate substantial two-way interaction or absorption.
It does not tell you exactly who is absorbing whom.
You cannot conclude from tick volume alone that institutions are buying.
That is one of the places where retail volume analysis becomes storytelling.
But take it as a hint.
There is a lot of activity, but the Price is not moving much, which suggests we need to watch the relationship between activity and price movement.
Now see what happens next.
If a breakout occurs from that region and it stays there, the prior high-activity zone might become critical.
If Price does not leave it, the market may be rotating.
It’s not so much the activity itself as the response afterward.
High Tick Volume With Large Price Movement
Now consider the opposite.
Tick volume is extremely high.
The candle range is also extremely large.
Price near the top.
Spread is controlled.
This blend is unique.
High activity, strong directional displacement.
This could be a signal to a breakout trader that the market is breaking away conclusively.
But again, don’t go straight from:
Big volume of ticks for buy signal.
The more pertinent question is:
“What about Price in relation to the important level?”A high-volume candle that briefly penetrates resistance and is soon pulled back inside the range is significantly less informative than a breakout of resistance with high activity, a powerful close, and extended acceptance above the level.
This is a good fit for the DayTradersDiary concept of detecting phony breakouts by using a volume filter.
Volume alone does not confirm the breakout.
It does. Price reaction.
Tick Volume and Breakout Quality
Here is a practical four-condition breakout framework.
Now visualize resistance at 1.0850.
Price reaches the level.
You see high tick volume relative.
Ask four questions now.
Did activity increase before the breakout?
If yes, participation or quote activity was already increasing.
Did Price actually break the level?
A tick-volume spike below resistance is not a breakout.
Did the price close and remain beyond the level?
This separates penetration from acceptance.
Did activity remain supportive after the breakout?
If the tick volume immediately falls off and the price swings back through the level, then the breakout should be regarded as suspicious.
This produces a sequence:
Activity –> Break –> Acceptance –> Follow through. Far more effective than “Buy -> High volume.”
Tick Volume and Fake Breakouts
This is particularly important when tick volume increases during an attempted breakout and Price can’t find substantial acceptance.
For example:
Resistance: 1.0850
Price trades to: 1.0862
Tick volume: 2.5 times normal
Close: 1.0846
The market was highly active.
But the Price does not maintain the breakout.
That is valuable information.
The high activity did not result in successful acceptance over resistance.
This can be more informative than a low-volume breakout that drifts through the level.
The trader’s question changes from:
“Was volume high?”
“What did high activity accomplish?”
That is a professional way to think about volume.
The Tick Volume Liquidity Score
You can formalize this without creating an overly complicated indicator.
I like using four components:
Volume of ticks in proportion to
Normal Distribution
Standard Vs Price
Price Impact or Slippage. Each of them can be classified as low, moderate, high, or excessive.
Eg, For example:
High activity + typical spread + narrow range
Maybe a decent environment to run it in?
“High activity + expanding spread + extreme range”
Possible execution stress.
little activity + tight spread + tiny range
“Quiet market, can be bad for momentum strategy.
Low activity + widening spread
Fine circumstances require extra care.
Do you see what this framework does?
You don’t see tick volume as a standalone liquidity indicator.
It does not attempt to rely on tick volume, it merely uses tick volume as one input to a more general execution method.
A More Useful Liquidity Proxy: Tick Volume Relative to Price Impact
If you want to take this analysis further, compare the activity with the amount of price movement it produces.
Suppose two five-minute periods each have:
Relative tick volume = 2.0
But:
Period A moves 5 pips.
Period B moves 20 pips.
The second period has generated much more price displacement for similar relative activity.
That can indicate a very different liquidity environment.
CME’s liquidity research employs a similar fundamental idea: liquidity should be measured by the relationship between trading activity and price impact, rather than by CME’s volume or depth measures.
For retail traders, the lesson is simple.
Don’t simply ask:
How busy was the market?
Also ask:
How much did the price move as a consequence of that activity?
A lot of times, the valuable information is in that second question.
Tick Volume Can Help Detect Session Transitions
One of th best practical uses of tick volume is detecting when the market is transitioning between activity regimes.
Imagine a quiet pre-London environment.
Tick volume remains below its normal session baseline.
Then there is a series of candles with increasing relative tick volume.
Price begins expanding as well.
That transition can be more important than the absolute volume reading.
What you’re witnessing is the market transitioning from one regime of participation to another.
The same thing can happen around the New York Open.
You are not predicting direction.
You are recognizing that the conditions under which your strategy operates have changed.
That can affect:
entry timing
stop placement
expected movement
spread sensitivity
profit targets
position size
This is missed by a trader who treats every 5-min candle as the same.
Do Not Confuse Activity With Tradability
This is one of the most expensive misunderstandings.
A market can be extremely active and difficult to trade.
News is the obvious example.
Imagine tick volume jumps to four times normal.
Price is moving rapidly.
The spread expands.
Slippage increases.
Your intended entry becomes difficult to obtain.
This is not necessarily a better trading environment.
It is simply a more active one.
In fact, the fastest markets can create the largest gap between the theoretical setup on your chart and the trade you actually receive.
BIS 2025: The 2025 BIS evaluation of the FX market highlighted increased turnover and solid liquidity in several categories despite more volatility. This result is useful since it suggests that volume, volatility, and liquidity are related, but not identical.
That is the distinction you want to carry into live trading.
Tick Volume Around News
News deserves its own framework.
Suppose your normal five-minute tick volume is 500.
A major announcement is produced:
1100
then:
2400
then:
1700
You might call this a volume spike.
But you should also record:
spread before release
maximum spread
candle range
slippage
maximum adverse excursion
time required for spread normalization
direction of the first move
direction of the second move
This turns a vague “news was volatile” observation into actual data.
Your existing guide on quantifying news volatility before entry provides a useful framework for separating normal volatility from” vent-driven volatility.
Powerful combination.
Changes in tick volume indicate activity.
Reasons for change are in the news database.
Spread and execution data indicate whether trading was feasible.
Tick Volume and Scalping
Scalpers need to be especially careful.
If your target is only a few pips away, execution costs are a bigger fraction of potential gain.
Let’s say you want 8 pips.
A one pip spread eats into 12.5% of the gross target.
If the spread is 3 pips, 37.5% of the objective is eaten up before slippage or commission occurs.
Now, assume that the tick volume is really high.
That doesn’t help much on its own.
You want to see if the rise in activity is due to improved execution or just a faster price shift.
And that’s why tick volume should be paired with spread-to-target analysis.
Tick Volume and Pullback Trading
There are different ways that pullback traders might employ tick volume.
Assume a robust bull run happens with high activity.
Then the price retraces.
During the pullback, tick volume is very low.
The Price returns to the prior breakout zone and begins to level out.
Then the volume expands again as the price swings upward.
This sequence can be more intriguing than just watching a large volume spike.
You are watching:
Expansion
Contraction
Test
Re-expansion
That is a market process.
It gives context to the price action.
The important part is that you are not assuming the contraction means sellers have disappeared.
You are asking whether the activity and price behavior are consistent with a controlled retracement.
Tick Volume and Trend Continuation
Imagine EUR/USD is trending higher.
Each impulsive move produces elevated tick volume.
Pullbacks are less active.
Then the activity picks up again as Price prices the trend.
It generates a beat which is repeated.
High expansion activity.
Lower activity in retracement.
More action on the continue.
That is potentially useful evidence.
Now compare it with:
High activity on the initial move.
High activity during the pullback.
High activity during the attempted continuation.
Price fails to make new highs.
That suggests a different narrative.
The market remains lively, but directional movement is weakening.
This is where the context tool known as tick volume really comes into play.
A Critical Warning: Broker Dependency
In spot FX, tick volume is not centralized.
What this means is that you should not create a strategy based on absolute tick-volume numbers that are assumed to work the same way for all brokers.
If Broker A reports 1200 ticks, and Broker B reports 900 ticks, it does not necessarily suggest that Broker A had a higher level of real trading volume.
The feeds are different.
A more robust approach is to normalize the data within the same feed.
For example:
Current tick volume ÷ median tick volume for comparable historical periods.
That produces a relative measurement.
Relative measures travel better than absolute numbers.
Can Tick Volume Be Compared Across Brokers?
You get the broad patterns, but watch for the particular cut-offs.
If there is a big spike in activity across both streams at the London open, the directional timing of that action could be beneficial.
But, if one broker has a threshold of 1500 ticks and another has 900, don’t assume that those criteria are interchangeable.
Use the baseline of all feeds.
This is particularly crucial if you are doing backtesting on one data source and execution on another.
The indicator may look similar.
The numerical values may not be.
Tick Volume Versus Real Volume
If you trade exchange-traded futures, actual volume is available and generally preferable when your objective is to measure executed contracts.
CME says futures volume reflects the volume of contracts bought and sold and can be useful for traders in identifying levels and periods of increased market participation.
That doesn’t render tick volume irrelevant in FX.
It just means you should know what each dataset measures.
For spot FX, the market is very decentralized.
There is no single central exchange which records all spot transactions.
According to the BIS, today’s FX market is split across multiple venues, and much of the trading is not accessible in a single market view.
So the argument should not be:
“Tick volume is fake.”
“The better argument is:
“Tick volume measures something different from centralized transaction volume.”
“That makes it useful when used for the right purpose.”
A Practical Tick Volume Trading Routine
Set your baseline activity before the session begins.
Please use the same time window as the previous 20 or 30 comparable sessions.
Then classify the current surroundings as calm, normal, high or outstanding.
Don’t open the market for exchange, because the tick volume grows.
See instead what Price costs.
If it is escalated and Price breaks the framework, is the break accepted?
If activity is rising and Price is moving, check for absorption or two-way interaction.
When the activity is picking up and the spreads are widening, then the market is busy but possibly expensive to trade.
Make sure the sequence fits your tested setup. If activity tightens on a pullback and then expands on continuation.
So tick volume is a decision-making assist not a signal generator.
The Five Questions I Would Ask Before Trading a Tick-Volume Spike
When you see an unusually large tick-volume bar, ask:
Is the activity unusual for this exact session and timeframe?
If not, it may simply be normal market behavior.
What did Price accomplish?
Large movement, small movement, rejection, acceptance, or no meaningful progress?
What happened to the spread?
Stable, narrowing, or widening?
Is the activity occurring at a meaningful price location?
A volume spike in the middle of nowhere is less informative than one occurring at a major structural level.
What happened immediately afterward?
To continue absorption, reversal, or consolidation?
The final question is frequently the most useful.
“It’s the reaction to activity that says more than the activity itself.
Tick Volume at Support and Resistance
Let’s say EUR/USD crosses a daily resistance zone.
Suddenly, the tick volume is 2.3 times the regular market level.
Price breaks resistance by 6 pips.
Then closes back under.
The activity is a sign that something went on at the level.
But it does not confirm a breakout.
The failure to hold above the resistance is the important information.
Now imagine the same initial spike occurs: price breaks above resistance, retests it, tick volume contracts during the retest, and then activity expands as Price moves higher.
That is a different sequence.
The level has transitioned from resistance to potential support.
The value of tick volume is therefore contextual.
It helps you observe the effort around a level.
Price tells you the result.
That effort-versus-result distinction is one of the most useful ways to avoid simplistic interpretations of volume.
A Simple Effort-to-Result Framework
Think of tick volume as effort.
Think of price displacement as a result.
Then compare the two of them.
Big result + high effort
There may be a high directional participation.
High effort + low result
Possible absorption, conflict, or ineffective movement.
Big results with little effort
Potentially thin conditions or a market that is moving easily through limited resistance.
Low effort + small result
Quiet conditions.
None of these combinations is automatically bullish or bearish.
But each describes a different market environment.
This paradigm can be particularly helpful in determining if a breakout should be taken at its value or viewed with caution.
Risk Management: Tick Volume Should Change Your Expectations, Not Your Discipline
Using a volume rise to take a greater risk is a common mistake.
The trader notes:
High tick count.
Good candle.
Get out.
Confidence grows.
Expand position.
That’s not true.
If tick volume indicates an expanding activity regime, your expected price movement may be larger.
That can mean your structurally valid stop needs more room.
If your stop becomes wider, your position size may need to decrease to maintain the same monetary risk.
This is exactly where a Position Size Calculator becomes useful.
The calculator should answer:
“How large can I trade while keeping the risk fixed?”
“t should not answer:
“How large can I trade because this candle looks convincing?”
“That difference protects you from turnin” better information into worse risk management.
Tick Volume Can Help With Stop Placement
Suppose you normally trade a 10-pip stop.
During a quiet market, that may be reasonable.
Then the activity expands.
Tick volume jumps.
Price ranges become larger.
Your previous 10-pip stop now falls within the market’s normal movement.
You have two choices.
Use the same stop and accept a higher probability of normal-market stop-outs.
Or use a structurally valid wider stop and reduce the size.
Usually, the second approach is more rational if the setting remains interesting.
This is part of the reason why you should supplement your tick-volume analysis with volatility analysis, not replace it.
Tick volume indicates that activity has shifted.
ATR and market structure help determine how much room price actually needs.
Tick Volume and Entry Delay
There is yet another minor link.
A trader observes a spike in tick volume and pauses.
Price Action.
The trader waits for confirmation.
Price moves again.
Finally, the trader enters.
Now the original setup may have deteriorated.
This is exactly the kind of situation where your entry-delay analysis becomes useful.
Your post on DayTradersDiary on how to gauge the risk of an entry delay in forex is a good example of comparing price delay with the initial risk distance, rather than just determining delay in seconds.
This is significant because high tick-volume environments are usually where a few seconds may matter much more economically.
A five-second delay during a quiet market may be irrelevant.
A five-second delay during a high-activity breakout can consume a meaningful part of your original risk-to-reward structure.
The Psychology of Tick Volume
The tick volume can have a harmful psychological impact.
It gives the market a sense of importance.
A big volume bar shows up.
The trader has a feeling that something big is about to happen.
Which has a sense of urgency.
Entries are made urgently.
Entries are made of mistakes.
The volume bar did not move the trade.
Your reading did.”
One of the most effective psychological guidelines in this context is:
Activity is not an order.
A spike says concentrate.
It doesn’t tell you to purchase or sell.
That seems straightforward enough.
When the Price fluctuates swiftly you it becomes tough, and you believe that you are seeing a chance disappear.
Professional execution requires the ability to observe a high-information event without automatically participating in it.
Sometimes the best response to a tick-volume spike is to wait for the next candle.
Use Tick Volume to Reduce Overtrading
The same tool that creates FOMO can also reduce it.
Suppose your data shows that your strategy performs poorly when tick volume is below the 20th percentile.
Instead of forcing trades during dead periods, you can wait.
Now, tick volume becomes a participation filter.
You are not saying:
Low with volume means no trades.
You are saying:
My specific strategy has historically produced poor expectancy under this combination of low activity, low volatility, and weak price movement.
That is a much stricter rule.
How To Journal Tick Volume
If you want tick volume to become a genuine trading edge, journal it.
Do not just record whether the volume was “high.”
Create a normalized measure.
For example:
Current tick volume
Median comparable tick volume
Relative tick volume
Session
Setup type
Market state
Spread
Candle range
ATR
Entry price
Stop distance
MAE
MFE
Result in R
Then add one particularly useful field:
What did the activity accomplish?
You can classify it as:
Breakout accepted
Breakout rejected
Trend continuation
Absorption
Range expansion
Range failure
News reaction
No meaningful result
That field forces you to interpret volume through price behavior rather than letting the indicator create a story for you.
Build a Tick Volume Database
After 20 trades, you have observations.
After 50, you have something worth reviewing.
After 100 or more, you may begin seeing recurring relationships.
For each setup, compare:
Low relative tick volume
Normal relative tick volume
Elevated relative tick volume
Extreme relative tick volume
Then calculate the expectancy for each category.
You might discover something surprising.
Perhaps your breakout technique works best at 1.5 to 2.5 times the regular level of activity.
When spreads and slippage are more than 3.0 times average, they can impair performance.
Your retreat approach may play out differently.
Perhaps pullbacks perform best when the impulse has high activity, but the retracement occurs on declining activity.
That is a real trading insight.
It is specific to your method.
Track MAE and MFE
Two metrics are especially useful here.
Maximum Adverse Excursion tells you how far a trade moved against you before the outcome.
Maximum Favorable Excursion tells you how far it moved in your favor.
Now compare these with tick-volume conditions.
For example:
High tick volume breakout trades may have larger MFE but also larger MAE.
Low tick volume trades may have lower MAE but considerably lower MFE.
That information might assist you identify if the problem is your stop, your target, your entry time, or just the market environment.
Your objective is not to maximize one statistic.
It is to understand how activity changes the entire distribution of trade outcomes.
Do Not Optimize Tick Volume in Isolation
This is where traders can easily overfit.
You discover that trades with relative tick volume between 1.7 and 2.3 have the best historical results.
So you create a rule:
Only trade when tick volume is between 1.7 and 2.3.
It looks precise.
It may also be nonsense.
But perhaps you only have 17 trades in that range.
Perhaps such trades were made during one of the stronger-than-typical months.
Perhaps the true edge was the session trend.
Maybe it was the breakout location that was the real motivation.
The volume threshold could be a measure of volatility.
That’s why tick volume should be assessed along with the elements that give it meaning.
Session
Volatility.
Structure.
Spread.
Installation
Execution .
Those are the bits that make a number turn into context.
Tick Volume and Liquidity: The Professional Interpretation
If I had to put together the whole structure in one sentence, it would be:
Instead, tick volume is more appropriately considered as a proxy for market activity that, along with price impact and execution information, can be used to infer shifts in liquidity circumstances.
That is a far more defensible thing to say than:
High tick volume = high liquidity.
This is important since liquidity is about the capacity to transact without undue impact on pricing.
A market can be very active and badly executed.
A market can have the oldest activity and still facilitate clean execution of a tiny order.
Your personal order size also important.
The market that is sufficiently liquid for a small retail position may not behave in the same way for a large institutional transaction.
The CME liquidity study addresses this larger notion of liquidity, including fill quality and price impact.
A Practical Decision Tree
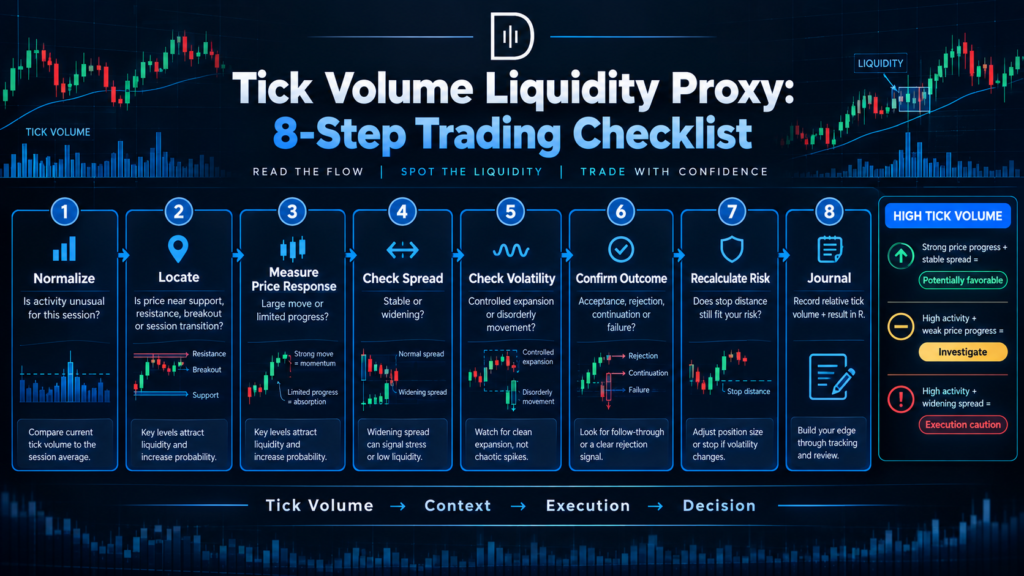
When tick volume suddenly increases, use this sequence.
Step 1: Normalize it.
Is the current activity actually unusual for this session and timeframe?
Step 2: Locate it.
Is the activity occurring at support, at resistance, at a breakout level, during a session transition, or somewhere structurally irrelevant?
Step 3: Measure price response.
Did the Price move a lot, or move a little?
Step 4: Check spread.
Was execution cheaper, the same, or more expensive?
Step 5: Check volatility.
Is the range expanding normally or becoming disorderly?
Step 6: Wait for confirmation of the outcome.
Did the Price price the new level or reject it?
Step 7: Recalculate risk if necessary.
Recalculate position size if the needed stop has changed.
Step 8: Record the observation.
Your future edge comes from collecting these relationships.
That is how an indicator becomes a research process.
Three Tick Volume Situations Worth Memorizing
High Tick Volume, Strong Price Progress
This is the classic expansion environment.
Look for whether the move occurs through a meaningful level and whether the Price prices the new territory.
It can be useful for breakout and continuation strategies.
High Tick Volume, Weak Price Progress
This is more muddy.
Price is efficient, yet activity is high.
Look for absorption, failed breakouts, range behavior, or an impending transition.
Don’t auto pursue the candle.
Low Tick Volume, Large Price Movement
This is easy to overlook.
Price can sometimes move significantly with relatively low activity.
That may indicate thin conditions.
For a retail trader, this can create a deceptive chart because the market appears to be moving cleanly while actual execution conditions may be less robust.
The important question is:
Is the Price moving because there’s a lot of participation or because there’s not a lot of liquidity on the other side?
That is a considerably more difficult subject than the simple question of whether volume is increasing.
When Tick Volume Should Make You Stay Out
But there are times when you should be more cautious about tick volume, not more confident.
If activity is high and spreads are widening, performance could be breaking down. If activity is extremely low and the market is thin, the Price can unexpectedly plummet through levels.
If your activity rises and your Price is inconsistent, your approach may not be the right one for that scenario.
If your backtest shows negative expectation during a period of a lot of activity, don’t just ignore your data because the chart seems good.
The professional decision is sometimes:
No trade.
That is not a failure of the indicator.
That is the indicator doing its job.
The Best Use of Tick Volume Is Comparative
The most useful tick-volume question is rarely:”
“Is volume high?”
It is:
“Is activity higher or lower than what is normal for this exact context?”
“That context includes:
instrument
timeframe
session
time of day
market state
News environment
Volatility regime
broker feed
Once you think comparatively, tick volume becomes much more useful.
A 900-tick candle is meaningless by itself.
A 900-tick candle that is twice the normal activity for that exact five-minute session window, occurs at resistance, coincides with a 3x increase in spread, and produces only a small price displacement is a completely different observation.
Now you have information.
Scaling and Capital Growth
There is a point where better analysis stops being the main constraint.
You can have a tested strategy.
You can understand session behavior.
You can normalize tick volume.
You have control over what is run.
But with a modest amount of capital to deploy, the financial value of a truly repeatable edge is limited.
That’s not to say the answer is to pile on leverage foolishly.
Serious traders must finally think about the relationship between edge, risk capability and capital.
This is where evaluation programs can make sense for traders who already have a proven process.
An evaluation should not be viewed as a shortcut to becoming profitable.
It’s a different trading environment with different limits.
The question is do these constraints fit your existing method.
If your tick-volume analysis suggests your edge lies in selective session windows, controlled position-sizing and avoiding harsh execution conditions, then you should find a software whose rules enable you to trade that way.
The5ers may be on traders’ radar. The current materials set assessment frameworks are based on profit targets, drawdown allowances and trading day criteria. Always check program-specific rules before to registration.
The5ers official program information
FTMO, Topstep and other firms have varied evaluation structures and restrictions. The key comparison isn’t only the advertized account size.
Compare the regulations with how you really trade.
If you want to buy wider stops in extreme volatility, check how the firm’s drawdown model handles it.
Only trade certain sessions? Make sure that the program’s constraints overlap with your timing.
If you are using a news event approach, please see the firm’s current news rules.
The capital should fit the strategy.
The student’s program would not be distorted to pass an evaluation.
Journaling and Performance Optimization
Tick volume becomes much more powerful when it becomes part of your performance database.
You can use your Trade Journal Template and trading toolbox as a base.
Include some fields dedicated to liquidity analysis:
Relative tick volume
Meeting
Spread condition
Volatility Status
Price range
Price response
Setup type
MAE
MFE
Slippage
Result in R
Then add:
Liquidity interpretation
For instance:
Steady regular spread
Extreme activity, accuracy.
Extreme activity, expansion.
A slow thin motion.
Strong activity no price reaction.
That final label can become surprisingly valuable after a few months.
You may discover that your biggest losses do not come from the incorrect direction.
They come from trading the right setup in the wrong liquidity environment.
That is the type of problem a normal win-rate report will not reveal.
The Weekly Tick Volume Review
Once per week, review your trades by relative activity.
Compare:
Below-normal activity
Normal activity
Increase activity
Extreme activity
Then take the expectation.
Do the same for spreads.
Combine the two, then.
You might find:
Highest expectancy = normal activity + narrow spread
High activity + regular distribution equals excellent breakthrough performance
Extreme activity + widespread = negative expectancy
Low activity + tight spread = acceptable for mean reversion but poor for momentum
That is a real trading map.
And unlike a generic indicator setting, it is based on your own strategy.
The Psychological Benefit of Measuring Liquidity
There is also a psychological benefit.
When traders do not understand why execution changes, they tend to personalize every loss.
“I got stopped out because the market hunted my stop.”
I went in and was slipped immediately.
“The breakout was a sham.
“Price moved before I could get in.
Sometimes their observations are right.
But without facts they’re just fiction.
You can explore with tick volume, spread, price range and execution records.
The market wasn’t necessarily exceptionally illiquid.
Perhaps your entry was late.
The spread was maybe okay.
Your stop was in normal volatility, maybe.
Maybe the set-up was negatively expectant for that session all along.
Data replaces the story.
That is one of the most useful psychological benefits of journaling execution.
A 30-Trade Tick Volume Experiment
If you want to start immediately, do not build a complicated indicator.
Perform a 30-trade experiment.
For each trade, write down:
Relative tick volume at the entering point
Session.
Share.
ATR. Type of setup.
Price bracket.
Entry delay.
Distance to halt.
MAE.
MFE.
Result in R.
Then, classify the trade:
Low activity
Regular activity.
High level of activity
Super busy
After 30 trades, look at the data.
Don’t adjust your strategy yet.
Search for relationships.
After another 30 trades compare again.
Then ask yourself:
My edge gets better the more activity?
Does it come apart when the going gets tough?
Is the benefit of additional activity more than the spread expansion?
When increasing activity confirms a structural breakout, my best performance is?
Do low-activity pullbacks work better than low-activity breakouts?
These questions turn any generic volume indicator into a personal execution framework.
Frequently Asked Questions
What is tick volume in forex trading?
Tick volume is the quantity of price changes recorded within a specified period of time. On MetaTrader, Forex volume is the number of price changes in the given time frame, not centralized transaction volume.
Is tick volume the same as real volume?
No, tick volume measures price or quote changes. Real volume means the actual volume traded (when the data is available). This is why tick volume is often employed as a proxy. In decentralized spot forex, there is no single centralized exchange that records every transaction.
Can tick volume be used as a liquidity indicator?
It can be used as a proxy for liquidity or as an activity metric, but not as a direct measure of liquidity. Add spread, volatility, price impact and execution quality.
Does high tick volume mean high liquidity?
Not by default.
High tick volume means there is more activity in the market. Liquidity means how easy it is to execute orders without a major effect on pricing. Markets can become quite active with spreads widening and execution quality deteriorating.
Why does tick volume differ between forex brokers?
Spot FX is decentralized and brokers may get multiple price feeds and quote updates. Therefore tick-volume numbers may differ amongst vendors.
Therefore, relative tick volume within the same data feed is usually more useful than comparing absolute tick counts across brokers.
What is relative tick volume?
Relative tick volume is a comparison of current tick activity against a historical baseline.
The simple formula is:
Relative Tick Volume = Current Tick Volume / Similar Historical Tick Volume
The relative tick volume is 2.0 if the current tick volume is 1,000 and the similar baseline is 500, which means activity is about twice the baseline.
How should I use tick volume during a breakout?
Do not rely on high tick volume as confirmation only.
Watch if the Price breaks the level, closes past it, adopts the new area and carries on after.
The useful sequence is:
Activity ->Break->Acceptance->Follow through
Can tick volume help identify fake breakouts?
Yes, with relation to a larger framework.
You can get some good indications of rejection or failed acceptance with a breakout that couldn’t sustain the level and a significant tick-volume surge.
However, tick volume alone cannot confirm a false breakout.
Is tick volume useful for scalping?
Yes, but scalpers should be extra careful.
The spread, slippage and quality of execution are very important for scalping tactics. A tick volume increase can be a sign of more activity, but not necessarily better economics for a short term trade.
Should I increase my position size when tick volume increases?
Not at all.
More action means more risk. If more volatility needs a broader stop, position size may need to drop to keep the monetary risk constant.
What is the best tick volume indicator setting?
There is no standard setting.
A preferable technique is to normalize the tick volume against a meaningful historical baseline for your instrument, timeframe and trading session.
Assess whether high, normal, or low activity affects plan expectancy.
Can tick volume predict price direction?
Not to be trusted on its own. The number of ticks is the indicator of activity, not the direction of the ticks. Direction is defined by how well the method fits the price structure, breakout acceptance, trend state, volatility, and execution circumstances.
How can I test whether tick volume improves my strategy?
Compare the trade tick quantities and categorize the results by activity.
Compare expectations, average R, MAE, MFE, victory rate, and execution expenses by category average R, MAE, MFE, victory rate and execution expenses by categories.
No need to ensure tick volume works.
The idea is to see if this is better for your particular strategy.
Final Takeaway
The biggest mistake you can make with tick volume is asking it a question it cannot answer.
It can’t tell you exactly how much money was traded.
It can’t show you the whole global FX order book.
But it cannot guaranty that a breakout will continue.
And it cannot tell you if the following candle is going to go up or down.
It can indicate you that the market’s activity has changed.
That’s a good thing.
The true edge is what happens next.
Compare the activity to a typical baseline.
Compare activity vs. price fluctuation.
Check spread markets.
Compare Activity to Volatility.
Then look at what Price did.
And that’s why tick volume is a proxy for liquidity and not another colorful bar under your chart.
For your next 30 trades, make one change to your journal: record relative tick volume at entry and what that activity actually produced.
Do not ask whether the volume was high.
Ask whether the market delivered a meaningful price response for that level of activity.
That question will teach you far more.
And if you want to take the analysis one step further, the natural next read is DaDayTradersDiary’s guide on How To Use Session Heatmaps For Entry Timing, because liquidity conditions make much more sense when you study them in the context of time and volatility.