
A retracement looks easy after it happens.
Price breaks higher, pulls back into support, prints a bullish candle, and then rallies. On a historical chart, the entry seems obvious.
Real-time trading is different.
You see the price fall into the level and immediately think, “This is the retracement entry.”
You buy.
Then the market falls another 20 pips.
You buy again.
Then support breaks.
The move you thought was a routine pullback becomes a reversal.
I have seen this mistake repeatedly, including in otherwise disciplined traders. The problem is usually not their ability to identify support or resistance. It is that they confuse location with confirmation.
A price level can tell you where a trade might become interesting. It cannot tell you when the trade is actually ready.
That distinction is the foundation of this three-step retracement method.
The framework is simple:
Step 1: Location.
Step 2: Reaction.
Step 3: Confirmation.
You do not need all three steps to predict the future. You use them to progressively reduce uncertainty before committing to risk.
Why Retracement Entries Fail So Often
Most traders enter a retracement too early.
They see price reach a 50% Fibonacci level, previous resistance, VWAP, moving average, or demand zone, and immediately place an order.
The logic sounds reasonable.
“The trend is bullish and price has pulled back to support.”
But there is a missing piece.
Is the market actually responding to that support?
There is a major difference between:
“Price is at support.”
and:
“Price touched support, selling pressure subsided, buyers came in and price confirmed a short-term change in structure.”
The first is a place.
Second trade.
This is also why the best retracement setups tend to happen a little bit late.
You are letting the market prove your level is relevant on purpose.
The Three Confirmation Steps
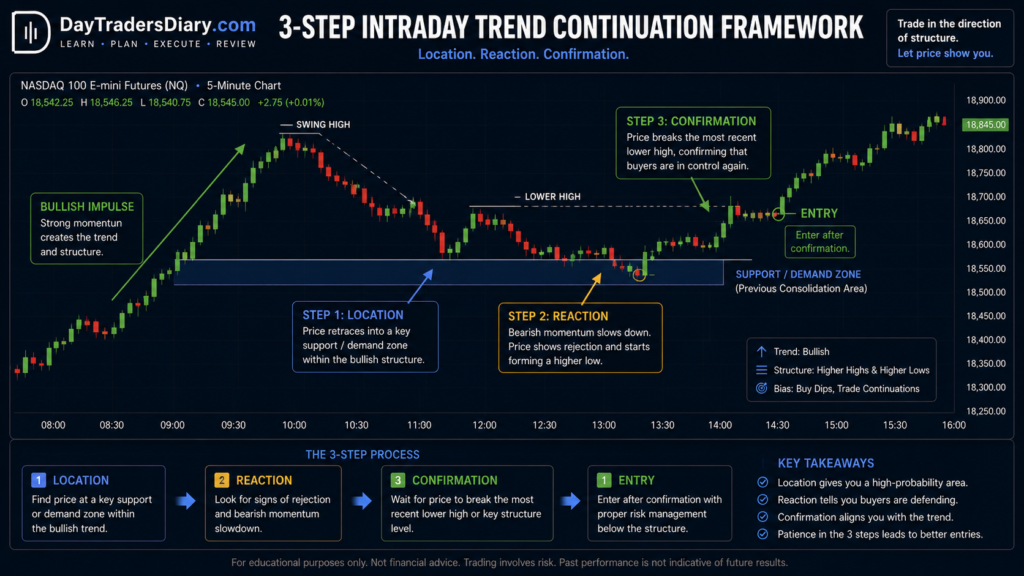
The framework can be summarized as follows:
Step 1: Location finds you where you want to watch.
Step 2: Reaction proved change of opposing pressure.
Step 3: Confirmation means you are starting to get back in charge of your direction.
Each step answers a different question.
Step 1 asks:
“Where could the retracement reasonably end?”
Step 2 asks:
“Is someone actually defending this area?”
Step 3 is:
Price: Has price given me enough evidence to enter?
This avoids one of the most expensive behaviors in active trading, that of entering when the price hits a level vs when the price has shown a reaction.
What Research Tells Us About Price Reaction
There is a deeper reason to focus on reaction rather than static levels.
Financial markets are driven by changing order flow and liquidity, not by chart lines alone. Research published through the BIS has found that FX order flow contains information about future exchange rates, highlighting the importance of actual trading pressure in price formation.
The practical lesson is important.
A support zone does not “cause” the price to reverse.
It is a location where the balance between buyers and sellers may change.
That balance has to be observed.
More recent BIS work also describes the FX market as fragmented and increasingly electronic, with price discovery distributed across venues and execution methods.
For a day trader, this helps explain why a level that looks perfect on a chart can still fail.
You are not trading the drawing.
You are trading the reaction of market participants around that area.
The Federal Reserve has likewise documented how reduced liquidity can amplify price movements, particularly when directional order-flow pressure increases.
That matters during retracements because a normal-looking pullback can become much more aggressive when liquidity deteriorates.
So the three-step method is not about adding three indicators.
It is about observing three stages of market behavior.
Step One: Location
The first confirmation is not actually an entry confirmation.
It is a location confirmation.
You want the price to retrace into an area where continuation makes logical sense.
This could be the original breakout level.
It could be a previous swing high that may become support.
It could be a higher-timeframe demand zone.
It could be VWAP in a particular intraday context.
It could be the midpoint or deeper portion of a strong impulse.
It could be a confluence of several factors.
The key is that you define the area before the price gets there.
Do Not Start With Fibonacci
Fibonacci can be useful, but it should not be the first thing you look for.
Begin with market structure.
If EUR/USD breaks 1.0850 and rallies to 1.0890.
The prior resistance 1.0850 is now relevant immediately.
If there is a previous five-minute higher low at 1.0845, that region becomes even more fascinating.
Now, the 50% retracement of the impulse also lands around 1.0870.
You have three different pieces of information pointing toward the same area.
That is more useful than saying:
“Price touched 50%, so I am buying.”
The level is interesting because of the confluence, not because of the Fibonacci number itself.
Build a Retracement Zone, Not a Single Price
One of the worst habits in retracement trading is treating support as an exact line.
Let’s say your level is 1.0850.
You buy at 1.0850 precisely.
Price is trading at 1.0847.
You freak out.
But the market may be probing the zone.
Pro execution generally means admitting that levels are areas, not precise values.
The most important question is not:
Did price hit my exact level?
It is:
“Did price come into my area of reaction and reject or consolidate?
That distinction can make a tremendous difference in execution.
Location Must Also Make Sense in the Larger Structure
A retracement entry should not exist in isolation.
Suppose the one-minute chart is bullish.
Price pulls back into a one-minute support level.
You buy.
But the 15-minute chart is sitting directly beneath major resistance after a large extended rally.
The one-minute retracement may work for five pips and then fail.
This is why timeframe alignment matters.
DayTradersDiary.com’s guide on what time frames day traders use makes the same practical distinction between higher-timeframe bias, structural timeframe, and execution timeframe. What Time Frames Do Day Traders Use?
The lower timeframe should refine the trade, not completely redefine the market context.
A Useful Three-Timeframe Structure
For an intraday retracement trade, you can use:
Higher timeframe for directional bias.
Middle time frame structure.
Shorter time for entrance confirmation.
For example:
15 min chart: structure is bullish.
5-Minute Breakout and Retracement Chart.
1-min chart: response, confirmation.
This prevents the common problem of finding a beautiful one-minute bullish setup directly into major higher-timeframe resistance.
Step Two: Reaction
Once the price reaches your location, do nothing.
This is where discipline becomes an actual trading advantage.
You are waiting to see whether the market reacts.
A reaction can appear in different ways.
Selling pressure may slow.
Candles may become smaller.
Price may stop making lower lows.
A rejection wick may appear.
A bullish engulfing candle may develop.
Price may reclaim a short-term swing.
Volume may change.
The exact pattern is less important than the underlying behavior.
You want evidence that the retracement is losing momentum.
The Most Important Reaction Is Often Lack of Continuation
This is subtle.
Traders often look for a dramatic reversal candle.
You do not always need one.
Imagine the price has been falling aggressively for eight candles.
It reaches your support zone.
The next four candles fail to make a meaningful new low.
They overlap.
Ranges shrink.
Price remains inside a narrow area.
That lack of downside continuation is information.
The sellers were previously in control.
Now they are struggling to push the price lower.
You do not yet have a bullish entry.
But you have the first evidence that the retracement may be exhausting.
Think in Terms of Pressure, Not Candlestick Names
A hammer is not bullish simply because it is a hammer.
An engulfing candle is not bullish simply because it engulfs the previous candle.
A pin bar does not guarantee a reversal.
Ask what the candle represents.
If price rapidly trades below support, attracts sellers, then recovers and closes back above the level, that tells you something about the auction.
If price prints a bullish candle but immediately fails on the next candle, the pattern has little follow-through.
This is why candle names should come after context.
Reaction Quality Matters
I like to classify reactions into three categories.
A weak reaction means the price pauses but has not actually changed behavior.
A developing reaction means downside momentum is slowing, and the price begins stabilizing.
A strong reaction means price rejects the area and begins reclaiming short-term structure.
Only the third category should normally trigger an aggressive entry.
The developing reaction can justify closer observation.
The weak reaction is usually a reason to wait.
Step Three: Confirmation
Now comes the part that separates an interesting retracement from an executable trade.
The market needs to prove that the reaction is becoming a continuation.
For a bullish retracement, one of the cleanest confirmations is a break of the most recent lower high created during the pullback.
Consider:
Price increases from 1.1000 to 1.1050.
Retraces to 1.1020.
The market pulls back to make a lower high at 1.1035.
Price pulls back through 1.1035
That’s meaningful.
The market has now breached the bear structure of the retracement immediately.
You are no longer buying simply because support is held.
You are buying because the price has started demonstrating a transition back toward the original direction.
The Three-Step Bullish Example
Let’s put the entire process together.
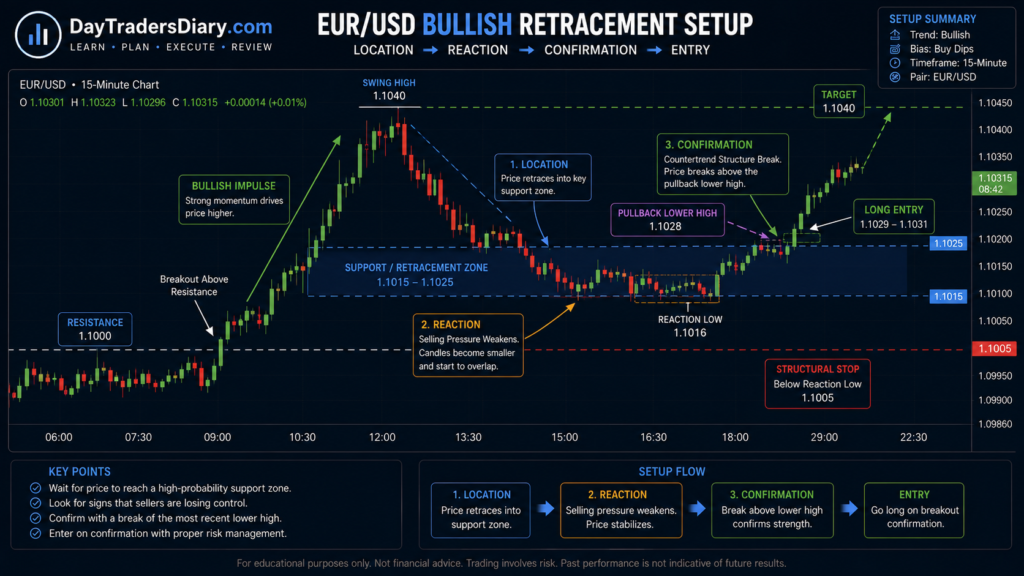
EUR/USD above 1.1000.
It rallies to 1.1040.
The main retracement zone is 1.1015-1.1025, since it includes the breakout structure and a previous intraday swing.
Step 1: Location
Price reaches 1.1020.
You do not buy.
You wait.
Step 2: Reaction
Selling slows.
price tests 1.1018 and reverses quickly.
Then candles stop making lower lows. “Now you had proof of sellers losing control.
No automatic entry yet.
Step 3: Confirmation
The retracement made a lower high of 1.1028.
1.1028 price breaks and stays above it.
The installation is now ready for use.
Depending on execution, your entry might be about 1.1029 to 1.1031.
Your target should be based on the remaining upside and your tested strategy.
That is a retracement trade.
Why the Third Step Is So Important
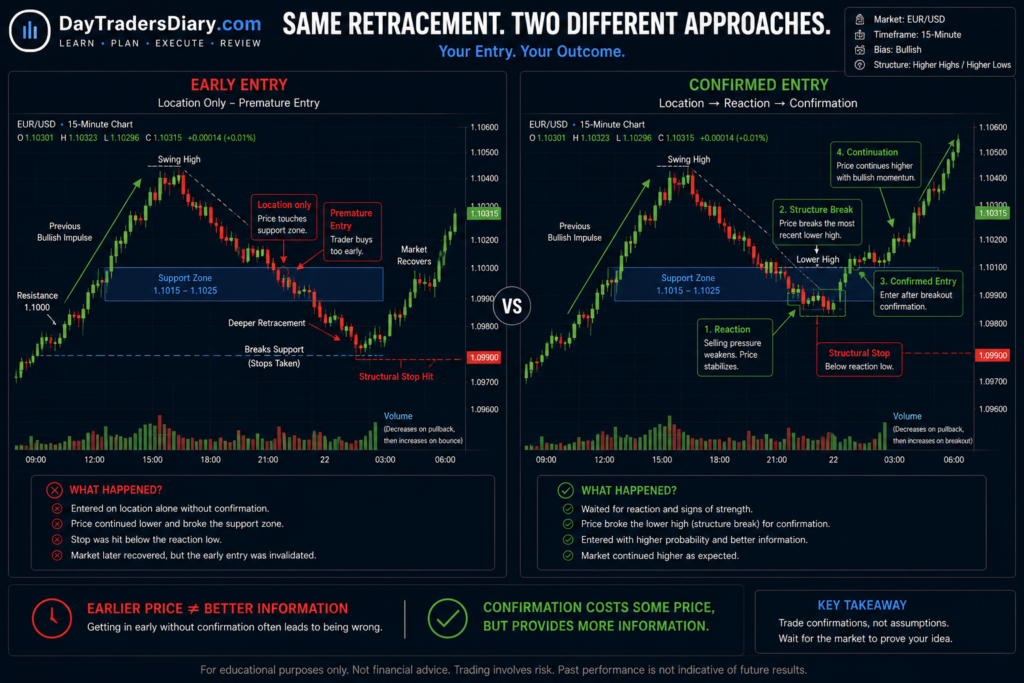
Without Step 3, you are essentially catching a falling knife at a support zone.
With Step 3, you are allowing the market to demonstrate a change in short-term structure.
You will sometimes enter later.
That is intentional.
Your objective is not to buy the exact bottom.
Your objective is to capture the part of the move where the probability and risk relationship makes sense.
Trying to buy the exact lowest price is one of the easiest ways to turn a structured strategy into guesswork.
The Cost of Confirmation
Confirmation is not free.
You give up some entry price.
Suppose the theoretical low is 1.1020.
The confirmation occurs at 1.1030.
You have given up 10 pips.
That is the cost.
But you may have gained information that the retracement is actually stabilizing.
The important question is whether the improved information compensates for the worse price.
This should be tested through your journal.
Some strategies perform better with early entries.
Others benefit substantially from confirmation.
Do not decide based on preference.
Measure it.
Confirmation Should Be Proportional to the Setup
Not every retracement needs five confirmations.
That can create another problem.
A trader starts with:
Support.
Then RSI.
Then MACD.
Then, moving-average crossover.
Then the candlestick pattern.
Then volume.
Then the market structure.
By the time everything agrees, the market has already moved 40 pips.
Overconfirmation can be just as damaging as underconfirmation.
The goal is not maximum confirmation.
The goal is sufficient confirmation.
Three stages are enough because each answers a different question.
Confirmation Step 1: Location
Is the price in a zone where continuation is possible?
Confirmation Step 2: Reaction
Is the countertrend pressure really abating?
Confirmation Step 3: Structure
“Has price demonstrated that the original direction is regaining control?”
That is enough.
What If Price Never Gives Confirmation?
This is where traders often sabotage themselves.
Price reaches the zone.
There is no clean reaction.
Then it suddenly rallies.
You feel like you missed the trade.
So you chase.
That is exactly what the framework is designed to prevent.
A valid retracement setup can fail to trigger.
If the market does not give confirmation, you do not have a trade.
You have an observation.
This mindset is important because it removes the emotional need to participate in every move.
What If Price Breaks the Retracement Zone?
Then Step 1 has failed.
Do not force Step 2.
If your planned support zone is 1.1000 to 1.1010 and price slices through it with strong momentum, you should not reinterpret every bearish candle as a “deeper retracement.”
The market is giving you new information.
Wait for a new structure.
Sometimes, the best trade after a failed retracement is a completely different setup.
The False Confirmation Problem
There is another trap.
Price reaches support.
Forms a bullish candle.
You enter.
Price rallies five pips.
Then collapses.
Why?
Because the bullish candle was not enough.
This is a false confirmation.
The key question is whether the market followed through.
One candle can show rejection.
It cannot always prove control.
That is why I prefer confirmation based on structure plus follow-through.
If the price breaks a lower high and then immediately falls back below it, the confirmation has weakened.
If price breaks the lower high, holds above it, and creates a higher low, the evidence is stronger.
Use Time as a Confirmation Tool
Time can also provide useful information.
Suppose the price reaches support and spends 15 minutes unable to move lower.
That can indicate absorption or equilibrium.
Now, suppose the price touches support and immediately breaks through it in 20 seconds.
Very different information.
This does not mean “longer consolidation equals bullish.”
It means the speed and persistence of price movement help describe the quality of the reaction.
This becomes particularly important on lower timeframes.
Retracement Velocity
You can measure this.
Retracement velocity = distance retraced ÷ time taken.
Suppose the price retraces 20 pips in 15 minutes.
That is approximately 1.33 pips per minute.
Another trade retraces 20 pips in two minutes.
That is 10 pips per minute.
The second move is far more aggressive.
If the second retracement also breaks through your structural zone, you should be much more cautious.
The three-step framework becomes dynamic rather than mechanical.
Volume Can Strengthen the Reaction
Volume can add another layer of information where reliable volume data is available.
Suppose the price falls into support on decreasing volume.
Then, buying activity increases as the price reclaims the level.
That is constructive.
Now imagine price reaches support while volume expands dramatically on the sell side and continues expanding as the level breaks.
That is a different setup.
The volume does not give you a buy or sell signal by itself.
It helps you evaluate the quality of the reaction.
This is especially useful when combined with the principles behind trading fake breakouts with a volume filter.
What About RSI or Stochastic?
They can be useful as secondary evidence.
But do not make an oscillator your primary confirmation.
A market can remain overbought while continuing higher.
It can remain oversold while continuing lower.
During strong trends, oscillators can stay extreme for much longer than traders expect.
If RSI says oversold but the price is still making lower lows through your support zone, the market has not confirmed your retracement.
Structure wins.
Moving Averages Have the Same Problem
A moving average can provide context.
It can help identify trend direction or dynamic areas of interest.
But a moving average touch is not confirmation.
If price pulls back to the 20 EMA, the relevant question is not:
“Did price touch the EMA?”
It is:
“What did price do after touching it?”
The three-step framework keeps you focused on behavior.
A Strong Retracement Has an Asymmetric Sequence
The best setups often follow a recognizable sequence.
The trend expands.
Price pulls back.
The pullback becomes less efficient.
The market reaches a structural area.
Countertrend pressure weakens.
Short-term structure breaks.
Continuation begins.
Notice that the entry is near the end of the uncertainty phase.
That is the whole point.
You are not trying to predict where the retracement ends.
You are trying to recognize when the market starts proving that it has ended.
When This Method Works Best
The three-step method is particularly useful when the market is already directional.
A strong trend.
A clean breakout.
A momentum move.
A session expansion.
A pullback into meaningful structure.
It is less effective when the market is trapped inside a narrow range and repeatedly crosses the same levels.
In a range, what looks like a retracement may be a rotation.
The broader context determines whether the framework has an advantage.
When the Method Fails
The method can fail during sudden news events.
It can fail during major liquidity shocks.
It can fail when the higher timeframe trend is changing.
It can fail when the original breakout was already exhausted.
It can also fail when the retracement occurs into a level that was never important in the first place.
This is why you should not treat the three steps as a guarantee.
They are a decision framework.
Retracement Trading Around News
News deserves special treatment.
Suppose a currency pair breaks resistance immediately after CPI.
Price moves 50 pips.
It retraces 30.
A trader sees a perfect three-step setup.
But news-driven markets can have very different liquidity and volatility characteristics.
The Federal Reserve’s recent research on order-flow imbalances shows how directional trading pressure combined with fragile liquidity can amplify intraday price movements.
So a confirmation pattern that works during normal conditions may be much less reliable immediately after a major release.
If you trade news, separate those trades in your journal.
Do not mix them with ordinary technical retracements.
The Risk Model Comes Before the Entry
Once confirmation appears, the temptation is to increase size because the setup “looks better.”
Do not.
Confirmation improves the information available to you.
It does not justify abandoning your risk model.
Your stop should be based on the point at which your trade thesis is invalidated.
Then, the position size should be calculated from that stop distance.
This is where most traders miscalculate risk. Using a Position Size Calculator removes guesswork and helps keep the dollar risk consistent when the structural stop changes from one setup to another.
A 10-pip stop and a 25-pip stop should not produce the same position size if your risk budget is fixed.
The position size changes.
The risk does not.
The Three-Step Method and Reward-to-Risk
Confirmation improves reward-to-risk.
Suppose your retracement zone is 1.1020.
If you buy immediately at 1.1020 with a 20-pip stop, your target may be 40 pips away.
That is 2R.
But if the confirmation occurs at 1.1028 and the structural stop remains around 1.1010, your risk is now 18 pips.
If the target remains near 1.1050, the potential reward is 22 pips.
Your R multiple is still different from the initial entry.
Sometimes confirmation improves the trade.
Sometimes it makes the reward-to-risk ratio too poor.
That is why the third step should not automatically mean “enter.”
You still need to check whether enough upside remains.
The No-Trade Zone
This is one of the most useful additions to the framework.
Create a no-trade zone.
Don’t take the trade if the price confirms too late and the distance to the objective is too tiny.
For instance:
First retracement zone: 1.1020 to 1.1025
Confirmation: 1.1030.
Key resistance: 1.1040.
If you enter at 1.1030 with a structural stop at 1.1010, you are risking 20 pips to make 10 potentially.
The confirmation may be correct.
The trade can still be bad.
This distinction is essential.
Good analysis does not always create a good trade.
The Psychology of Confirmation
There is a psychological reason traders struggle with this approach.
Waiting feels like uncertainty.
Entering early feels decisive.
But early entry often gives you a psychological reward before the market gives you information.
You feel smart when the price bounces from your level.
You feel trapped when it does not.
Confirmation reverses that emotional structure.
You intentionally accept missing some of the moves in exchange for information.
That is a mature trading decision.
The Fear of Missing the Exact Bottom
You do not need the exact bottom.
Suppose the market retraces 30 pips.
You enter after confirmation and capture the next 45 pips.
Another trader buys the exact low and captures 75.
They traded better.
Not necessarily.
If they also enter prematurely on many other trades and suffer repeated losses, their apparent precision may not translate into better expectancy.
Your goal is not to win the screenshot competition.
Your goal is to build a repeatable process.
The Journal Should Measure Each Confirmation Step
This is where your Trade Journal Template becomes more than a record of wins and losses.
Track:
Where was the retracement zone going to be?
Did the price make it there?
How did the price behave?
What caused the confirmation?
How many candles between reaction and confirmation?
How far was the entrance from the retracement low or high?
How much R remained after confirmation?
Did confirmation produce continuation?
Did the trade fail before or after confirmation?
These details can reveal where your real edge exists.
Separate Early Entries From Confirmed Entries
This is one of the most valuable tests you can perform.
Suppose you have 100 retracement setups.
Fifty were entered immediately at the zone.
Fifty waited for confirmation.
Compare:
Win rate.
Average R.
Maximum adverse excursion.
Average drawdown.
Average reward.
Average time in trade.
Profit factor.
Early entries have a higher average reward but much larger drawdowns.
Or you might discover that confirmation entries produce fewer trades but significantly better expectancy.
Without the data, you are guessing.
Backtest the Three Steps
DayTradersDiary.com’s guide on how to backtest a day trading strategy emphasizes the importance of defining rules precisely enough that they can actually be tested. How to Backtest a Day Trading Strategy
That principle is important here.
Do not write:
“Hold on for confirmation.”
What is confirmation?
For instance:
A positive retracement requires price to enter the stated support zone, make a higher low or get back above the last 1 minute lower high and close above that level.
Now another trader can understand the rule.
You can test it.
You can improve it.
You can reject it.
That is how discretionary trading becomes measurable.
Create a Confirmation Score
If you prefer a more flexible approach, create a simple score.
Location quality can receive a score.
Reaction quality can receive a score.
Structural confirmation can receive a score.
For example, each category could be rated from 0 to 2.
A setup scoring 6/6 might qualify for normal execution.
A 4/6 setup might require more evidence.
A 2/6 setup might be ignored.
The exact numbers are less important than consistency.
Do not change the scoring system after every losing trade.
Test it over a meaningful sample.
A Complete Example From Start to Finish
Imagine gold is trading in an intraday uptrend.
Price breaks a resistance level at 2,400 and reaches 2,420.
You do not chase.
You identify 2,410 to 2,414 as the main retracement area because it contains the midpoint of the impulse, a previous intraday structure level, and a prior consolidation edge.
Price falls to 2,413.
Step 1: Location confirmed.
You still do nothing.
Price trades to 2,411 and begins producing smaller bearish candles.
The next candle tests 2,410 but closes back above 2,412.
Step 2: Reaction confirmed.
You now watch the short-term structure.
The pullback created a lower high at 2,415.
Price breaks 2,415 and closes above it.
Step 3: Confirmation confirmed.
Now you calculate the trade.
Entry: around 2,415 to 2,416.
Stop structure: Low in the reaction.
Based on the next big resistance or Rmultiple being tested.
If the remaining reward is adequate, do it.
Otherwise omit.
That last selection is important.
A confirmation is not a promise to trade.
What If Confirmation Occurs Below the Original Level?
This is where you need to distinguish a retracement from a failed breakout.
Suppose the price breaks 2,400.
Then falls back below 2,400.
It creates a bullish reaction at 2,395.
Then reclaims 2,400.
That can become a different type of setup.
You are no longer trading a clean retracement above the breakout level.
You are potentially trading a failed-breakout recovery.
Do not mix the two in your statistics.
Different setup.
Different expectancy.
Different risk.
Three Confirmation Steps for Bearish Retracements
The framework works in reverse.
Suppose price breaks below support.
Price falls.
Then retraces upward.
Step 1:
Price is at a retest or resistance zone.
Step 2:
The buying pressure is easing.
Step 3:
Price breaks the most recent higher bottom on the retracement.
For instance,
Support at 1.2500.
Price down to 1.2460.
Retraces to 1.2485.
The retracement creates a higher low at 1.2475.
Price then breaks 1.2475.
That can confirm that sellers are regaining control.
Again, you do not need to sell the exact top of the retracement.
The Confirmation Trigger Should Match Your Timeframe
On a one-minute execution chart, a one-minute structure break may be enough for a scalping setup.
On a five-minute setup, a one-minute break might be noise.
This is why your trading timeframe matters.
DayTradersDiary.com’s discussion of timeframe selection makes an important point: the execution timeframe should serve the strategy rather than dictate the entire market view. What Time Frames Do Day Traders Use?
Your confirmation should therefore be appropriate to the timeframe that generated the setup.
Don’t Add Confirmation Forever
A common progression looks like this:
First, the trader enters too early.
Then they learn about confirmation.
Then they add another indicator.
Then another.
Then another.
Eventually, they require so much agreement that they take one trade per week.
That is not necessarily an improvement.
The three-step method is deliberately simple.
Location.
Reaction.
Structure.
Everything else is secondary.
Scaling and Capital Growth
A repeatable retracement method can solve an entry problem.
It does not automatically solve a capital problem.
This matters because traders sometimes develop a strategy that produces a reasonable expectancy but find that their personal account limits how much they can practically scale risk.
That is where evaluation programs can become relevant.
They should not be treated as shortcuts.
An evaluation is another performance environment with its own constraints.
If your strategy routinely experiences 2% drawdowns before recovering, but the evaluation’s rules make that drawdown difficult to tolerate, the strategy and evaluation may be a poor match.
You need to understand the rules before choosing the account.
The5ers’ current High Stakes program is a two-step evaluation. The June 2026 rules state that the new version requires at least three profitable trading days, a 10% Phase 1 target and 5% Phase 2 target, with a 5% daily loss limit and 10% maximum loss.
The official program page also lists unlimited trading time and scaling conditions.
The 5ers High Stakes evaluation
For a trader using retracement entries, the important question is not simply whether those numbers look attractive.
Ask whether your actual trading distribution fits them.
If your normal strategy can produce a series of losses without changing behavior, can you remain within the drawdown rules?
If your average trade requires wide stops, can you size appropriately?
If your best setups occur only a few times per week, does the evaluation structure give you enough time?
Those are professional questions.
Other firms have different structures, markets, drawdown models, and execution rules. The right choice depends on the strategy, not the marketing headline.
Why Evaluation Accounts Can Reinforce Discipline
There is another psychological benefit.
A defined evaluation account can force you to think in terms of drawdown rather than individual trades.
You cannot afford to think:
“This one is almost guaranteed.”
You have to think:
“How does this trade affect my risk distribution?”
That mindset is useful even before you ever trade an evaluation.
If your retracement system has a 45% win rate but produces 2.2R average winners, you should care more about preserving the distribution than about making every trade work.
That is professional thinking.
Three Steps, One Rule
There is one rule I would add to the entire framework:
If one of the three steps is missing, do not invent it.
If the price reaches the zone but does not react, wait.
If it reacts but never confirms, wait.
If it confirms too late and the reward-to-risk is poor, skip.
You do not need to make every chart produce a trade.
You need the right sequence to produce a trade.
Frequently Asked Questions
What are the three confirmation steps for a retracement trade?
The three processes are: 1. Location 2. Reaction 3. Structural Confirmation First of all, find a major retracement zone. Then wait for evidence the countertrend pressure is lessening. Finally, wait for price to retake or break the appropriate short term structure in the direction of the original trend.
How do you know when a retracement is finished?
You cannot know with certainty in real time. Instead, look for a combination of price stabilization, rejection of a meaningful level, and a break of the countertrend structure. Follow-through after the structure break provides additional evidence.
Should I buy immediately when the price reaches support?
Usually not, if your approach is confirmation-centred. A support level informs you where to look but not necessarily when to get in. This will help avoid hasty entries. However it may give a later entry price.
What is the best confirmation for a retracement trade?
For many short-term strategies, a break of the most recent countertrend swing is a useful confirmation because it demonstrates that the retracement structure is changing. It works best when combined with meaningful location and a visible reaction.
Can Fibonacci levels confirm a retracement?
Fibonacci levels can provide reference points, but they should not be treated as standalone confirmation. A Fibonacci level becomes more useful when it overlaps with the actual market structure and price subsequently reacts there.
Does volume help confirm retracement trades?
Yes, where solid volume statistics can be found. A managed pullback with diminishing volume and higher participation in the original direction can support the continuation argument. Volume should be taken in conjunction with price structure and not utilized alone.
What if the market moves before I get confirmation?
Leave it be. A missed transaction is better than a chase replacing a stated strategy. After confirmation , if the market goes too far away , the remaining reward to risk may not justify participation .
How much should I risk on a retracement trade?
Use the same pre-determined risk framework as you would with any of your previous configurations. The stop should be set according to structural invalidation, and position size modified to maintain monetary risk.
Does the three-step method work for both Forex and stocks?
The underlying logic can be applied to both, but the characteristics of liquidity, volume, volatility, session structure, and execution differ. Your statistics should therefore be collected separately by market and setup type.
Final Takeaway
The key advancement in retracement trading isn’t learning another entry pattern.
It is learning to cease using place as confirmation.
You can get an A-level and still flunk.
A Fibonacci zone can be precise and still fail.
A moving average can line up precisely, and still be wrong.
Your job is not to get the market to respect your level;
Your role is to wait for the market to show you that your level matters.
That’s why the three-step cycle is a good framework for decision-making:
Location tells you where to pay attention.
Reaction tells you whether the opposing pressure is weakening.
Confirmation tells you whether the original direction is beginning to regain control.
For your next 30 retracement setups, make one change to your journal.
Do not record only the entry.
Record exactly which of the three steps appeared, when it appeared, and whether the trade continued after confirmation.
Then compare early entries against confirmed entries.
You may discover that your biggest improvement does not come from finding better levels.
It comes from becoming better at waiting for the market to prove that the level is working.
As your next read, study DayTradersDiary.com’s material on breakout exhaustion and fake breakouts with volume filters. The natural progression is to learn not only how to enter a retracement, but how to recognize when the retracement is warning you that the original breakout thesis is no longer valid.