
A trader sees CPI at 8:30 AM, checks the economic calendar, waits for the number, and then sees a potentially fine setup blow through the stop in less than a second.
The usual explanation is, “News is volatile.”
That explanation is true, but it is not useful.
Volatility is not a switch that is either on or off. It changes the expected movement, the size of candles, the distance required for a realistic stop, the probability of slippage, the quality of breakouts, and sometimes the entire market structure.
The mistake is treating news as an event.
Experienced day traders treat it as a change in market conditions that can be measured before the trade.
If you know that an instrument normally moves 20 points during a particular period but routinely expands to 45 or 60 points around a major release, your normal stop and position size are no longer appropriate.
That is the foundation of this article.
The goal is not to predict whether CPI, NFP, FOMC, GDP, or another announcement will send prices higher or lower.
The goal is to answer a much more practical question:
“How much movement should I reasonably expect, and can my trade survive it?”
That is what it means to quantify news volatility.
Why News Volatility Is Different From Normal Volatility
Normal intraday volatility develops through a continuous auction.
News can compress that process to seconds.
Traders may scale down positions, widen or alter orders, hedge exposure or wait for information prior to an announcement. Market participants revise their expectations at the same time as the number is released.
The result can be an abrupt repricing.
The important word is repricing.
A CPI release does not merely make candles larger. It can change what the market believes about inflation, interest rates, central-bank policy, economic growth, and future earnings.
That is why a technical level that worked perfectly for the previous two hours can become almost irrelevant immediately after a major announcement.
The market has new information.
Your chart has not changed the information. The information has changed the chart.
Research Shows That News Can Change the Volatility Regime
This is not simply a trader’s observation.
A 2026 Federal Reserve research paper reviewing monetary-policy effects on stocks finds that policy surprises around FOMC announcements can have substantial effects on markets, while communication outside the formal announcement window also matters.
For a day trader, that means the scheduled release time is not necessarily the only important time.
Markets can reposition before the announcement.
The reaction can continue after the headline.
And sometimes the press conference, revisions, or interpretation of the data matters more than the initial number.
Federal Reserve research has also found that announcement surprises can significantly increase short-term stock-market volatility.
More recent Federal Reserve research on macroeconomic news found that investor attention itself can influence the size of the market reaction. During periods of elevated attention to CPI and other major announcements, the response to surprises became stronger, and high-attention announcements could produce larger reactions.
That gives active traders an important insight.
The same economic release does not necessarily create the same trading environment every time.
A CPI release during a quiet inflation regime can behave very differently from CPI during a period when inflation expectations dominate every central-bank decision.
The event has a historical label.
The market has a current state.
The current state matters more.
The First Number You Should Calculate: Baseline Volatility
Before measuring news volatility, you need a normal-volatility baseline.
Otherwise, “high volatility” means nothing.
One of the simplest tools is ATR.
Suppose EUR/USD has a 5-minute ATR of 7 pips during the period you normally trade.
Now consider a major economic release.
If similar releases have historically produced 20- to 35-pip five-minute ranges, expecting the market to behave like an ordinary 7-pip environment is a serious execution error.
The same concept applies to stocks.
If a stock normally produces 35 cents of movement during five minutes but has historically moved $1.20 around earnings or a major company announcement, your ordinary stop is probably too tight for the event.
This is where ATR becomes useful.
Not as an entry signal.
As a volatility ruler.
The News Volatility Multiplier
A practical way to quantify the change is to calculate a news volatility multiplier.
The basic idea is:
News Volatility Multiplier = Normal Range / Typical Event Range
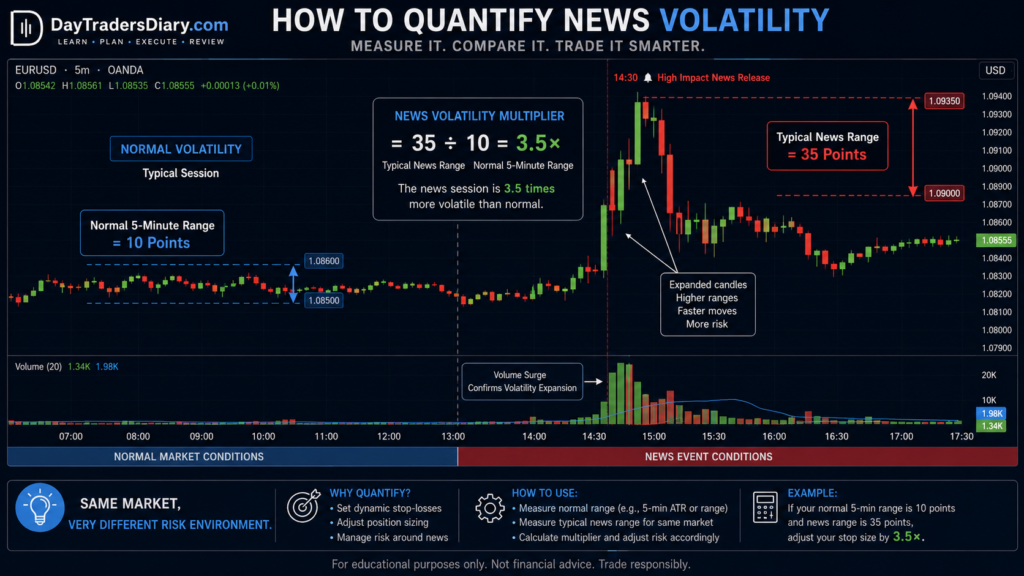
For example, supposing the standard 5 minute range of an instrument is 10 points.
The average first-five-minute range for NFP reactions is 35 points.
Your multiplier is:
35 ÷ 10 = 3.5
This means the event historically increases short-term mobility to around 3.5x the average baseline.
You do not have to believe the future will be exactly the historical average.
You need to recognize that a 10-point stop is operating in a market that has recently demonstrated the capacity for a 35-point move.
That changes the trade.
Don’t Use the Daily ATR for a Five-Minute Problem
This is a subtle mistake I see frequently.
A trader checks the daily ATR and assumes it indicates how much risk there is around a news release.
It does not.
Daily ATR answers a daily question.
News volatility often operates on a seconds-to-minutes horizon.
Trade a 5-minute setup, create a 5-minute baseline.
If you trade a 1-minute approach, learn 1-minute conduct.
If you are using a 15-second execution model, your study should include 15-second data or something at a similar granularity.
The closer your volatility measurement is to your execution timeframe, the more useful it becomes.
Build an Event Range Database
If you seriously want to quantify news volatility, stop relying entirely on generic volatility numbers.
Build your own database.
Take the economic events that actually affect the instruments you trade.
For each event, record the range during the first minute, first three minutes, first five minutes, first fifteen minutes, and first thirty minutes.
Then record the maximum excursion before the market settles into a new structure.
After enough observations, you can calculate:
Average event range
Median event range
Maximum event range
90th-percentile event range
Average post-news retracement
Median is good since one amazing release might mess up the average.
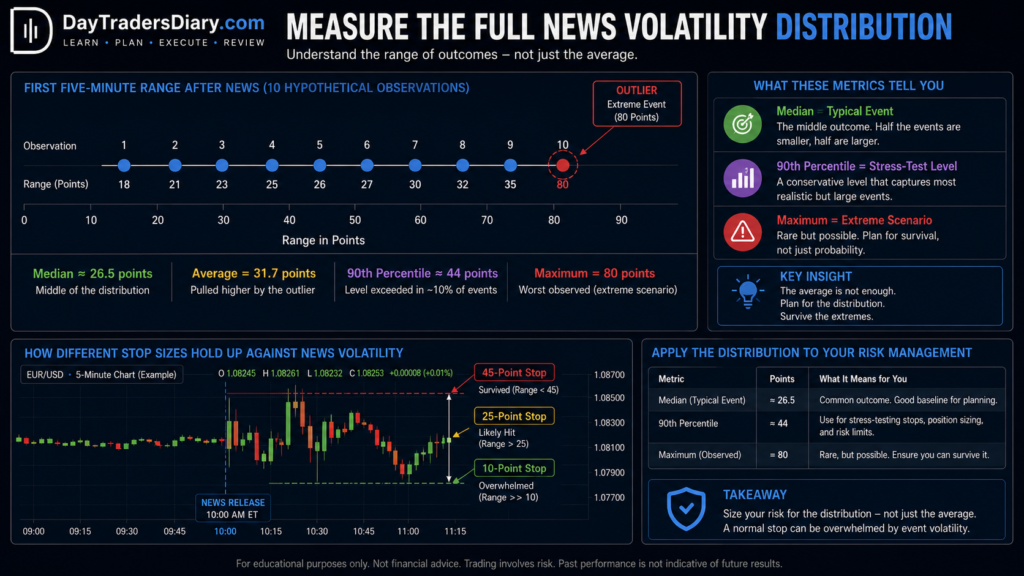
Suppose we have ten CPI reports, and the first five-minute ranges are:
18, 21, 23, 25, 26, 27, 30, 32, 35, and 80 points.
The average is pulled upward by the 80-point event.
The median tells you what a more typical event looked like.
The maximum tells you what can happen when conditions become extreme.
You want both.
The 90th-Percentile Range Is More Useful Than the Average
This is one of the most practical improvements you can make.
Average volatility describes what normally happens.
The 90th percentile describes a level that only the larger events exceed.
If your strategy cannot tolerate the 90th-percentile event range, you have to decide whether you will avoid the announcement or substantially reduce exposure.
For example, suppose your research shows:
Normal five-minute range: 12 points
Median post-news range: 28 points
90th-percentile post-news range: 46 points
Maximum observed range: 71 points
Now you have a real framework.
A 10-point stop is clearly aggressive.
A 25-point stop may survive an average event but fail regularly during larger surprises.
A 45-point stop has a much better chance of surviving the typical large event, but it also requires a smaller position if account risk remains constant.
That is quantitative thinking.
The Surprise Matters More Than the Calendar Label
“High-impact news” is not enough information.
Markets trade expectations.
Suppose economists expect CPI to come in at 3.0%.
The actual number is 3.0%.
That can generate a completely different reaction from a 3.5% print.
The first question is therefore not:
“Was the number good or bad?”
The better question is:
“How different was the number from what the market expected?”
This is the concept of the surprise component.
A simplified measure is:
Surprise = Actual − Consensus
For some releases, the sign matters.
For others, you need to understand which component matters to the market.
For example, a headline CPI number may look benign, while a change in core inflation or another component changes the interpretation.
The market does not trade the economic calendar.
It trades the difference between expectations and information.
Why Revisions Matter
Take employment data, for example. A headline payroll figure may exceed forecasts but the previous months can be revised substantially lower. This makes an informational set more complicated.
The initial headline may trigger buying.
Then, traders process the revision.
Price reverses.
If you only trade the first headline, you are reacting to incomplete information.
This is one reason news trading can produce a first move and then a second, opposite move.
The market is not necessarily confused.
It is processing information in stages.
The Surprise-to-Volatility Framework
You can improve your event model by separating releases into three categories.
A small surprise may produce a normal volatility expansion.
A moderate surprise may create a directional repricing.
An extreme surprise can trigger a volatility shock, temporarily undermining the reliability of technical levels.
You can estimate this from your own database.
For each event, record the size of the surprise and the resulting range.
Over time, you may discover that the relationship is not linear.
A slightly larger surprise does not always produce a slightly larger move.
Sometimes there is a threshold.
Below the threshold, the market absorbs the information.
Above it, the market reprices aggressively.
That threshold is much more useful than a generic statement that “news causes volatility.”
Measure the Spread Before You Enter
Volatility is more than candle size.
The importance of execution.
Spreads can move considerably on big announcements.
That is, a strategy that appears profitable based on past mid-price charts may not perform the same in actual execution.
Suppose your setup normally targets 12 pips with a 6-pip stop.
If the spread suddenly expands from 1 pip to 5 pips, the economics of the trade have changed.
You have lost a significant portion of your expected reward before the market even moves.
This is particularly important for scalpers.
A trader who measures ATR but ignores spread is measuring only half of the problem.
Add a Spread-to-Target Ratio
A simple metric is:
Spread-to-Target Ratio = Current Spread ÷ Planned Reward
If your spread is 2 pips and your target is 20 pips, the ratio is 10%.
If the spread expands to 6 pips, the ratio becomes 30%.
The strategy has not changed on the chart.
The execution environment has changed.
That should influence your decision.
Slippage Is Part of Volatility
This is another area where backtests can mislead traders.
Your platform may show a perfect entry at the breakout level.
Live execution may fill several points away.
During a fast announcement, the difference between the price you see and the price you receive can become significant.
You should therefore track:
Expected entry
Actual entry
Slippage
Expected stop
Actual stop
Maximum adverse excursion
This gives you a realistic picture of the cost of trading around news.
If you have already worked on entry delay risk, news events provide the perfect environment to apply those ideas. A delayed entry is not necessarily bad, but if price moves sharply while you hesitate, your reward-to-risk profile can deteriorate within seconds.
The News Volatility Budget
Here is a framework I recommend for active day traders.
Before the event, calculate how much movement your strategy can tolerate.
Call it your volatility budget.
Suppose your normal strategy uses a 10-point stop.
Historical event data show that the instrument frequently produces a 25-point adverse excursion within the first five minutes after release.
You have three choices.
You can avoid the event.
You can wait until volatility contracts.
Or you can adapt the stop and reduce the position size.
What you should not do is keep the same position size and hope the market behaves normally.
That is not risk management.
It is ignoring the environment.
The Pre-News Compression Trap
Pre-news compression is one of the most interesting trends around important announcements.
Prices fall very silent.
And ranges diminish.
Traders stop opening positions.
Liquidity situations can differ.
Then the announcement hits, and volatility explodes.
A trader may incorrectly interpret the pre-news compression as a breakout setup.
But sometimes the market is simply waiting.
This creates an important distinction:
Compression before news is not necessarily technical compression.
It can be information compression.
The market is waiting for information that cannot be derived from the chart.
That is why breakout strategies can behave differently immediately before scheduled releases.
The “Do Nothing” Zone
Professional execution often includes a period where you deliberately do not trade.
For example, establish a rule that no new position is opened within a certain number of minutes before a major release.
Your data and strategy should determine the exact window.
A scalper may need a wider buffer.
A swing trader may not care about the first few minutes.
The important point is that the rule should be based on your execution model rather than copied from another trader.
What About Trading Immediately After the News?
The first move is often the least comfortable part of the event.
You have a choice.
Trade the initial reaction.
Wait for the first structure to form.
Or avoid the event completely.
For most discretionary day traders, waiting for the first burst of volatility to create structure can dramatically improve decision quality.
Instead of trying to predict the first candle, you observe it.
Then you ask:
Did price continue in the initial direction?
Did it reverse?
Did it create a range?
Did the second push confirm the first?
Did the market reclaim or reject a key level?
Now you have information that did not exist before the announcement.
Waiting is not automatically safer.
It is simply more informed.
The First Move Is Not Always the Real Move
Imagine an inflation release produces:
First move: +40 points
Retracement: -35 points
Second move: +90 points
The first breakout buyer might have been stopped out on the retracement.
After the first reaction, a trader may have waited for it to settle down and entered on the 2nd move with cleaner structure.
This is one reason I prefer studying post-news sequences rather than simply measuring the first candle.
The first move tells you how aggressively the market reacted.
The next structure tells you whether that reaction was accepted.
A Practical News Volatility Score
You can create a simple scoring model before each major release.
5 Things to Start
Base line volatility
Historical range of events.
Expected. Surprise.
Current distribution.
Market Background
They are individually scored from 0 to 2.
A low score indicates normal conditions.
Mid score = more caution.
A high score suggests the situation might not be good for your usual method.
It’s the same scoring system, but it’s consistency that matters.
You’re trying to modify:
“News looks dangerous.”
with:
“Historical range is 3.1 times normal, spread is elevated, and the event has a high probability of producing a large repricing.”
That is a much better trading decision.
Example: Quantifying an NFP Setup
Suppose you trade EUR/USD.
Your normal five-minute range during the session is approximately 8 pips.
Your historical NFP database shows:
Median first-five-minute range: 26 pips
90th-percentile range: 43 pips
Largest observed range: 68 pips
Current spread before release: 1.2 pips
Your normal setup uses a 10-pip stop.
Now consider what this tells you.
A 10-pip stop is only 38% of the median event range.
That means normal NFP movement can easily exceed your normal stop without invalidating the broader trade thesis.
You have learned something important.
Your strategy is not necessarily wrong.
Your stop model is incompatible with the event environment.
That is the kind of distinction that saves traders from abandoning a profitable strategy after a few news-related losses.
Risk Management Must Adapt Before the Entry
The mistake is waiting until after the trade to think about risk.
Before entry, determine:
How far can price realistically move?
How wide is the spread?
What is the historical event range?
Where is the structural invalidation?
How much account risk will remain if the market gaps through the expected entry?
Only then should position size be calculated.
This is where most traders miscalculate risk. A Position Size Calculator removes guesswork by letting you start with the account risk and structural stop distance instead of choosing a position size first.
The proper sequence is:
Market volatility, trade cancellation, stop distance, and position size.
Not:
Desired position size → arbitrary stop → ask
The Stop Should Reflect Market Structure, Not Your Comfort Level
Suppose a trader wants to risk $100.
The technical invalidation requires a $400 position risk.
The trader does not want to lose $400, so they move the stop closer to the market.
Now the stop sits inside normal news volatility.
The trader gets stopped.
Price then moves in the expected direction.
They conclude that the market “hunted their stop.”
Sometimes the market did exactly what the market normally does.
The real problem was that the stop was designed around emotional comfort rather than structural validity.
The solution is either a smaller size, a different setup, or no trade.
Journal News Trades Differently
News trades deserve their own journal category.
A normal technical setup and a CPI setup should not be automatically lumped into the same performance bucket.
Record the event.
Record the scheduled release time.
Record consensus.
Record actual.
Record surprise.
Record pre-news ATR.
Record event range.
Record spread.
Record slippage.
Record entry delay.
Record maximum adverse excursion.
Record maximum favourable excursion.
Then measure the result in R.
After 50 or 100 events, you may discover that your strategy has a very specific volatility profile.
It may perform well after moderate surprises but poorly after extreme ones.
It may perform well on NFP but poorly on CPI.
The first 10 minutes are unprofitable, but the 15- to 30-minute window is excellent.
That information is much more valuable than generic advice about avoiding news.
The Trade Journal Template on DayTradersDiary.com can be adapted for this purpose by adding a dedicated news-volatility section.
Maximum Adverse Excursion Is Essential
If you want to quantify whether your stop is appropriate, track the Maximum Adverse Excursion (MAE).
Suppose you have 100 trades.
Your winners typically experience 7 points of adverse movement before moving toward the target.
Your losers typically exceed 18 points.
Now you have evidence.
A 5-point stop may be unnecessarily tight.
A 25-point stop may be unnecessarily wide.
MAE allows you to study where the market normally invalidates your setup.
News events can dramatically change that distribution.
That is exactly why they should be separated in your database.
Maximum Favourable Excursion Can Improve Your Targets
The same logic applies to the Maximum Favourable Excursion (MFE).
If your post-news trades regularly move 40 points in your favour but you take profit at 12 points, you may be systematically underusing the volatility expansion.
On the other hand, if your target is 60 points and the market typically produces only 25 points after the initial reaction, your target may be unrealistic.
News volatility creates opportunity.
But opportunity must be measured.
A Useful Distinction: Volatility Expansion vs Directional Edge
This distinction can save you from one of the biggest mistakes in news trading.
Higher volatility does not automatically mean better directional opportunity.
A market can move 100 points and still be extremely difficult to trade.
Why?
Because it can move 50 points up, 70 points down, and then 40 points back up.
That is volatility without a clean directional structure.
Your objective is not to maximize exposure to volatility.
It is to find volatility that your strategy can exploit.
When News Volatility Should Make You Trade Smaller
Some traders believe that volatility means they should increase their position size because more profit is available.
That logic is backwards.
If expected movement increases while your account-risk percentage remains fixed, your position size should generally decrease as the stop required by market structure widens.
The opportunity is larger.
The unit size should often be smaller.
That is how you maintain consistency.
When You Should Skip the Trade Entirely
There are conditions where the best quantitative conclusion is no trade.
For example, suppose:
The historical event span is rather large.
Current spread is already high.
Your strategy needs to be executed tightly.
Liquidity is fading.
The release is expected to be market sensitive.
And the structural stop produces a reward-to-risk ratio below your minimum.
There is nothing left to optimize.
The trade does not fit your model.
Skip it.
This is an important psychological shift.
A professional trader does not need to participate in every volatility event simply because it looks exciting.
News Volatility and Market Regime
The same event can produce different results under different market regimes.
A hot inflation report in an environment where inflation is the dominant macro concern may produce a much larger reaction than a similar surprise when markets are focused on another issue.
BIS research into recent markets demonstrates that changes in policy uncertainty and the geopolitical environment can boost the volatility of financial markets, with certain individual equities sometimes showing much more volatility than broad indices.
The lesson is simple.
Do not build your volatility database without recording the broader regime.
A historical CPI range from a low-volatility year may not be a good estimate for CPI during a period of major inflation uncertainty.
Use Volatility Regimes Instead of One Average
A better model separates events into regimes.
For example:
Low-volatility regime.
Normal-volatility regime.
Elevated-volatility regime.
Shock regime.
You can classify the environment using broader market volatility, recent ATR, index movement, credit conditions, or simply the recent distribution of intraday ranges.
Then compare event behavior within each regime.
This is far more useful than saying:
“CPI usually moves 30 pips.”
It may be possible.
But under what conditions?
That is the question worth answering.
The Psychology of Trading News
News creates a particular psychological problem.
The trader knows something important is coming.
That creates anticipation.
Anticipation creates a desire to predict.
Prediction creates premature entries.
Then the trader spends the final minutes before the release emotionally committed to a direction.
Once the number arrives, confirmation bias takes over.
Every tick supporting the thesis feels meaningful.
Every tick against it is so short lived.
That’s why I like to separate the pre-news analysis from the post-news implementation.
Pre-define scenarios before going live.
Do not define certainty
For instance:
“If the number is a big surprise and price breaks the pre-news range I will look for continuation.
“If price initially breaks higher but returns inside the range, I will watch for failure.”
“If the reaction is too violent for my execution model, I will stay out.”
Now you have conditional logic.
You are no longer trying to predict the headline.
Build a Scenario Map Before the Release
A simple scenario map can contain three outcomes.
Continuation scenario: News causes a strong directional move and price breaks through a significant level.
Reversal Scenario: First move fails, and price retraces through the breakout formation.
No-trade scenario: Too much chaos in volatility, unacceptable spreads, or price remains locked within a broad reaction range.
The third scenario is critical.
Without it, traders unconsciously force every news event into either a bullish or a bearish camp.
Sometimes the correct interpretation is simply that the market is not offering a clean trade.
Internalize the Difference Between “Fast” and “Good”
A fast move is not necessarily a good trade.
A slow move is not necessarily a bad trade.
News often makes traders feel that they must act immediately.
But speed is only useful if the execution quality remains acceptable.
If the price moves 30 points while your order is being processed, the market may already have consumed the reward that justified the trade.
This is why entry delay should be measured in both time and price.
A five-second delay means almost nothing in a quiet market.
A five-second delay during a major release can completely alter the trade.
Scaling a Proven News Strategy
Eventually, a trader who has developed a measurable edge faces another problem.
Capital.
You can have disciplined execution, positive expectancy, and a well-tested news volatility model, yet still be constrained by the amount of personal capital you are comfortable risking.
That is where evaluation programs can become relevant.
The purpose should not be to use an evaluation account as a shortcut to compensate for an untested strategy.
Apply a strategy that has already survived your own research under defined risk conditions.
For example, The5ers today has programs with clear drawdown guidelines and scaling up procedures. Its High Stakes program has a maximum daily loss of 5%, 10% maximum loss, rising with performance. It also presently allows position-holding in news, but not order execution around specific high impact releases on that program.
That last point is particularly relevant to this article.
If your strategy specifically depends on entering immediately around a major release, program rules can materially affect whether an evaluation is suitable.
Other firms structure their programs differently, and some products permit different approaches to news or overnight exposure.
So evaluate the rules against your strategy, not the advertised account size.
If you’re a trader with a journal that displays a solid edge, consistent risk control and the capacity to work within prescribed boundaries, looking into a The5ers review can be a decent professional route to scaling.
The objective is not to chase a larger account.
The objective is to prove that your existing process can survive larger capital constraints without changing its behavior.
The 5ers is not a Substitute for a Tested Edge
This distinction deserves emphasis.
If you cannot quantify your news exposure on a $5,000 account, a larger evaluation account will not solve the problem.
It will magnify it.
A trader who doubles position size during CPI because the market is moving quickly has not developed a volatility strategy.
They have developed a volatility reaction.
Serious scaling starts when the trader can answer:
How much does this event normally move?
How wide does my stop need to be?
How much should my position size change?
How much slippage can I tolerate?
At what point do I stop trading?
Those are professional questions.
The Complete Pre-Entry News Volatility Process
Before every major event, establish your normal range.
Then calculate the historical event range.
Compare the two.
Estimate the likely volatility multiplier.
Check the expected-versus-actual framework for the release.
Review the broader market regime.
Check current spread and liquidity.
Mark the important technical levels.
Define your structural invalidation.
Calculate the required stop distance.
Reduce position size if necessary.
Define the maximum acceptable slippage.
Create your continuation, reversal, and no-trade scenarios.
Then wait.
That last step is important.
The market does not owe you a trade because you prepared for one.
A Simple Worked Example
Imagine a Nasdaq futures trader preparing for CPI.
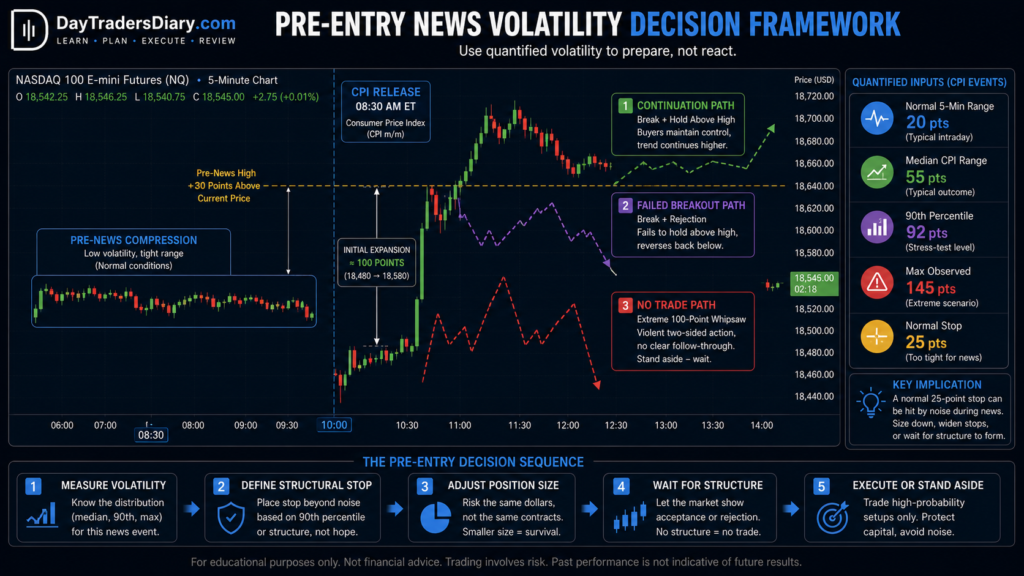
The normal 5-minute range is 20 points.
Historical CPI data shows:
Median first-five-minute range: 55 points
90th-percentile range: 92 points
Largest observed range: 145 points
The current spread is normal.
The market has been trending higher for two hours.
A key pre-news high sits 30 points above the current price.
The trader’s normal stop is 25 points.
The temptation is to trade the breakout.
But the data says something important.
A normal CPI reaction already exceeds the trader’s ordinary stop by more than two times.
The trader, therefore, decides that the normal setup is not appropriate immediately at the release.
Instead, the plan is to wait for the first reaction.
If price breaks the pre-news high and holds above it after the initial expansion, a continuation setup may develop.
If the price breaks the high and then quickly falls back through it, the trader will consider it a failed breakout.
If the first five minutes produce a 100-point range with erratic reversals, the trader stands aside.
Notice what happened.
The volatility calculation did not predict direction.
It improved the decision about when and how to trade.
That is the real purpose of quantifying news volatility.
What to Track for the Next 50 News Events
To transform that idea into a real advantage, gather enough observations to test it.
For each record of an event:
Event title.
Time scheduled.
Consensus Forecast
Expected result.
Degree of surprise.
Pre-news ATR.
One-minute range.
Five-minute range.
Fifteen-minute range.
Thirty-minute range.
Maximum excursion.
Spread before release.
Maximum spread.
Entry slippage.
Direction of the first move.
Direction of the second move.
Whether the first move held.
Your entry.
Your stop.
Your target.
MAE.
MFE.
Final result in R.
After 50 events, patterns should begin appearing.
After 100, some patterns may become statistically useful.
You can then stop saying, “News is crazy.”
You can start saying:
“My strategy performs poorly when five-minute event range exceeds four times baseline volatility.”
That is actionable.
The Most Valuable Number May Be Your Avoidance Threshold
Most traders focus on finding the minimum volatility required to trade.
I also recommend finding your maximum acceptable volatility.
Suppose your strategy works well when the event multiplier is between 1.5 and 3.0.
Above 3.5, quality execution is zero.
Then 3.5 is your threshold for avoidance.
That figure may boost your profitability more than some other entry indicator.
You are creating the conditions for when your advantage goes away.
That is what mature trading looks like.
Frequently Asked Questions
What does it mean to quantify news volatility?
It means measuring how much an instrument typically moves in response to a specific economic or market event and comparing that movement with its normal volatility. Useful measurements include ATR, event range, volatility multipliers, spread, slippage, MAE, and MFE.
How can I measure news volatility before entering a trade?
Begin with the regular range of the instrument on your execution timeframe. Then compare to historical ranges around similar announcements. In the present dispersion, event surprise, and wider market volatility environment, add to see if your typical trading architecture still makes sense.
What is a news volatility multiplier?
A news volatility multiplier compares the historical range around an announcement with the instrument’s normal range. For example, if a normal five-minute range is 10 points and the typical news range is 30 points, the multiplier is 3.0.
Should I avoid trading before major news?
Not necessarily. The right choice will depend on your plan and past facts. However, traders should be aware that the market can abruptly switch its volatility regime around significant releases, which can render normal stops, objectives and execution assumptions inappropriate.
Does ATR work for measuring news volatility?
ATR is beneficial for a baseline, but should not be used as a complete news-volatility model. Additional information is available from ranges of historical events, dispersion, slippage, surprise size and post-news behavior.
Should position size change during news?
As the structural stop grows with volatility , the same account risk percentage typically means a smaller position size . The objective is to maintain risk steady, not to keep the quantity of shares, contracts or lots constant.
Is the first move after news usually the best trade?
Not necessarily. The first move can be fast and directional, but it can also reverse sharply. Waiting for the first reaction to establish structure can provide additional information about whether the market is accepting or rejecting the initial repricing.
How can I know whether a news event is too volatile for my strategy?
Create an avoidance threshold using your historical data. For example, if your strategy consistently deteriorates when event volatility exceeds three or four times its normal baseline, you can use that threshold to reduce exposure or remain flat.
Final Takeaway
The biggest mistake in news trading is thinking the problem is predicting the headline.
It is not.
The real problem is understanding how the headline can affect your trading environment.
Before the release, the market had a volatility distribution.
After the release, it may have another.
Your stop may need to change.
Your position size may need to change.
Your expectations for execution may need to change.
Sometimes your entire strategy needs to stay out.
That is why I challenge you to do one thing over your next 20 major news events.
Stop recording only whether the trade won or lost. Start recording how much the market moved.
Measure the first minute.
Measure the first five minutes.
Measure the first thirty minutes.
Record the surprise, spread, slippage, MAE, and MFE.
Then compare those numbers with your normal volatility.
You will eventually discover something important.
The best news traders are not necessarily the ones who predict news correctly.
They are the ones who understand how much uncertainty their strategy can afford before entering.
That is the edge worth building.
For the next step, continue with DayTradersDiary.com’s article on entry delay risk. News volatility and entry delay are closely connected because a setup can remain technically valid while becoming financially unattractive after only a few seconds of adverse price movement.