
Moving a stop to break-even feels like the safest thing a trader can do.
You take a trade, price moves in your favor, and suddenly the original Risk starts bothering you. So you move the stop to the entry.
A few minutes later, the price pulls back.
Your trade closes at break-even.
Then the market turns around and heads straight back to your original target.
It is one of the most frustrating experiences in day trading because technically, you did everything “right.” You protected the trade. You avoided a loss. You followed your risk rules.
But you still lost the opportunity.
The problem is usually not the idea of a break-even point.
It is where and when the stop was moved.
A break-even stop should not be an emotional response to seeing green P&L. It should be a calculated adjustment based on what price has already proven.
That is where micro adjustments become useful.
Instead of instantly moving your stop to the exact entry price, you can gradually reduce Risk as the trade develops while leaving enough room for normal market movement.
What Is a Break-Even Point?
A break-even stop is a stop-loss moved close to the original entry price after a trade has moved favorably.
The basic idea is simple.
You risk $100.
The trade moves sufficiently in your favor.
You move the stop so that the original $100 risk is largely removed.
If the price reverses, the position closes with little or no loss.
The problem is that markets rarely move in straight lines.
Even strong trends pull back.
That means an entry price is not necessarily a logical technical level for a stop.
Sometimes the market needs to revisit that area before continuing.
A break-even stop placed too early can turn a good trade into a scratch trade.
Why Break-Even Stops Can Hurt Good Trades
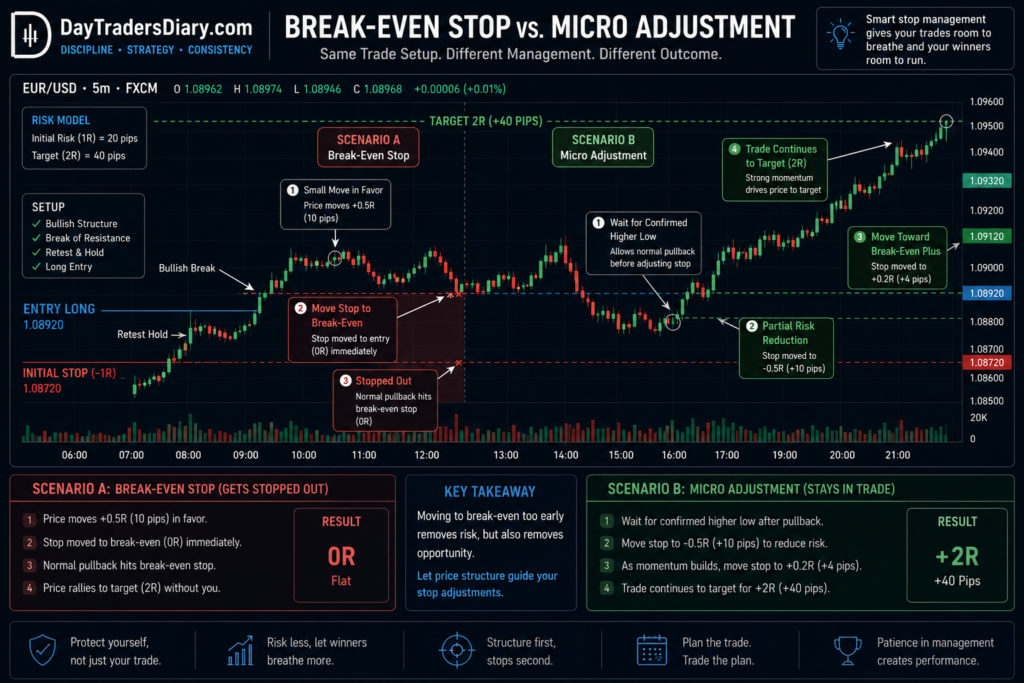
Consider a EUR/USD long entered at 1.1000 with an initial stop at 1.0985.
Your initial Risk is 15 pips.
Price rises to 1.1010.
You feel comfortable because the trade is now +10 pips.
You immediately move the stop to 1.1000.
Price pulls back to 1.0999.
You’re out.
Five minutes later, the price reaches 1.1030.
Your analysis was correct.
Your entry was correct.
Your target was correct.
Your stop management was the problem.
The market did not invalidate your trade idea.
It simply retraced farther than your new stop allowed.
This distinction is extremely important.
Research Shows Why Stop Placement Requires Care
When the stop price is hit, stop orders turn into market orders; in fast-moving markets, the execution price may differ from the stop price, according to the SEC’s website, Investor.gov. It also advises that short-term price moves can lead to stops being triggered unexpectedly.
That matters for day traders because a break-even stop is not magically protected from market noise.
Research published in the Journal of Behavioral and Experimental Finance also found that stop-loss rules can reduce the tendency to hold losing positions. Still, the effect on performance depends heavily on how the stop is structured. In other words, using a stop is not automatically beneficial if the placement itself is poorly designed.
Research on stop-loss decisions in the context of behavioral preferences and optimal stopping has also been published in the Journal of Economic Theory. The important practical lesson is that leaving is a decision that depends on probabilities and the trade structure, not just a decision to avoid discomfort.
For a day trader, this leads to a useful principle:
Protect Risk when the market gives you evidence, not merely because the trade turns profitable.
The Difference Between Break-Even and Break-Even Plus
There are actually three different approaches that traders often confuse.
The first is exact break-even.
You move the stop directly to your entry price.
The second is break-even plus.
You move the stop slightly beyond entry to cover some transaction costs or lock in a small gain.
The third is a structural break-even adjustment.
You move the stop based on the latest market structure, which may place it above or below the original entry depending on the trade.
The third approach is usually more useful for discretionary day traders because it respects the way the price actually moves.
What Are Break-Even Micro Adjustments?
Micro-adjustments are small changes to your stop as new information emerges.
You are not moving the stop every time the price ticks in your favor.
You are waiting for specific evidence.
For example, start with a 20-pip stop.
Price moves +10 pips.
You do nothing.
Price breaks resistance and holds above it.
You now have evidence that the market has accepted higher prices.
Instead of moving the stop all the way to the entry, you might reduce the remaining Risk by moving the stop from 20 pips to 8 pips.
Later, the price forms a higher low.
Now you can tighten again.
The stop evolves with the trade.
That is the basic idea behind break-even micro adjustments.
The Break-Even Micro Adjustments Formula
A useful framework is to express your stop adjustment as a percentage of the original Risk.
Let:
Initial Risk = R
Maximum Protected Risk Reduction = P
Then:
Adjusted Risk = R × (1 − P)
For example, suppose your original Risk is 20 pips.
After the trade reaches a meaningful milestone, you decide to remove 50% of the original Risk.
Your adjusted Risk becomes:
20 × (1 − 0.50) = 10 pips.
You have not moved all the way to break-even.
But you have halved the downside exposure.
Once another structural milestone is reached, reduce the remaining Risk again.
The important part is that the adjustment is triggered by market information rather than emotion.
A Practical Break-Even Analysis Example
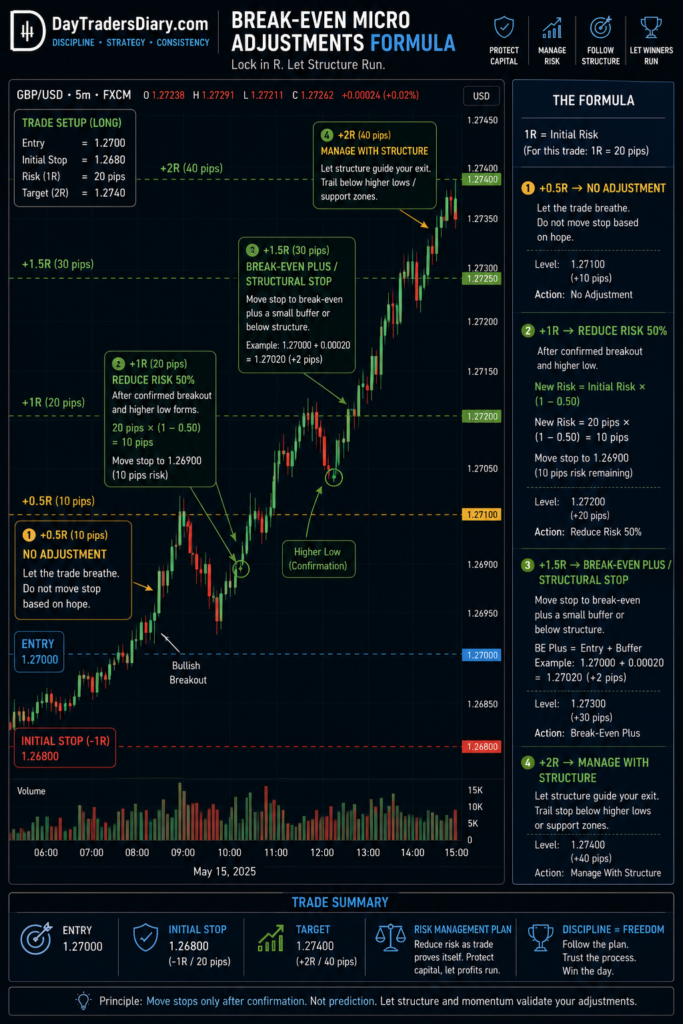
Suppose you buy GBP/USD at 1.2700.
Your initial stop is 1.2680.
Your target is 1.2740.
That gives you 20 pips of initial Risk and 40 pips of potential reward.
Your planned trade is 1:2 risk-to-reward.
Price first reaches 1.2710.
That is only +0.5R.
There is not enough evidence to justify moving the stop.
Price then breaks a nearby resistance level and closes above it.
Now the trade has reached approximately +1R and has created a new short-term higher low around 1.2708.
This changes the structure.
Instead of leaving the stop at 1.2680, move it to 1.2695 or 1.2700, depending on the setup.
The trade now carries substantially less downside.
Later, the price reaches 1.2725 and forms another higher low.
The stop can be adjusted again.
Notice what happened.
The stop was not moved because the trade was profitable.
It was moved because the market produced new evidence.
That is the difference between emotional break-even management and structured break-even management.
When Should You Move the Stop to Break-Even?
There is no single pip number.
A hard and fast rule like “always move to break-even after 10 pips” seems objective but does not account for volatility and market structure.
Ten pips is a tremendous move on one setup and meaningless noise on another.
Instead, consider three conditions.
First, the price should have moved far enough to prove the original entry is working.
Second, the market should have created some structural evidence in your favor.
Third, the probability of a normal retracement reaching your adjusted stop should be acceptably low.
When those conditions are present, reducing Risk makes more sense.
Use R-Multiples Instead of Fixed Pips
One of the easiest ways to improve break-even management is to stop thinking exclusively in pips.
Think in R.
If your initial Risk is 20 pips, then 1R equals 20 pips.
A move of 10 pips equals +0.5R.
A move of 20 pips equals +1R.
A move of 40 pips equals +2R.
This makes your trade management adaptable across different volatility environments.
A trader risking 8 pips and another risking 30 pips can use the same management framework because both measure progress relative to their initial Risk.
Micro Adjustments Should Follow Structure
Structure offers your stop a purpose for moving.
For a long trade you can use:
Higher. A new low.
Confirmed breakout and retest.
A rejection from assistance is powerful.
A successful liquidity sweep followed by continuation.
For a short trade, the logic reverses.
A new lower high.
A confirmed breakdown and retest.
A rejection from resistance.
A failed liquidity sweep followed by bearish continuation.
This is why break-even management should be connected to price action rather than treated as an isolated risk-management technique.
Our article, How To Measure Trend Slope Properly, is particularly relevant here because a strong trend often allows for wider structural breathing room than a weak or sideways market.
Don’t Move the Stop During the First Impulse
Often the initial move after entering is the most deceiving.
Your way price can soar swiftly, making the deal look safe right away.
The market then reverses and tests the breakout.
If you moved the stop during that first impulse, you may have positioned it directly inside the natural retracement zone.
This is one reason I prefer waiting for the market to prove that the move has been accepted.
A candle moving quickly is not the same thing as a structure changing.
Use ATR to Estimate Normal Noise
Average True Range can help you estimate how much movement is normal for the instrument and timeframe.
Suppose your five-minute ATR is 8 pips.
A stop adjustment that leaves only 2 pips of breathing room may be extremely vulnerable to ordinary volatility.
This doesn’t mean your stop must equal ATR.
It simply gives you context.
Your stop should be far enough away from random noise while still protecting the trade after meaningful confirmation.
The Hidden Cost of Break-Even Stops
A break-even stop feels like it cannot hurt because you are not losing money.
But there is an opportunity cost.
Suppose your strategy normally wins 45% of the time with an average winner of 2.2R.
If premature break-even stops convert a portion of your potential winners into scratches, the average winner can decline significantly.
Your win rate looks better, while your expectancy worsens.
That is why you should never judge break-even management simply by asking:
“How many losses did I avoid?”
Ask:
“How much profitable movement did my stop management prevent me from capturing?”
That question is much more revealing.
Risk Management Comes Before Stop Optimization
Micro adjustments should never compensate for oversized positions.
If you feel an overwhelming need to move your stop to break even because the open loss makes you uncomfortable, your original position size may already be too large.
This is where most traders miscalculate Risk. Using a Position Size Calculator removes guesswork and helps determine position size from the initial stop distance and predefined account risk.
Your stop should be placed where the trade idea becomes invalid.
Your position size should then be calculated around that stop.
Not the other way around.
Build a Simple Stop Adjustment Routine
Before entering, define the original invalidation point.
Then identify the first price milestone that would justify reducing Risk.
Next, decide what percentage of the original Risk you will remove at that milestone.
Finally, define what market structure would justify moving the stop to true break-even or into profit.
For example:
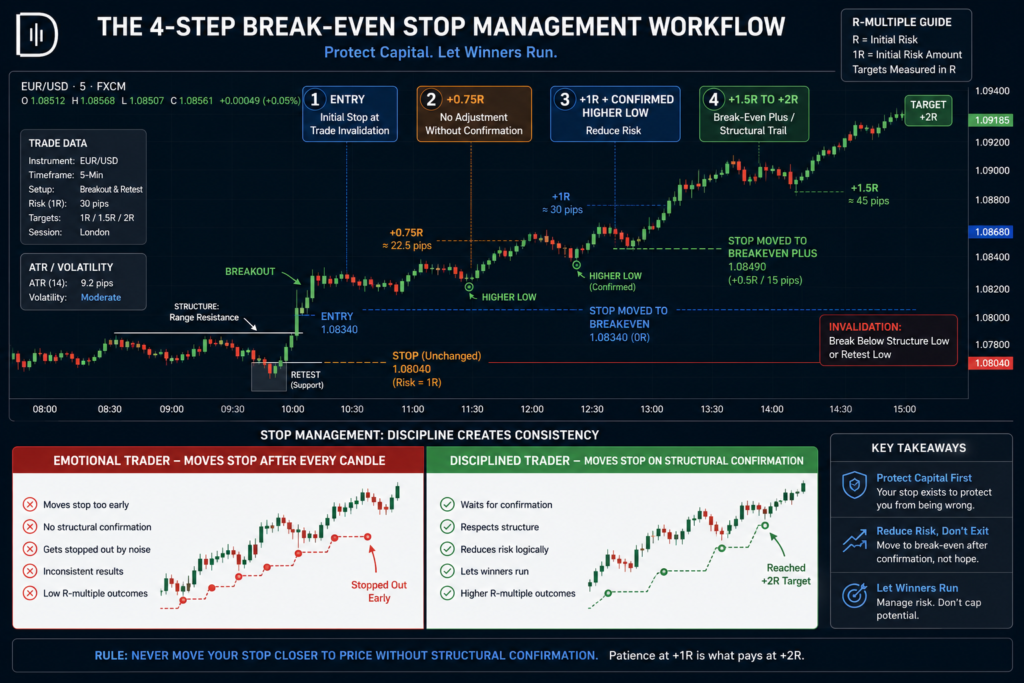
First stop: 1R
+0.75R: no adjustment unless structure warrants.
Proven structure at +1R: Reduces risk by 50%.
At +1.5R with another higher low: move stop to approximately break-even plus.
At +2R: Exit the remainder of the trend structure.
The exact numbers should come from your own testing.
The important thing is to have the rule in place before emotions arise.
Don’t Turn Micro Adjustments Into Constant Management
There is another trap.
Once traders discover micro adjustments, they sometimes become obsessed with moving the stop.
Price moves one pip.
Stop moves.
Price moves another two pips.
Stop moving again.
That is not sophisticated management.
It is nervous management.
The goal is not to minimize every tick of Risk.
The goal is to respond to meaningful information.
If the market has not changed structurally, your stop probably doesn’t need to change either.
Journal Every Stop Adjustment
Your trade journal should record more than the final result.
Record the original stop.
Record when the first adjustment occurred.
Record why you moved it.
Record the R multiple at the time.
Record whether the stop was eventually hit.
Then compare the result with what would have happened if you had left the original stop untouched.
This creates a powerful counterfactual analysis.
You may discover that your first break-even adjustment consistently happens too early.
Or you may find that reducing Risk around +1R dramatically improves your emotional control without damaging expectancy.
Your Trade Journal Template can be adapted to capture these details and turn stop management into something you can actually test.
Measure the Right Performance Metrics
Do not judge your break-even strategy using win rate alone.
Track the percentage of trades stopped at break-even.
Track how many break-even trades subsequently reached the original target.
Track average winner.
Track average loser.
Track maximum favorable excursion.
Track maximum adverse excursion.
Most importantly, compare the expectancy before and after introducing micro adjustments.
That tells you whether the technique is actually improving your trading.
A safer management guideline that decreases expectations is not better.
Psychology: Why Traders Move Stops Too Early
Break-even management is often a technical guideline, but a psychological issue.
Once a trade becomes profitable, traders become protective.
The original Risk suddenly feels unacceptable.
The mind starts thinking:
“I don’t want this winner to become a loser.”
That sounds reasonable.
But the market doesn’t care about your current P&L.
If the trade requires a normal pullback to continue, protecting an unrealized profit too aggressively can interfere with the strategy.
The answer is not becoming emotionally detached overnight.
The answer is creating rules that remove the decision from the emotional moment.
Scaling Your Trading Without Changing Your Process
A repeatable stop-management system becomes particularly valuable when you begin trading larger capital.
The goal is not to make every trade risk-free.
The goal is to keep your decision process consistent as account size increases.
This is one reason traders exploring evaluation programs such as The5ers, FTMO, and FundedNext should pay attention to execution rules rather than focusing exclusively on account size or profit targets.
A trader who can consistently manage Risk, respect invalidation levels and avoid emotional stop modifications has a far stronger base to scale from.
If your journal reveals that your technique is still profitable with diligent stop management, a The5ers evaluation account can be a logical next step to get access to larger trading capital. Consider the review as a test of your present process, not as a shortcut to profitability.
Common Mistakes With Break-Even Points
The most typical mistake is to change the stop to entry on a modest favorable move.
The third option is to use a fixed pip threshold throughout all market conditions.
Some traders move their stops because they are afraid of losing unrealized profits.
Others tighten the stop after every candle without considering market structure.
Another problem is ignoring spread, commissions, and slippage when defining “true” break-even.
Finally, traders often optimize their stop management from a handful of trades rather than a meaningful sample.
Good stop management needs evidence.
Final Thoughts
A break-even stop should not be a reflex.
It should be a response to information.
The market gives you clues through structure, momentum, volatility, and follow-through. Your job is to decide when those clues are strong enough to justify reducing Risk.
Micro adjustments give you a middle ground between two extremes.
You don’t have to leave the original Risk untouched until the target.
You also don’t have to drag the stop to enter the moment the trade turns green.
You can reduce exposure gradually while allowing the trade enough room to behave normally.
For the next 30 trades, test one specific rule.
Do not move your stop simply because the trade reaches a certain profit.
Move it only when your predefined structural condition occurs.
Then compare those results with your normal break-even approach.
That experiment may tell you more about your trading than another month of adding indicators.
For your next read, continue with How To Measure Trend Slope Properly and study how trend strength can help determine when a trade deserves more room and when tighter protection makes sense.
Frequently Asked Questions
What is a break-even stop in trading?
A break-even stop is a stop-loss moved closer to the entry price after a trade moves favorably. The purpose is to reduce or eliminate the original financial Risk if the price reverses.
What are break-even micro adjustments?
Micro adjustments of the break-even are minor rule based adjustments to a stop as a trade progresses. The trader does not immediately move the stop close to the entry, but instead gradually reduces the risk as the price gives confirmation.
When should I move my stop to break-even?
It’s best to wait for some solid signs such as a confirmed breakout, fresh market structure or a positive momentum shift. With changing volatility a set pip target is less reliable.
Is moving a stop to break-even profitable?
It can be but not necessarily. Early stopping leads to premature exits and lower average number of winning deals. The technique should be tested by expectancy, not by the quantity of losses avoided.
What is a good break-even adjustment formula?
A simple structure is:
Adjusted Risk = Base Risk x (1 – Risk Reduction %)
For example if the original Risk is 20 pips and you want to half it then the Risk is now 10 pips.
Should I use ATR when adjusting my break-even stop?
ATR can provide useful context about normal market volatility. It can help prevent placing a stop so close that ordinary price fluctuations trigger the position, but it should be combined with an assessment of the market structure.
Why do break-even stops get hit before the price reaches the target?
Markets tend to pause before they go forward. If you put the stop too close to the entry, normal pullbacks can knock you out of the position even if the original trade assumption is still valid.
How can I know whether my break-even strategy is working?
Break-even, next price move, average winners, average losers, maximum favorable excursion, expectation. Compare those outcomes to your initial stop-management strategy over a meaningful sample of trades.