
Most traders believe they can spot a trend by asking one simple question.
Price rising or falling?
That is OK until the market starts making greater highs while momentum slowly dissipates. “Your moving averages still point up, trendline appears solid, but every breakout fails. Then, eventually, the market turns around, and you are asking why the chart never told you.
The warning was there.
You weren’t measuring the trend correctly.
One lesson that separates experienced traders from developing ones is understanding that a trend is more than direction. A trend also has strength, speed, and quality. Two charts can both be moving higher, but one is attracting aggressive institutional buying while the other is simply drifting upward with weakening participation.
The difference is often visible in the trend slope.
Learning how to measure trend slope properly helps traders avoid chasing exhausted moves, identify healthy trends earlier, and stay aligned with momentum rather than react after the market has already changed.
What Is Trend Slope?
The trend slope is the change in price over a particular period.
A steep slope upward suggests buyers are pushing prices up quickly.
A modest slope indicates buying pressure but not much urgency.
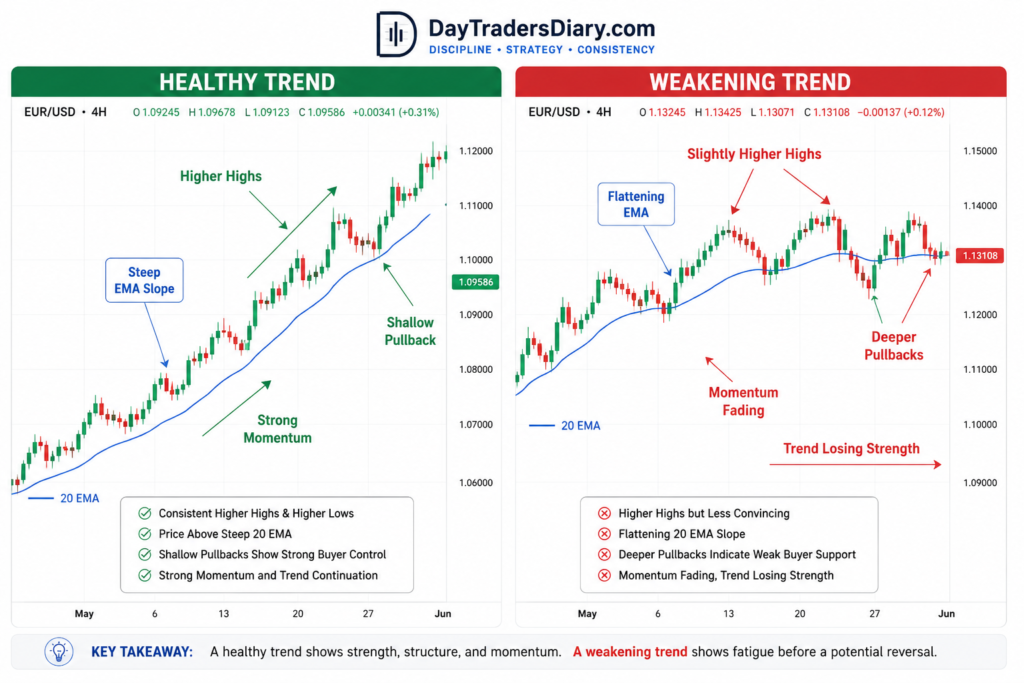
A flattening slope often signals that momentum is fading, even if the price continues making new highs.
Many traders confuse direction with strength.
A market can remain in an uptrend while becoming progressively weaker.
Likewise, a market can experience a temporary pullback while maintaining a strong underlying trend.
Understanding slope helps distinguish between those two situations.
Why Most Traders Misread Trend Strength
Many traders judge trends visually.
If the chart appears to rise at a noticeable angle, they assume the trend is healthy.
The problem is that chart scaling changes everything.
Zooming in or out can dramatically alter the visual angle of price movement.
The same trend may seem steep on one screen and flat on another.
That’s why professional traders don’t rely on visual perceptions.
They look at objective factors such as market structure, moving-average behavior, volatility, and momentum.
Multiple lines of evidence are better for measuring slope than a single visual observation.
Research Supports Trend-Based Analysis
The CMT Association says trend analysis should be based on price behavior, momentum, and confirmation procedures, not one signal.
According to the Corporate Finance Institute (CFI), moving averages smooth out market noise and reveal the underlying directional movement. They are useful for assessing trend quality rather than just direction.
The CME Group also highlights that combining trend analysis with volatility and market participation improves trading decisions across different market environments.
For active traders, the takeaway is clear.
Multiple confirming factors support a strong trend.
Slope is one of those factors, not the entire story.
Start With Market Structure Before Indicators
The first measurement of trend slope should come from the price itself.
Ask straightforward questions.
Are the swing highs becoming higher and higher?
Are pullbacks getting shallower?
“Do buyers come back fast following corrections?
There’s a constant pattern to healthy trends.
When higher highs become smaller, and pullbacks become deeper, the slope often weakens long before indicators recognize the change.
Price always deserves the first vote.
Indicators help confirm what the price is already saying.
Use EMA Slope as a Confirmation Tool
Many traders search for an EMA slope indicator, but they often misunderstand what the moving average is actually showing.
An Exponential Moving Average reflects the average price over a selected period while giving greater weight to recent candles.
The angle of the EMA reveals how quickly average prices are changing.
A sharply rising EMA usually indicates accelerating momentum.
A flattening EMA often suggests the market is losing directional strength.
An EMA pointing sideways generally reflects balance rather than trend.
Instead of asking whether the price is above the EMA, ask whether the EMA itself is accelerating, flattening, or reversing.
That question provides far more useful information.
Compare Price Distance From the EMA
Slope becomes even more meaningful when combined with price location.
Suppose price sits far above a steeply rising 20 EMA.
Momentum appears strong.
Now imagine the price remains above the EMA, but the average has started to flatten while candles struggle to make meaningful progress.
The trend still exists.
Its quality is changing.
Many traders enter late in this stage because they focus only on direction.
Professional traders recognize that the slope has already begun slowing.
Combine Trend Slope With Momentum
One mistake traders make is relying entirely on the moving average.
Momentum indicators provide another valuable perspective.
Suppose the EMA continues rising while RSI forms lower highs.
Momentum is weakening.
The trend may be intact, but the conviction is waning.
Similarly, when both the EMA slope and momentum strengthen together, continuation is more likely.
No one indicator will forecast future price movement.
Agreement between multiple tools increases confidence.
This principle connects naturally with our guide, How To Avoid False RSI Cross Signals, where momentum confirmation becomes far more important than isolated indicator readings.
Measure Pullback Quality
One of the best ways to evaluate trend slope is by studying corrections.
Healthy trends rarely move in straight lines.
Instead, they alternate between impulse moves and controlled pullbacks.
Ask yourself how the market behaves during corrections.
Do buyers quickly defend support?
Does price remain above key moving averages?
Are pullbacks becoming larger than previous ones?
If corrections continue growing while advances become smaller, the slope is probably weakening.
Many trend reversals begin this way.
Consider Volatility Alongside Slope
Trend slope is not separable from volatility.
A sharp move with volatility increasing is frequently a sign of real participation.
A steep move under thin liquidity may revert just as rapidly.
Average True Range (ATR) is a useful background here.
If the price moves higher and the ATR widens a little, the trend is often healthy and vigorous.
Higher prices are good, but if the price hardly moves and ATR contracts, momentum may be fading.
Direction and involvement are both important for trend quality.
Build a Trend Slope Framework
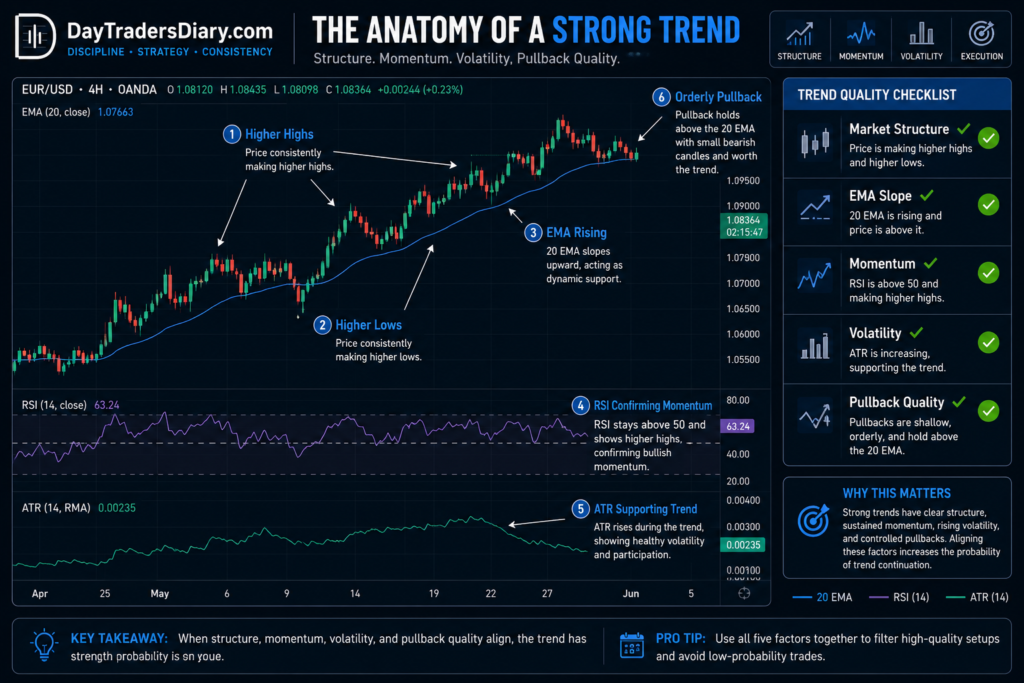
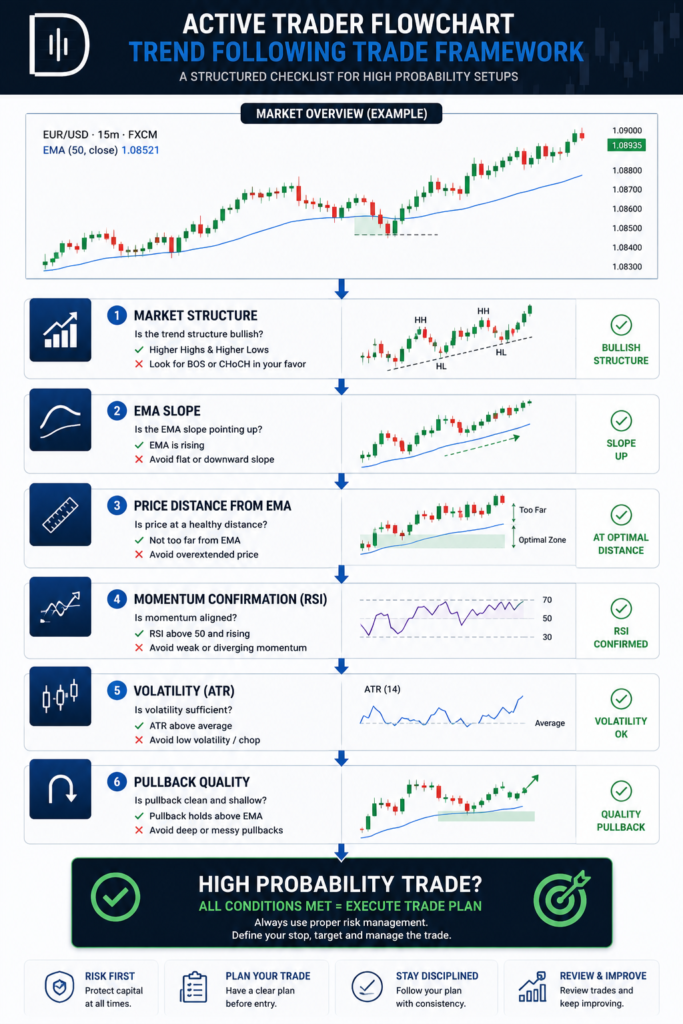
Rather than asking whether the trend looks strong, evaluate it systematically.
Start with a higher time frame market structure.
Look for swing highs and swing lows.
See the slope of your major EMA.
Take the price and subtract the moving average from it.
Check the momentum to see if this confirms the move.
Measure volatility.
Finally, ask if the recent pullbacks are still orderly.
When most of these criteria come together, trend quality usually improves.
If a few go down the slope at the same time, you should be careful.
This transforms trend analysis from opinion to technique.
Why Trend Slope Alone Is Not Enough
The steep slope typically draws traders, because it seems powerful.
Paradoxically, very steep trends are often fragile.
Markets cannot keep on going up forever.
And then the taking of profits begins.
Momentum drags
Liquidity changes.
Most of the best opportunities come after a good pullback in an existing trend, not from dramatic breakouts at peak slope.
Patience usually produces better entries than excitement.
Risk Management Matters More Than Trend Strength
Even the most well-measured trends eventually fail.
“Markets can turn on a dime with unexpected news, institutional repositioning, or changing sentiment.
Strong analysis never eliminates uncertainty.
It simply improves probability.
This is where most traders miscalculate risk. Using the Position Size Calculator removes guesswork by adjusting position size according to your stop-loss distance rather than your confidence in the trend.
Risk management protects your account when even high-quality trend analysis proves wrong.
Turn Trend Analysis Into Measurable Data
Most traders remember obvious trends.
Very few record why they considered those trends strong.
Start recording all the popular transactions.
EMA slope record
EMA slope recording
Evaluation of market structure.
See the conditions of volatility.”
Retract the depth of tracks
Mark, if the momentum confirms the trend.
After a few months, trends will start appearing in your notebook.
The only time you had the highest probability trades was when the EMA slope AND market structure were aligned.
Your biggest losses have been when you chased sharp trends following long moves.
These insights become your personal advantage.
Our downloadable Trade Journal Template makes this process easier by helping you evaluate execution quality rather than focusing only on profits and losses.
Scaling Requires Process, Not Prediction
Pro traders aren’t paid to be right about every trend.
“They are rewarded for being able to manage risk reliably and to exploit good opportunities.”
Evaluation firms such as The5ers, FTMO, and FundedNext look for disciplined execution, repeatable decision-making, and emotional consistency.
Understanding trend slope helps build those qualities by encouraging objective analysis rather than emotional trading.
If your journal shows constant disciplined execution and positive anticipation, a The5ers assessment account can be a reasonable next step in trading larger capital without the need to keep raising your personal investment.
Common Mistakes When Measuring Trend Slope
One common mistake is to judge trend strength only by visual viewpoint.
Another is presuming that a rising moving average guarantees a healthy trend.
Many traders will miss a decline in momentum just because the price keeps setting marginal new highs.
Others pursue the sharpest trends without realizing that fatigue is typically the result of rapid acceleration.
The biggest mistake is to overlook that the trend slope should support not supplant the market structure.
The strongest trading decisions combine both.
Final Thoughts
Learning how to measure trend slope properly changes the way you see the market.
Instead of asking whether the price is moving higher, you begin asking whether buyers are becoming more aggressive or gradually losing control.
That little change increases patience, timing and trade selection.
Not just look at direction for trend analysis over the next 20 trading sessions.
Watch the slope of the price, the action of your EMA, the quality of pullbacks and the intensity of momentum.
You may discover that many trades you once considered attractive were already losing strength before you entered.
For your next read, continue with Using Pivot Confluence Only With Three Conditions to learn how trend strength and confluence together create higher-probability trading opportunities.
Frequently Asked Questions
What is the trend slope in forex trading?
The slope of the price trend shows the speed of changes of prices. It helps traders find the strength of the trend not just the direction.
How do you measure trend slope properly?
Start with market structure and then go into moving averages, momentum indicators, volatility and the quality of pullbacks, not chart angles.
Is an EMA slope indicator useful?
An EMA slope indicator can help visualize momentum changes, but it works best when combined with price action, support and resistance, and higher-timeframe analysis.
Does a steeper moving average mean a stronger trend?
Not really. A steep EMA usually signals strong momentum, although very steep trends can sometimes grow fatigued and subject to reversals.
Why do trend slopes flatten before reversals?
Flattening slopes frequently suggest waning purchasing or selling demand. Slope is an early warning rather than a prediction since momentum slows before price changes direction.
Can beginners use trend slope analysis?
“Yes. Traders can enhance their trend identification and avoid entering weakening markets using basic observations such as greater highs, shallower pullbacks and an increasing EMA.