
Most traders look at volatility after they enter.
That is backward.
They notice the market is moving quickly because their stop is getting hit faster than expected. They realize volatility has collapsed because three trades have gone nowhere. Or they suddenly discover that the breakout they bought occurred after the market had already exhausted most of its normal daily movement.
The better question is not, “How volatile is the market right now?”
It is:
“Is the current volatility normal for this market, this timeframe, and this stage of the trading session?”
That distinction is what makes volatility cones useful.
A volatility cone does not tell you whether EUR/USD is going up or down. It does not give you a magical entry signal. What it can do is show whether the amount of movement currently taking place is unusually high, unusually low, or sitting somewhere inside its historical distribution.
For an active day trader, that information can completely change how a setup should be traded.
A breakout occurring at the upper edge of its normal volatility distribution deserves a very different response from the same breakout occurring after an unusually quiet period.
The goal of this article is to build a practical framework for using volatility cones as a trading filter rather than another indicator sitting underneath your chart.
What Is a Volatility Cone?
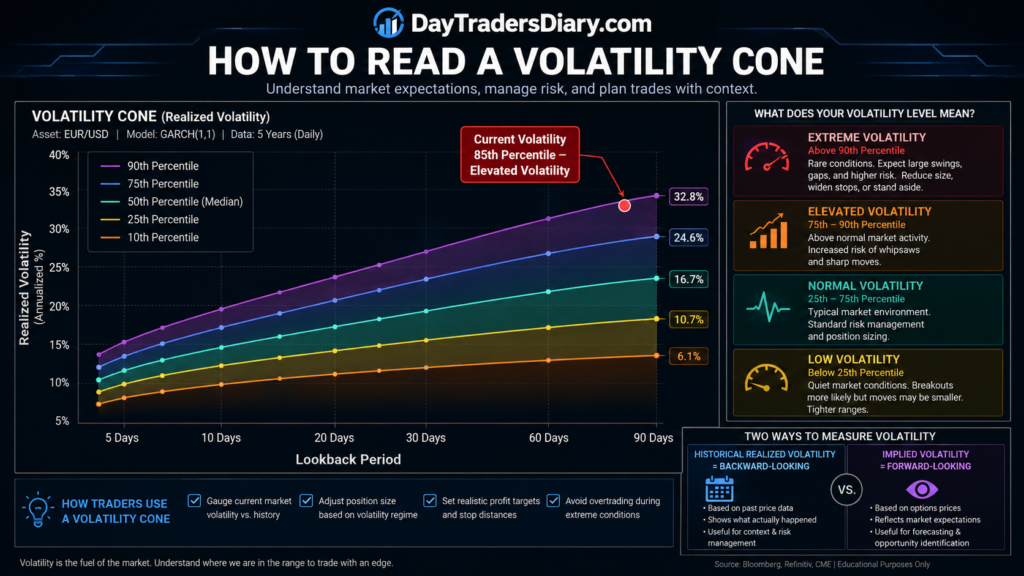
A volatility cone is a visual representation of how volatility has behaved historically across different time horizons.
Imagine calculating realized volatility over several lookback periods, such as 5, 10, 20, 30, 60, and 90 trading days.
Instead of calculating only one average for each period, you examine the distribution.
You might calculate the 10th percentile, median, 75th percentile, 90th percentile, and other statistical boundaries.
Plot those values together, and you get something resembling a cone.
The current volatility reading can then be compared with its historical range.
This matters because an absolute volatility number means very little without context.
Suppose EUR/USD has an annualized realized volatility reading of 7%.
Is that high?
There is no useful answer without knowing what EUR/USD normally does over the same horizon.
If its historical 20-day volatility typically ranges between 5% and 9%, then 7% is ordinary.
If it normally ranges between 3% and 6%, then 7% is elevated.
The cone provides that context.
Why Volatility Cones Are Different From ATR
ATR is extremely useful for day traders, but it answers a different question.
ATR tells you about the average size of recent true ranges.
A volatility cone asks something broader:
Where does the current volatility sit within its historical distribution?
That difference is important.
Imagine the five-minute ATR on an index is rising.
That tells you recent candles are becoming larger.
But it doesn’t necessarily tell you whether today’s volatility is unusually high compared with the market’s normal behavior.
A volatility cone can help answer that second question.
This is one reason volatility cones work better as a regime filter than as a simple entry indicator.
They give you context.
Research-Backed Insight: Volatility Is Not Just a Backdrop
The distinction between expected and realized volatility is fundamental to professional volatility analysis.
The Cboe VIX methodology and resources describe the VIX as a forward-looking measure of expected S&P 500 volatility derived from option prices. Cboe also emphasizes that implied volatility and realized volatility are different concepts.
That distinction matters for day traders.
A volatility cone built from historical realized volatility is looking backward.
The VIX is looking forward.
Neither one is automatically superior.
They answer different questions.
Historical volatility tells you what the market has actually been doing.
Implied volatility tells you what option prices suggest about future volatility.
The interesting situation occurs when those two measures disagree.
For example, imagine realized volatility has been unusually quiet for several weeks while short-dated implied volatility begins rising sharply.
That does not mean a large move must occur.
It does mean the market is pricing greater uncertainty than recent price behavior would suggest.
That is information worth respecting.
Cboe also notes that volatility can exhibit mean-reverting behavior, while the relationship between implied and subsequently realized volatility is not perfect.
For a day trader, this means one important thing:
Do not treat a volatility extreme as an automatic reversal signal.
High volatility can stay high.
Low volatility can stay low.
The cone tells you that the environment is unusual. It does not tell you why it is unusual or what price will do next.
The Most Important Volatility Cone Question
When I look at a volatility cone, I am not immediately asking whether volatility is high or low.
I ask:
Is volatility expanding, contracting, or remaining stable relative to its historical position?
That produces three very different trading environments.
Suppose current volatility sits around the 40th percentile.
That is relatively normal.
If it moves from the 40th percentile to the 70th percentile over several sessions, volatility is expanding.
If it falls from the 40th percentile toward the 10th percentile, volatility is contracting.
The transition often matters more than the absolute number.
This is where many traders make a mistake.
They see volatility at the 90th percentile and immediately think, “It is too high. I should fade it.”
That can be disastrous during a genuine expansion phase.
High volatility can become even higher.
How To Read A Volatility Cone On A Trading Chart
A typical volatility cone chart has time horizons along the horizontal axis and volatility measurements along the vertical axis.
The boundaries represent different historical percentiles.
For example, you have a lower boundary representing the 10th percentile, a middle line representing the median, and an upper boundary representing the 90th percentile.
The current volatility observation is then compared with those boundaries.
Suppose your 20-day realized volatility is sitting near the 85th percentile.
That tells you recent volatility is elevated relative to the historical sample.
Add background now.
If the price breaks a significant weekly resistance level and volume increases, then extreme volatility may confirm an expansion regime.
But if the price is stuck in a mature range and the volatility suddenly leaps to the 90th percentile without any notable directional advancement, the same number could be a sign of unstable conditions rather than a clean trend.
Same volatility.
Different market structure.
That is why volatility cones should not be traded in isolation.
The Volatility Cone Trading Strategy
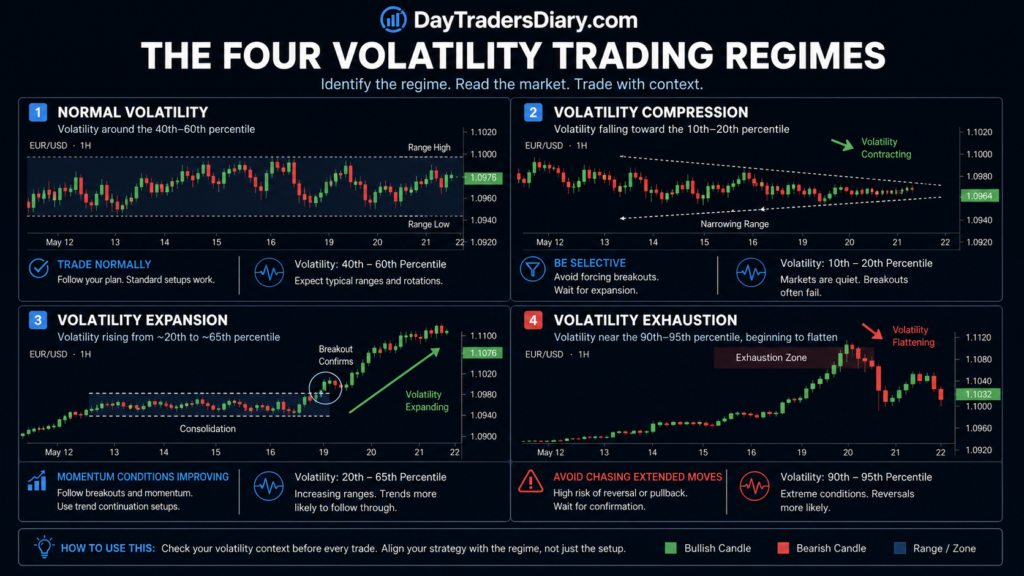
If you want to trade only with volatility cones, I would build the process around four states.
The first is typical volatility.
The second one is volatility compression.
The third is volatility blow-up.
The fourth is volatility fatigue.
They are not hard and fast labels.
They are settings of choice.
Normal Volatility
When volatility sits near the middle of its historical distribution, standard setups can be traded normally.
This is where your baseline strategy has the greatest relevance.
You don’t need to force special volatility rules.
For example, if your EUR/USD breakout system normally performs well when realized volatility sits between the 35th and 65th percentile, that range becomes your baseline regime.
The key is knowing this from testing rather than assuming it.
Volatility Compression
When volatility falls toward the lower portion of the cone, the price is moving less than usual.
That can be dangerous for momentum traders.
Breakouts may fail because there is insufficient participation.
Targets may become unrealistic.
A fixed 30-pip target may make sense in a normal regime, but becomes excessive when current volatility is sitting near historical lows.
Compression can also create opportunity.
Quiet markets sometimes precede expansion.
But there is a major difference between recognizing compression and predicting when expansion will begin.
The cone tells you the first.
It does not guarantee the second.
Volatility Expansion
This is where the framework becomes especially useful.
Suppose realized volatility moves from the 25th percentile to the 65th percentile.
At the same time, the price breaks out of a multi-hour range.
Now the volatility information supports the price action.
The breakout is not occurring inside a dead market.
Movement is expanding.
This is a much stronger environment for momentum strategies.
You might allow winners more room.
You might expect wider intraday ranges.
You might also reduce position size because the stop required by the structure is larger.
That last point is critical.
Higher volatility does not automatically mean more risk per trade.
It often means the opposite.
Volatility Expansion Does Not Mean Buy
This is one of the most important distinctions in the entire strategy.
Volatility is directionless.
A volatility expansion tells you that movement is increasing.
It does not tell you whether the price will move higher or lower.
Cboe makes the same point about the VIX. It is a non-directional measure of expected volatility rather than a directional forecast for the S&P 500.
So if volatility rises sharply, you should not automatically buy.
Instead ask:
Where is the price relative to the major structure?
Is the expansion occurring with a breakout?
Is the market rejecting the breakout?
Is continuation being taken before liquidity?
Is the move happening in the wake of big news?
Are execution conditions & spreads still good?
The setting is the volatility.
“Price tells you the way.
Volatility Exhaustion
This is the area where experienced traders become more careful.
Imagine volatility has climbed into the 95th percentile after several large directional candles.
The market has already traveled an unusually large distance.
A new breakout occurs.
An inexperienced trader sees the breakout and thinks:
“Volatility is high, so this market is moving. I should enter.”
An experienced trader asks:
“How much of today’s movement has already been consumed?”
That question changes everything.
High volatility can create excellent opportunities.
It can also mean the easy part of the move has already happened.
This is where your historical range statistics become useful.
If the market has already traveled 90% of its typical daily range and your setup requires another large expansion, the trade deserves more skepticism.
Not an automatic short.
Just more skepticism.
A Practical Volatility Cone Decision Framework
Before entering a trade, identify the current volatility percentile.
Then compare it with the recent direction of volatility.
Suppose volatility is at the 20th percentile and rising.
That is an early expansion environment.
If volatility is at the 70th percentile and rising rapidly, you may already be in an established expansion.
If volatility is at the 95th percentile and beginning to flatten, you may be approaching an exhaustion zone.
One would anticipate these three conditions to produce distinct expectations.
The first setting might reward anticipating break outs.
The second may be disposed to continuance,
The third may demand more selective entries and a quicker detection of failed moves.
This is much more useful than simply saying “high volatility” or “low volatility.”
Example: EUR/USD London Breakout
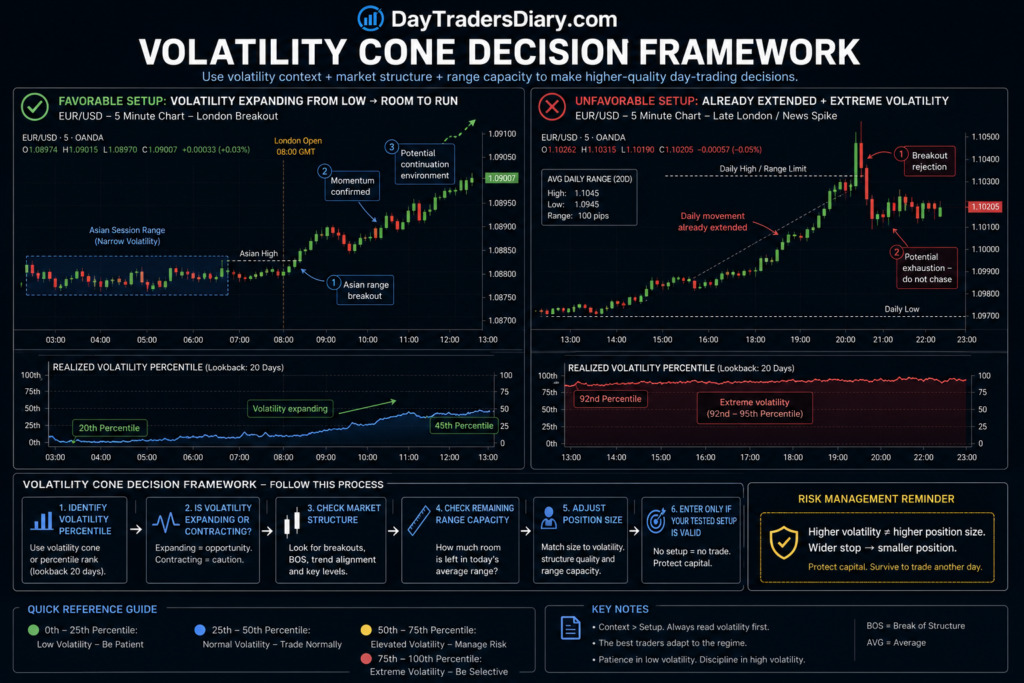
Imagine EUR/USD spends the Asian session inside a narrow range.
Historical volatility is sitting near the 20th percentile.
London opens.
Price breaks the Asian high.
Five-minute ranges begin expanding.
Volatility moves from the 20th toward the 45th percentile.
The breakout holds.
This is an attractive expansion setup because volatility is increasing from a compressed state.
Now change the scenario.
Volatility is already at the 92nd percentile before London opens.
Price has already traveled most of its typical daily range.
London breaks the Asian high.
The first candle is huge.
Price immediately rejects.
That is a completely different setup.
The breakout may represent exhaustion rather than the beginning of expansion.
Same London breakout.
Completely different volatility context.
Volatility Cones And Timeframes
A volatility cone should always be connected to the timeframe of your strategy.
A five-minute trader should not unthinkingly use a volatility measurement designed for a multi-week holding period.
That is one of the easiest ways to misuse the concept.
The timeframe should answer the question you are actually trying to solve.
If you trade intraday momentum, you might care about recent realized volatility over short horizons.
If you hold positions for several days, longer horizons become more relevant.
This connects directly with our DayTradersDiary guide on What Time Frames Do Day Traders Use?, because volatility statistics only become meaningful when they match the timeframe of the trading decision.
Don’t Build The Cone Around A Convenient Lookback
Another common mistake is choosing a lookback because it makes the chart look clean.
A 20-day volatility cone may work for one strategy.
A 60-day sample may work better for another.
The right question is:
Which historical window gives me enough observations to describe the market regime without becoming so slow that it misses structural changes?
That is something you test.
For example, a 100-day history may provide a stable distribution but react slowly to a major market regime shift.
A 10-day history responds quickly but may be dominated by a handful of unusual sessions.
There is always a tradeoff between stability and responsiveness.
The Cone Should Be Tested, Not Admired
This is where many traders fall into indicator collecting.
They create a beautiful volatility cone.
They add percentile bands.
They add colors.
Then they start making decisions from it.
That is not analysis.
You need to test whether the volatility state actually changes the performance of your setup.
Suppose your strategy has a 48% win rate overall.
Now divide the trades into volatility regimes.
You might discover:
Low volatility: 39%
Normal volatility: 52%
Expansion: 61%
Extreme volatility: 43%
Now you have something useful.
Your strategy appears to perform best during expansion, but not necessarily during extreme volatility.
That is a real trading filter.
The cone has become useful because it changed your understanding of expectancy.
This Is Where Backtesting Matters
Our guide on How to Backtest a Day Trading Strategy explains why a strategy should be tested across different sessions, volatility regimes, costs, and market conditions rather than judged from a handful of attractive chart examples.
Apply the same principle here.
Do not ask:
“Does volatility expansion look good on the chart?”
Ask:
“Does my specific setup produce better expectancy when volatility is expanding?”
That is a much harder question.
It is also the one worth answering.
Volatility Cones And Position Sizing
This is where the strategy becomes practical.
When volatility expands, stops often need to become wider.
If your normal stop is 10 pips but current market conditions require 18 pips to place the stop beyond meaningful structure, you cannot keep the same lot size and pretend risk is unchanged.
The position size must come down.
This is where most traders miscalculate risk. Using a Position Size Calculator removes guesswork and allows you to keep account risk consistent while the market’s volatility changes.
For example, suppose you normally risk $50.
With a 10-pip stop, you can use a certain position size.
With an 18-pip stop, the position must be smaller.
The volatility cone can help explain why the stop became wider.
The position size calculator ensures that a wider stop does not quietly become a larger account risk.
High Volatility Should Change Your Expectations
When volatility is elevated, traders often make one of two mistakes.
They become too aggressive because the market is moving.
Or they become too afraid because the market is moving.
Both reactions are emotional.
The better response is adjustment.
Expect wider candles.
Expect deeper pullbacks.
Expect faster execution.
Expect greater slippage around major events.
Expect fewer clean entries.
Your strategy does not necessarily need to change.
Your expectations do.
Volatility Cones And Stop Placement
A stop should still be based on invalidation.
The cone should not dictate the exact stop.
Instead, use volatility to determine whether the structure-based stop is reasonable.
Imagine a long setup with support 15 pips below the entry.
If current volatility is unusually low, a 15-pip stop might represent a meaningful structural distance.
If volatility has exploded, the same 15-pip distance may be sitting inside ordinary market noise.
That distinction can prevent a lot of unnecessary stop-outs.
The cone gives you context.
Structure gives you the location.
Volatility Cones And Profit Targets
The same logic applies to targets.
If your normal target is 1.5R, do not automatically increase it just because volatility is high.
A larger range creates opportunity, but it also creates more uncertainty.
Instead, ask whether the target is realistic relative to the current market’s available movement.
If the market has already completed an unusually large portion of its expected daily range, expecting another full expansion may be unrealistic.
The target should reflect both structure and remaining volatility capacity.
The Psychology Of Trading Volatility
Volatility creates emotional distortion.
When candles become large, traders feel they are missing something.
They chase.
When volatility collapses, traders become bored.
They manufacture setups.
This is one reason a volatility cone can have psychological value.
It creates an objective reason to change behavior.
If your data says your strategy performs poorly during the bottom 15% of volatility conditions, you don’t need to argue with yourself when the market becomes quiet.
You wait.
Likewise, if your system performs well during volatility expansion, you don’t have to chase every large candle.
You wait for your setup inside the correct regime.
Our article How To Avoid Overtrading in Forex explores the same idea from the behavioral side. The market can provide endless opportunities, but your strategy should provide limited permission to trade.
Journaling Volatility Regimes
Your trade log should show the volatility environment at the time of your entrance.
Do not only write:
EUR/USD Breakout +2R
Write:
EURUSD broke out. Volatility 34th percentile, going up. Then compare it with:
“EUR/USD breakout, volatility 88th percentile and falling.”
Over 100 or 200 trades, you may discover that the same setup behaves completely differently depending on the volatility regime.
Your Trade Journal Template can be used to add a volatility percentile field alongside your session, setup type, entry, stop, target, and outcome.
That turns your journal into a research database rather than a diary of emotional experiences.
What To Measure
The most useful statistics are not complicated.
Measure expectancy by volatility percentile.
Measure the win rate by volatility regime.
Measure average R.
Measure maximum adverse excursion.
Measure maximum favorable excursion.
Measure average holding time.
Measure the percentage of breakouts that continue after entry.
Then look for nonlinear behavior.
Performance may be poor below the 20th percentile.
It could improve sharply between the 40th and 70th percentile.
It may collapse again above the 90th percentile.
That is exactly the type of information a volatility cone can reveal.
When Volatility Cones Fail
Volatility cones are not magic.
They are historical distributions.
If the market undergoes a structural regime change, the historical distribution may become less relevant.
A major central bank announcement can change volatility dramatically.
A geopolitical shock can make historical percentiles almost useless for a period.
An earnings event can completely alter the normal volatility profile of an individual stock.
This is why you should never treat the cone as a prediction machine.
It describes what has been normal.
Markets can become abnormal.
The Biggest Mistake: Fading The Cone
Suppose volatility reaches the 95th percentile.
The trader sees the extreme and immediately shorts.
That is not a volatility strategy.
That is a mean-reversion assumption disguised as volatility analysis.
If the market is experiencing a genuine repricing event, the 95th percentile can become 98th, then 99th.
The correct interpretation is:
“Movement is historically unusual.”
Not:
“Price must reverse.”
That distinction can save you from some very painful trades.
Scaling A Volatility-Based Edge
Once you have tested your volatility filters and established that they improve your actual expectancy, capital becomes the next practical question.
A small account can limit the financial impact of even a strong edge.
That does not mean increasing leverage unquestioningly.
It means considering whether your process can be scaled responsibly.
Evaluation programs such as The5ers, FTMO, and other proprietary trading models approach this problem differently, with their own rules around drawdown, targets, leverage, and trading behavior.
For example, The5ers is now advertising a High Stakes program with scaling provisions up to $500,000 and particular risk-management regulations. FTMO also sets clear targets for profit objectives and maximum daily and total losses.
The important point is that an evaluation account should come after the trading process, not before it.
If your strategy only works when volatility happens to be favorable, you need to know that before paying for an evaluation.
If your data shows that your strategy performs consistently within specific volatility regimes and your risk remains controlled, an evaluation can become a logical way to seek access to greater nominal trading capital.
That is very different from treating a prop firm as a shortcut.
A Simple Daily Volatility Cone Routine
Before the trading session begins, identify the current volatility percentile.
Then determine whether volatility has been expanding or contracting.
Finally, compare today’s movement to the typical range for the period.
Then see if your favorite arrangement is comfortable under those situations.
If the volatility is outside the regime you have tested, limit activity or wait.
If volatility is inside your strongest historical regime, trade your normal setup without forcing additional signals.
Finally, record the volatility state in your journal.
That routine takes only a few minutes.
But it changes the question from “Can I find a trade?” to “Does my edge belong in this environment?”
That is a much more professional question.
Final Thoughts
The real value of volatility cones is not that they predict the next move.
They don’t.
Their value is that they make volatility measurable relative to history.
That gives you something most discretionary traders lack: context.
A breakout during volatility compression is not the same trade as a breakout during volatility expansion.
A reversal during normal volatility is not the same trade as a reversal after an extreme volatility event.
And a high-volatility market should not automatically make you more aggressive.
Sometimes it should make you smaller.
Sometimes it should make you more selective.
Sometimes it should keep you completely out of the market.
For the next 100 trades, add one field to your journal:
Current volatility percentile at entry.
Do not change your strategy initially.
Just collect the data.
After 100 trades, divide the results into low, normal, expansion, and extreme volatility regimes.
Then see where your actual edge lives.
You may discover that the biggest improvement to your trading does not come from finding another entry signal.
It comes from learning when your existing setup deserves permission to operate.
For the next step, read How To Backtest a Day Trading Strategy and use the same statistical discipline to test whether volatility regimes genuinely improve your own expectancy.
Frequently Asked Questions
What is a volatility cone in trading?
A volatility cone is a way of seeing how present or recent volatility compares to the range of historical volatility over different time periods. It assists traders to define the abnormally quiet or busy market situations.
How can volatility cones help day traders?
Volatility cones can help day traders identify whether the market is in a compression, normal, expansion, or extreme volatility regime. This can help determine when a strategy is more or less suitable.
Can a volatility cone predict price direction?
Nope. Volatility cone is a measure of the magnitude of the pricing moves, not the direction. Traders still require price structure, momentum and other directional signals to know whether to buy or sell.
Is high volatility good for day trading?
Not necessarily. High volatility can create larger opportunities but also wider stops, faster price movement, and greater execution risk. The best approach depends on whether your strategy has been tested in that volatility regime.
How should I use volatility cones in a trading strategy?
Use the cone as a filter for market conditions, not as an entry signal. Observe your past approach performance at the present volatility percentile and only trade when this volatility environment is one where your setup has shown an edge.