
One of the most common questions new day traders ask is surprisingly difficult to answer.
“How many pips should I expect from a London breakout?”
The mistake is assuming there is a single number.
Many traders make it their entire approach to get 30, 50, or even 100 pips every morning. If the market only gives 15 pips, then they wait for more. When it hits 80 pips, they get out way too early since they thought the move was “already done”.
Neither decision is based on market conditions.
It is based on expectations.
After years of trading and reviewing thousands of London session charts, one lesson becomes obvious. The London open creates opportunity because of participation, not because it guarantees a fixed pip range.
Understanding what influences London session breakouts matters far more than memorizing an average number.
This guide explains what London session breakouts typically produce, why breakout ranges change from day to day, and how experienced traders adapt their expectations instead of forcing the market to meet them.
Is There an Average London Session Breakout?
The short answer is yes, but it depends heavily on the currency pair, market volatility, economic calendar, and the size of the overnight range.
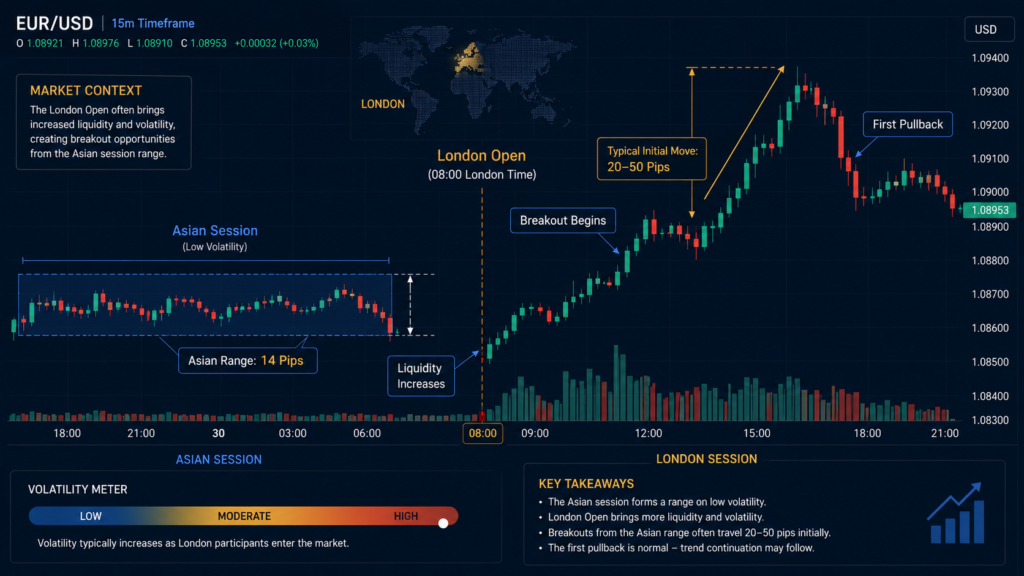
For major forex pairs like EUR/USD and GBP/USD, the initial breakout after the London open often travels somewhere between 20 and 50 pips before experiencing its first meaningful pullback during normal market conditions.
Those changes can easily be more than 70 to 120 pips on days with strong volatility around central bank announcements or major economic releases.
In contrast, in calm summer markets or holiday trading sessions, London breakouts often struggle to make even 15 to 20 pips before reverting.
That is why professional traders rarely ask, “How many pips does London usually move?”
Instead, they ask, “What conditions exist today?”
Why the London Session Produces the Strongest Moves
The London session represents one of the busiest trading periods in the global forex market.
European banks are moving into the market.
Institutional traders rebalance their holdings.
Corporate orders start to arrive.
Liquidity grows substantially from the Asian session.
This increase in participation explains the frequent expansion of volatility just after the London open.
The move itself is not random.
It reflects fresh information entering the market along with significantly higher trading volume.
When New York overlaps with London later in the day, volatility often increases again, creating another window for strong price movement.
Research Shows Why London Dominates Forex Volatility
According to the Bank for International Settlements (BIS) Triennial Central Bank Survey, the foreign exchange market has trillions of dollars in daily turnover, and London remains the world’s largest FX trading center.
The CME Group has also published educational material explaining how overlapping global trading sessions increase liquidity, tighten spreads, and improve execution quality for active traders.
Research and market data published by the London Stock Exchange Group (LSEG) consistently show that institutional participation peaks during major session overlaps, particularly in London and New York.
For active traders, this means something practical.
Large moves are not created simply because the clock reaches the London open.
They happen because more participants enter the market with larger order flows.
Understanding that distinction changes how you prepare every trading day.
Why There Is No Universal London Session Average Pips Break
Many websites claim London breakouts average a specific number of pips.
That statistic alone has little value.
Imagine these two trading days.
On Monday, EUR/USD spent the Asian session inside a 12-pip range.
London opens.
Volatility expands rapidly.
Price travels 48 pips before consolidating.
Now consider Tuesday.
The Asian session already covered 40 pips because of unexpected geopolitical news.
London opens.
Price extends another 15 pips before reversing.
Both days experienced a London breakout.
Neither behaved the same.
The overnight range changed everything.
Professional traders compare today’s conditions with recent volatility instead of relying on fixed historical averages.
The Asian Session Often Determines the Opportunity
One of the strongest observations among experienced London traders is that the quality of the breakout frequently depends on what happened before London opened.
A compressed Asian range often stores energy.
A wide Asian range frequently releases that energy before Europe begins trading.
Think of volatility like a spring.
A tightly compressed spring has more room to expand.
An already stretched spring has less remaining energy.
This is why many successful London session traders spend more time studying the Asian session than predicting the London open itself.
Our article on How to Trade Flat Markets explores this concept in greater depth because quiet markets often create tomorrow’s strongest opportunities.
What Makes Some London Breakouts Fail?
Not every breakout deserves to be traded.
One of the biggest mistakes traders make is entering every breakout candle without considering context.
Several warning signs deserve attention.
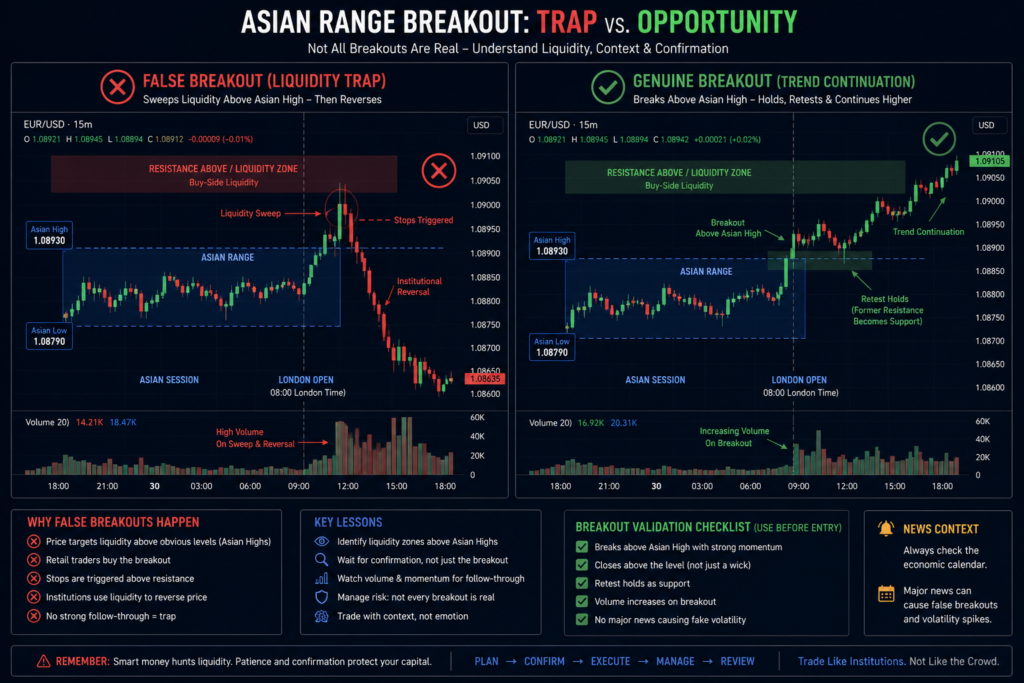
If price breaks above the Asian high but immediately stalls, institutions may simply be collecting liquidity before reversing.
If major economic news is scheduled within the next thirty minutes, many breakout moves lose reliability.
If the resistance on the upper timeframe is only a couple of pips away, chances are the upside is already capped.
“It’s not just the opening of the session that makes the best London breakouts but several things coming together.
This idea closely connects with our guide on What Does Liquidity Sweep Look Like on a Chart, where many failed London breakouts become excellent reversal opportunities.
A Practical Framework for Trading the London Session
Don’t question whether London will make 30 or 50 pips today, but base your choice process on probability.
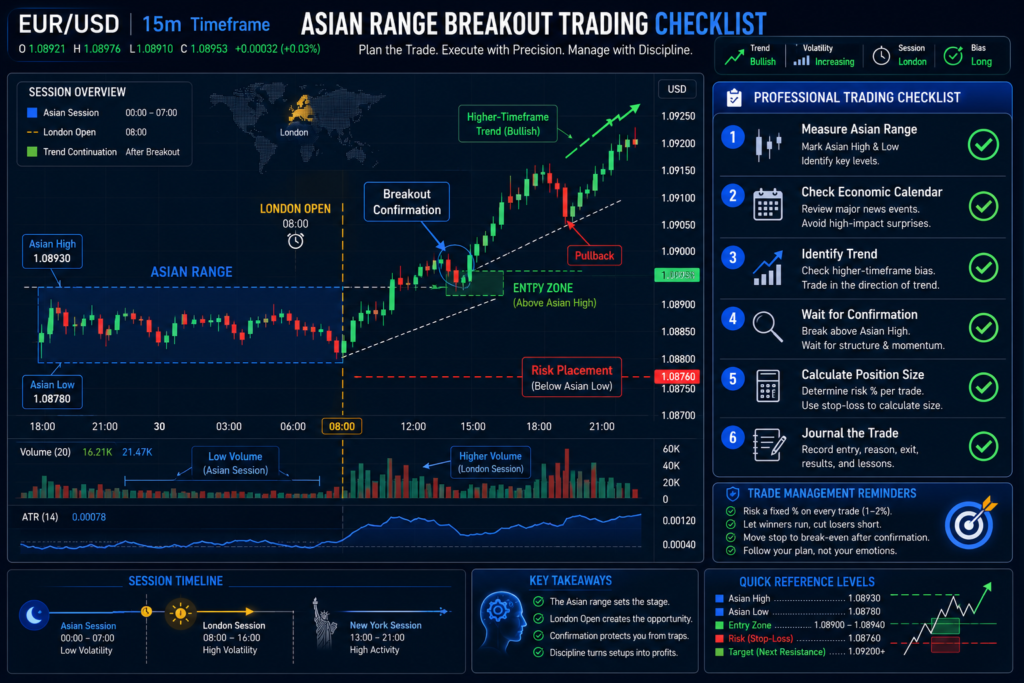
Find the high and low of the Asian session.
Measure the nightly spread.
Check out today’s economic releases.
Check the daily and 4-hour trend.
And then check whether today’s breakout aligns with the higher-timeframe structure.
When London opens, do not go in right away.
Let the market tell us if institutions are buying into the breakout or just sweeping liquidity.
If the breakout is sustained, involvement tends to develop naturally.
If it doesn’t come in soon, patience will normally prevent needless losses.
Trading is considerably easier when you focus on market behavior and not on settled assumptions.
The London Breakout Strategy Success Rate
One of the most searched questions is whether the London breakout strategy actually works.
The answer depends almost entirely on execution.
A trader buying every breakout without filters may experience disappointing results because many moves reverse shortly after the open.
A trader who combines market structure, volatility, liquidity, and timing often achieves significantly better consistency.
The strategy itself is not the edge.
The decision-making process behind the strategy is.
Professional traders rarely evaluate success based on one trade.
They evaluate whether the setup maintained a positive expectancy across hundreds of trades.
Managing Risk During London Breakouts
Fast-moving markets create opportunity.
They also expose poor risk management.
One common mistake is reducing stop-loss size simply because traders want larger position sizes.
Another mistake is keeping the same lot size regardless of volatility.
When London volatility expands, your stop distance often needs to expand as well.
This is where most traders miscalculate risk. Using the Position Size Calculator removes guesswork by adjusting position size according to your actual stop-loss distance instead of your desired lot size.
Consistent risk management allows your edge to survive periods when breakout conditions temporarily change.
Improving Results Through Journaling
Most traders remember their best London breakout trades.
Very few remember the average ones.
That creates confirmation bias.
Start recording every London breakout trade using consistent criteria.
Track the Asian range size.
Record the breakout direction.
Measure total breakout distance before the first pullback.
Note whether major news occurred.
Document whether the breakout aligned with the higher-timeframe trend.
Within a few months, patterns begin appearing.
You may discover that your best trades occur only when the Asian range remains below a certain size.
You may find that Tuesday and Wednesday outperform Fridays.
These observations become your personal edge.
Our downloadable Trade Journal Template helps organize this information so your trading decisions become data-driven instead of memory-driven.
Scaling a Proven London Session Strategy
Many traders do eventually become more consistent, but the size of their accounts will limit their long-term growth.
The professional evaluation firms exist to handle that problem.
Companies such as The5ers, FTMO, and FundedNext allow disciplined traders to demonstrate their strategy within predefined risk parameters before accessing significantly larger trading capital.
The important point is not passing an evaluation quickly.
It is proving that your London session trading strategy remains profitable over a meaningful sample of trades.
If your journal consistently demonstrates disciplined execution and positive expectancy, a The5ers evaluation account becomes a logical next step for scaling your trading without continually increasing personal capital.
Common Misconceptions About London Session Breakouts
One myth is that every London opening makes a transaction.
Some sessions have great trends.
Others make fake breakouts and choppy price activity.
Another misconception is that larger candles always indicate stronger opportunities.
In reality, extremely aggressive opening candles often leave little room for favorable risk-to-reward entries.
Finally, many traders believe that more volatility automatically means more profit.
Higher volatility means a larger opportunity and a larger risk.
Without disciplined execution, both increase together.
Final Thoughts
The question is not how many pips the London session averages.
The better question is whether today’s market conditions justify expecting a meaningful breakout at all.
Successful traders don’t pursue average numbers.
They study context .
They compare volatility with the sessions of late.
They respect liquidy.
Most important, they are flexible enough to understand that the market owes them nothing today.
For your next trading week, try one simple exercise.
Before London opens, write down your expected volatility based on the Asian session, scheduled news, and higher-timeframe structure.
Then compare your expectations with what actually happened.
That habit alone will improve your market reading far more than memorizing historical pip averages.
For your next read, explore What Does Liquidity Sweep Look Like on a Chart to understand better why some London breakouts become powerful trends while others quickly reverse.
Frequently Asked Questions
How many pips does the London session usually move?
In a typical market, large currency pairings will commonly have a London breakout of roughly 20 to 50 pips, but during important news events the volatility can be far greater.
What is the London session average pips break for EUR/USD?
EUR/USD often goes 20 to 50 pips from the London open before its first significant pullback, but the distance varies based on overnight volatility and economic news.
Does the London breakout strategy work?
Yes, but it works if you have filters such as market structure, volatility, liquidity and higher time frame trend on top of trading every breakthrough automatically.
What is the best London session trading strategy?
Many skilled traders look at more than just breakout candles, they will look at Asian session range analysis, higher time frame trend direction, liquidity zones and disciplined risk management.
Why do London breakouts sometimes fail?
Failed breakouts are sometimes caused by liquidity sweeps , neighboring higher time frame support or resistance , scheduled economic news , or lack of institutional participation.
Which currency pairs are best for the London session trading?
EUR/USD, GBP/USD, EUR/GBP, GBP/JPY, and EUR/JPY are among the most actively traded pairs during the London session because of increased European market participation.