
Every trader remembers that frustrating trade.
Price breaks yesterday’s high by a few pips. You buy the breakout because it looks clean. Within minutes, the price reverses sharply, stops you out, and then trends in the exact direction you originally expected.
Most traders blame manipulation.
More experienced traders ask a different question.
Who provided the liquidity for the move?
That single question changes how you read charts forever.
After reviewing thousands of forex, futures, and stock charts, one pattern appears repeatedly. Strong directional moves are often preceded by a brief move that takes out obvious stop-loss clusters before reversing. This is what traders call a liquidity sweep.
The problem is many traders think every false breakthrough is a liquidity sweep. It isn’t. “Sometimes breakouts just fail because the buyers go away. Others are planned stop runs to generate adequate liquidity for bigger players to get in positions.
Learning the difference is one of the biggest upgrades you can make as a discretionary trader.
This guide explains exactly what a liquidity sweep looks like on a chart, how to recognize it in real time, when it fails, and how professional traders build execution rules around it instead of chasing every breakout.
What Is a Liquidity Sweep?
A liquidity sweep is when price briefly advances past a clear high or low where plenty of stop-losses or breakout entry are expected, takes out that liquidity, and then quickly reverses course.
Think about where retail traders naturally place orders.
Many places stop losses above swing highs when they are short.
Others place stop losses below swing lows when they are long.
Breakout traders also place buy stop orders above resistance and sell stop orders below support.
All of those orders become liquidity.
Large market participants cannot always enter large positions within a quiet range. They need counterparties. By pushing price into areas filled with pending orders, they create enough volume to execute larger trades.
That is why liquidity sweeps often happen around obvious technical levels instead of random prices.
What Does a Liquidity Sweep Look Like on a Chart?
A classic liquidity sweep usually has five characteristics.
First, price approaches an obvious swing high, swing low, previous day’s high, previous day’s low, equal highs, equal lows, or range boundary.
Second, price breaks beyond that level with enough momentum to convince breakout traders the move is beginning.
Third, the breakout almost immediately stalls.
Fourth, the price pulls back into the previous range.
Finally, cornered traders run from their positions, and momentum takes off again.
The reversal itself is typically greater than the initial breakout because it forces numerous groups to react at the same time.
Long traders close losing positions.
Short traders enter new positions.
Breakout traders are trapped.
Professional traders join the reversal.
All of that creates powerful order flow.
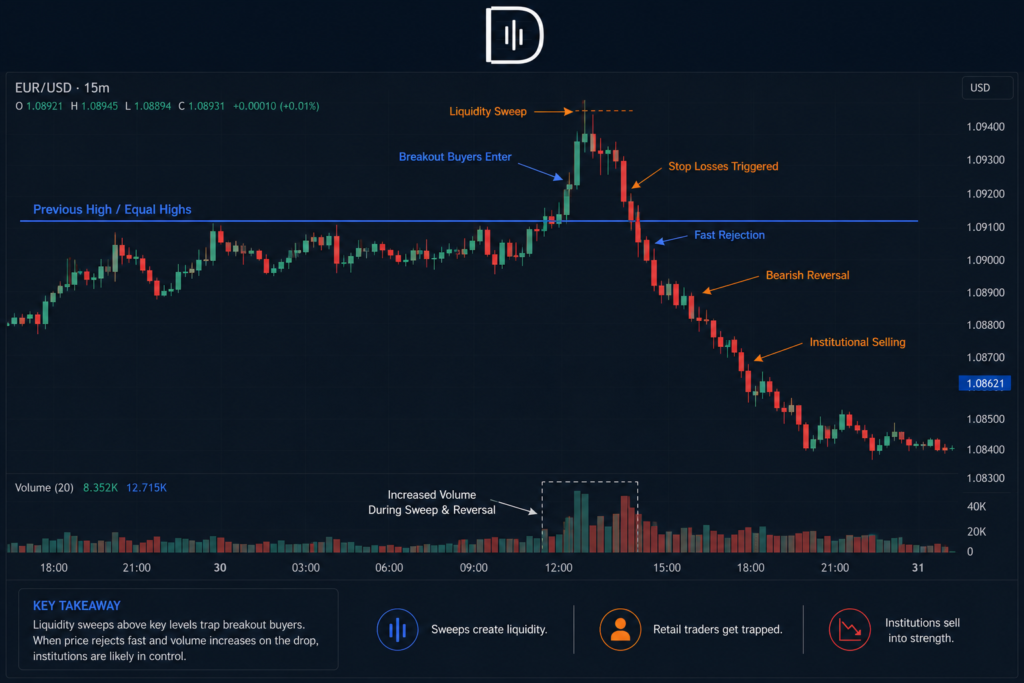
Liquidity Sweep Chart Example Forex
Imagine EUR/USD trading in a 40 pip range all morning in London.
The session high is 1.1250.
Price test 3 times at level without breaking higher.
Resistance is common to all retail traders.
Some places buy stop orders above 1.1250, expecting a breakout.
Others who are short hide their stop losses above the same level.
Near the New York open, the price rallies to 1.1256.
Social media starts talking about the breakout.
Five minutes later, buyers disappear.
Price falls back below 1.1250.
Within thirty minutes, EUR/USD trades at 1.1215.
The real opportunity wasn’t buying the breakout.
It was recognizing that the breakout failed immediately after sweeping available liquidity.
This is one of the most common liquidity sweep chart examples that forex traders encounter during active sessions.
Equal Highs and Equal Lows Are Liquidity Magnets
One lesson that experienced traders eventually learn is that markets dislike obvious symmetry.
When two or three highs form at nearly the same level, they become visible to everyone.
That visibility attracts orders.
Equal highs frequently become targets before bearish reversals.
Equal lows often become targets before bullish reversals.
Instead of treating equal highs as automatic resistance, think of them as areas where liquidity is likely waiting.
The market often visits those levels before revealing its true direction.
Why Liquidity Sweeps Happen Before Major Trends
For many traders, the assumption is that trends begin with clear breakouts.
Reality is often messier.
Big institutions rarely chase pricing.
They like to come in where there is existing liquidity.
A liquidity sweep gives them the chance to buy after weaker sellers have exited or sell after weaker buyers panic.
This creates better average pricing while reducing market impact.
The result is often a cleaner trend after the sweep than before it.
That explains why many of the strongest intraday moves begin immediately after failed breakouts.
The Difference Between a Liquidity Sweep and a Fake Breakout
These terms are often used interchangeably, but they are not identical.
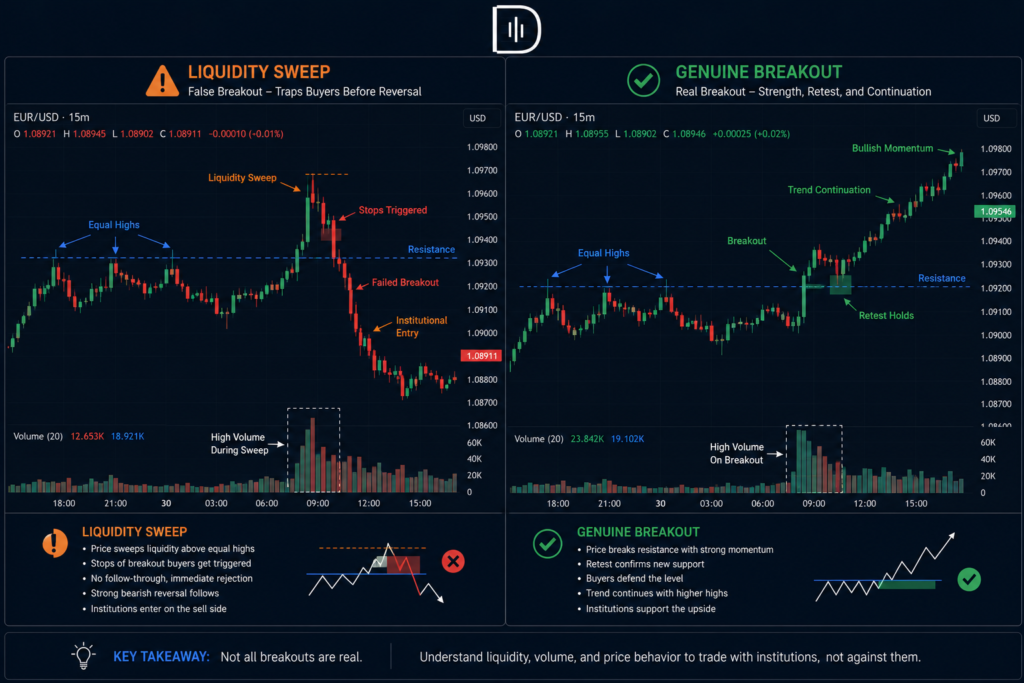
Every liquidity sweep looks like a false breakout.
Not every false breakout is a liquidity sweep.
The big difference is what happens right after the failed breakout.
A real liquidity sweep will usually give you quick rejection, momentum build, and clean follow through.
A regular failed breakthrough can lead to a lateral drift with no major directional movement.
If there is no strong response after the rejection, there may not have been significant liquidity involved.
Time Matters More Than Most Traders Realize
One overlooked characteristic of quality liquidity sweeps is timing.
Sweeps occurring during active trading sessions carry more significance than those happening during quiet hours.
London opens, New York opens, major economic releases, and session overlaps consistently produce higher participation.
That means more liquidity.
A sweep occurring fifteen minutes before a major news release deserves different treatment than one occurring during low-volume Asian trading.
Context changes everything.
Market Structure Still Comes First
A liquidity sweep should never replace market structure.
Instead, it should complement it.
Suppose the daily trend remains strongly bullish.
The four-hour chart continues making higher highs.
The one-hour chart pulls back into support.
An intraday sweep below a recent swing low now aligns with higher-timeframe direction.
That setup deserves far more attention than a random sweep against a strong trend.
This idea connects well with our guide on How to Use Price Action Only Trading, where structure always takes priority over individual candlestick patterns.
Research Supports Why Liquidity Matters
Academic market microstructure research has consistently shown that liquidity plays a central role in price discovery rather than price moving randomly.
The Bank for International Settlements (BIS) explains how liquidity conditions influence market behavior, especially during periods of increased institutional activity.
Research from the CME Group also demonstrates how order flow and available liquidity affect price movement in futures markets, particularly around key trading sessions.
The Bank for International Settlements Triennial Central Bank Survey continues to show that the foreign exchange market processes trillions of dollars in daily volume, making liquidity distribution one of the most important drivers of short-term price movement.
The message for active traders is obvious.
The price doesn’t rise simply because there are more buyers than vendors.
It moves when orders meet the available liquidity. Once you begin to look at charts with that perspective, you will find a lot of puzzling reversals become much easier to interpret.
A Practical Framework for Trading Liquidity Sweeps
The best traders don’t trade every swing they notice.
Instead they run them through a basic decision procedure.
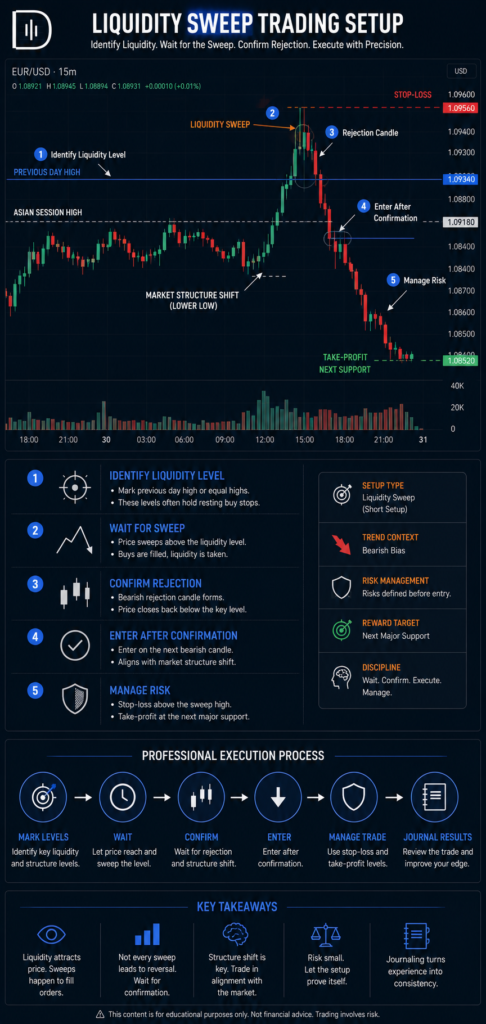
First, look for noticeable liquidity levels, prior to the commencement of the trading session.
Mark the previous day’s highs and lows, Asian session highs and lows, equal highs, equal lows, major swing points, and range boundaries.
Next, wait for the price actually to reach those levels.
Do nothing until liquidity is likely to be accessed.
Once the price breaks the level, observe the reaction instead of reacting yourself.
Does the breakout accelerate?
Does volume increase?
Does price immediately reject?
Can the market close back inside the previous range?
Only after those questions are answered should you consider an entry.
Finally, let the market structure confirm the direction.
The sweep provides context.
Structure provides conviction.
This approach closely aligns with concepts discussed in our articles on How Traders Use ATR and Volatility Together, How to Trade Flat Markets, and What Is a Trading Edge and How to Build One, where context matters more than isolated signals.
Can a Liquidity Sweep Indicator Find Every Setup?
Many traders search for the perfect liquidity sweep indicator.
Unfortunately, no indicator can directly measure hidden institutional intent.
Some indicators highlight equal highs, equal lows, swing points, or stop hunt zones.
Others attempt to identify market structure shifts after liquidity events.
These tools can save time, but they should never replace chart reading.
The best liquidity sweep indicator is still your understanding of market structure, timing, volatility, and order flow.
Indicators identify locations.
Experience identifies opportunity.
Where Most Traders Make Execution Mistakes
The biggest mistake is entering before confirmation.
Seeing the price touch a previous high is not enough.
The sweep has not happened yet.
The rejection has not happened yet.
Confirmation has not happened yet.
Another common mistake is placing stop losses exactly where everyone else places them.
Markets naturally seek those areas.
Finally, many traders risk too much on setups that are statistically uncertain.
This is where most traders miscalculate risk. Using the Position Size Calculator removes guesswork and keeps your position aligned with the actual stop distance rather than an arbitrary lot size.
Tracking Liquidity Sweeps in Your Trading Journal
Few traders measure if their performance becomes better with liquidity sweeps.
Start tracking every setup for at least fifty trades.
Market session, Trend on higher timeframe, Liquidity level sought, Confirmation signal, Entry timing, Stop placement, Trade result, Emotional faults made during execution.
Patterns begin to emerge surprisingly quickly.
You may discover that sweeps in London outperform New York.
You may notice that equal highs produce stronger reversals than the previous day’s highs.
Or you may find that waiting for candle confirmation increases your expectancy significantly.
Our downloadable Trade Journal Template makes this process much easier because it encourages reviewing execution quality instead of focusing only on profits.
Edge Without Capital Eventually Becomes a Limitation
Many traders eventually reach a point where consistency improves, but account size limits income growth.
That is why experienced traders often explore professional evaluation programs.
Companies such as The5ers, FTMO, and FundedNext allow traders to demonstrate consistency through evaluation models before receiving access to larger trading capital.
The main thing is not to get funded fast.
It proves that your liquidity sweep strategy continues to be profitable under specified risk rules.
If your journal indicates disciplined execution and good expectancy, a The5ers assessment account can be a reasonable next step to scale without regularly contributing personal funds.
Final Thoughts
The liquidity sweeps are nothing of mystery.
They are merely the observable effect of how markets discover enough orders to enable larger transactions.
The traders that make money from them are rarely the fastest.
They are usually the most patient.
Instead of chasing every breakout this week, focus on one simple exercise.
Mark the obvious liquidity levels before each session.
Watch how the price behaves when those levels are reached.
Do not predict. Observe. In a few weeks you will begin to observe the same behavior repeating across numerous markets and time periods. That is when liquidity will cease to be a buzzword and become part of your trading edge.
For your next read, revisit What a Trading Edge Is and How to Build One and compare how liquidity sweeps fit into your existing decision-making process rather than treating them as a standalone strategy.
Frequently Asked Questions
What is a liquidity sweep in forex?
A liquidity sweep is when price spikes above resistance or below support to activate pending orders and stop losses then reverses. It is often seen near session highs and lows and equal highs and lows.
What does a liquidity sweep chart example look like?
Price breaks a clear level, rejects fast, comes back inside the prior range and then moves sharply in the opposite direction. A typical liquidity sweep chart example.
Is a liquidity sweep the same as a stop hunt?
These are closely related, but not the same. A stop hunt is when stop loss orders become triggered. A liquidity sweep is when liquidity is taken before the market moves in the direction planned.
Which timeframe is best for identifying liquidity sweeps?
Most day traders use higher timeframes, such as the four-hour or one-hour chart, to identify liquidity zones and lower timeframes, such as the five-minute or fifteen-minute chart, for execution.
Does every liquidity sweep lead to a reversal?
No. A few of the sweeps turn into real breakouts. This is why waiting for the rejection, the confirmation of the market structure, and the follow-through is a more dependable method than reacting to the initial breakout alone.
Is there a reliable liquidity sweep indicator?
There are a number of indicators that mark swing highs, equal highs, equal lows and potential stop-run zones but none can reliably identify institutional intent. The price movement, the context and careful execution are still more reliable than any one indicator.