
Every breakout trader has experienced the same frustration.
Price finally pushes above resistance.
Momentum looks strong.
You enter without hesitation.
Five minutes later, the market reverses, falls back inside the range, and stops you out.
Then it spends the rest of the day moving sideways.
After enough experiences like this, traders often conclude that breakout trading doesn’t work.
The truth is different.
Most failed breakout trades weren’t clean breakouts in the first place.
They were emotional entries triggered by price touching a level rather than convincingly breaking through it.
One lesson becomes obvious after reviewing hundreds of charts and trading journals.
The best breakout traders aren’t faster than everyone else.
They’re more selective.
They understand that a clean breakout isn’t defined by one candle.
It’s defined by the behavior surrounding that candle.
This guide explains what a clean breakout in forex actually looks like, how to separate genuine momentum from false moves, and how experienced traders build a repeatable decision-making process around breakout trading.
Why Breakouts Fail More Often Than Traders Expect
Millions of traders look at support and resistance levels.
Banking.
Institutions.
Algorithms
Retail Trader
That focus of attention generates opportunities but also produces traps.
The forex market is mostly the domain of institutional players, whose huge orders affect short-term price movement and liquidity, according to the Bank for International Settlements (BIS).
Research published by the CFA Institute also highlights how liquidity conditions can produce temporary price distortions before markets establish genuine directional moves.
For retail traders, this means a price moving beyond resistance isn’t enough.
The market must also demonstrate acceptance beyond that level.
That’s the difference between a clean breakout and a false breakout.
A Clean Breakout Is More Than a Candle
Many beginners define a breakout as any candle closing outside support or resistance.
Professional traders look deeper.
A clean breakout usually combines several factors working together.
Strong momentum.
Increasing participation.
Minimal hesitation.
Logical market context.
The breakout itself is only one piece of evidence.
The surrounding conditions determine its quality.
The Five Characteristics of a Clean Breakout
After years of studying breakout trades, these characteristics appear repeatedly in successful moves.
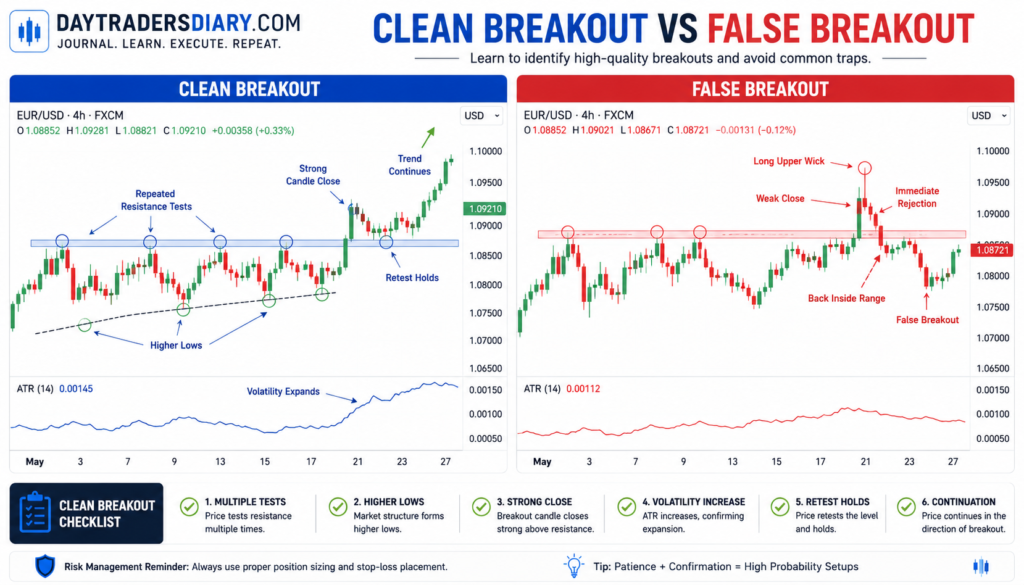
Price Closes Beyond the Level
A candle wick breaking resistance means very little.
A convincing close outside the level carries much more information.
Closing prices represent the prices at which buyers and sellers ultimately agreed to transact.
That agreement matters.
Waiting for the candle to close often prevents unnecessary entries.
Patience is frequently rewarded.
Momentum Builds Before the Breakout
You rarely get a clean breakout from random price movement.
Momentum is usually built up beforehand.
You might notice:
Higher lows Resistance
↑Buying pressure.
Tighter consolidations.
Tighter consolidations
Tests for resistance repeated.
With each failed rejection the barrier weakens.
Eventually the buyers will call the shots.
The breakthrough is the consequence of mounting strain, not of a sudden randomness.
Volatility Expands Naturally
Strong breakouts often occur alongside increasing volatility.
This is one reason experienced traders monitor the Average True Range.
If volatility increases as price breaks out of a consolidation, the move often carries greater conviction.
Our article on How Traders Use ATR and Volatility Together explains how volatility can confirm whether market participation is increasing or fading.
Momentum without volatility frequently struggles.
Immediate Rejection Is Limited
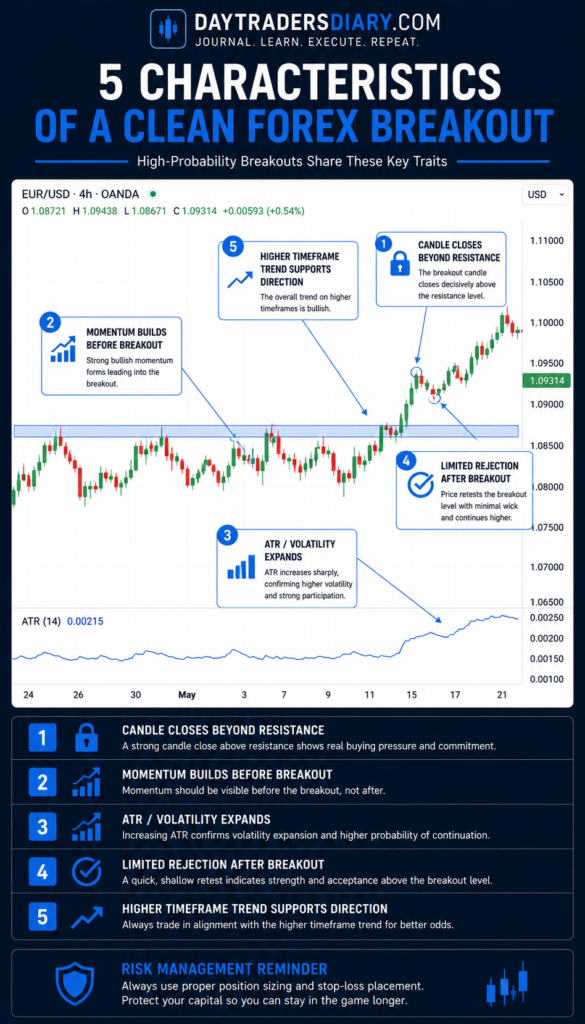
One characteristic of a false breakout is an immediate reversal.
Price moves beyond resistance.
Then instantly falls back below it.
Clean breakouts usually spend very little time returning inside the previous range.
Even when pullbacks occur, they often respect the breakout level before resuming the breakout.
Market acceptance matters more than initial excitement.
The Higher Timeframe Supports the Move
Context separates experienced traders from beginners.
Suppose a five-minute breakout appears bullish.
The daily chart, however, shows price breaking directly into major weekly resistance.
That breakout immediately loses quality.
Now imagine the same breakout occurring in the direction of the daily trend with plenty of open space ahead.
The probability improves considerably.
This is why our guide on the Best Daily Charts Setup for Forex Traders emphasizes starting every trading session with higher-timeframe analysis.
Lower timeframe signals become much more meaningful when they align with broader market structure.
Recognizing False Breakouts
To understand clean breakouts we have to understand poor breakouts.
There are frequent indicators of caution.
Price breaks resistance in, low-volume market hours
Breakout candle has a long top wick and a weak closure.
There is no more momentum soon after entering.
Price goes back to the former range in 1 or 2 candles.
Spikes based on news without technical confirmation
None of these means automatic failure.
But together they significantly reduce breakout quality.
A Practical Breakout Decision Framework
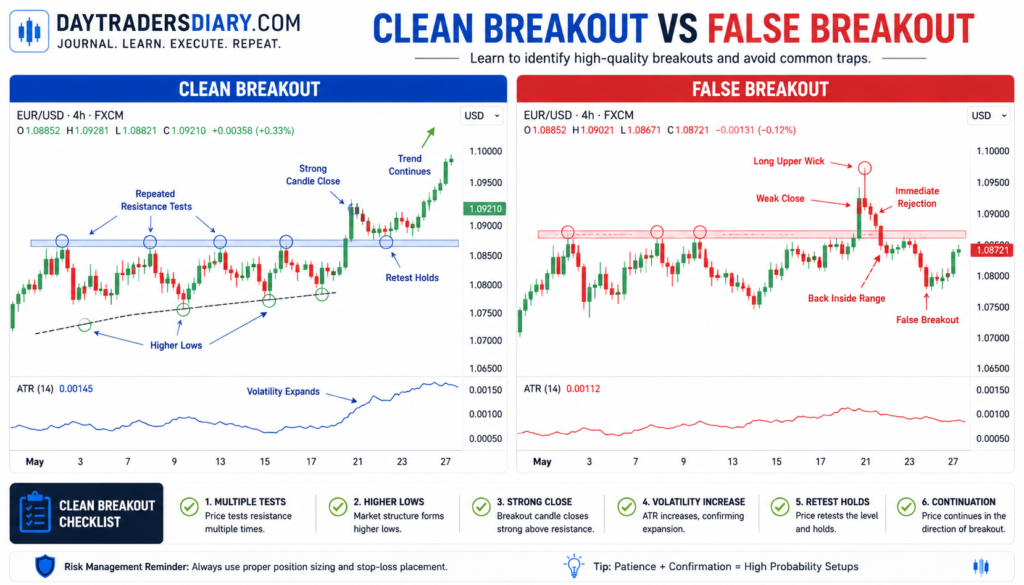
Instead of asking, “Has the price breached resistance?
Ask a better set of questions.
Is the direction of the higher timeframe in support?
Is resistance tested more than one time?
Is volatility expanding?
Did the price close beyond the level?
Does the market accept prices above the resistance level?
Can I define logical risk?
Only after answering yes to most of these questions should execution be considered.
Professional traders generally cut out the weak opportunities.
Not reading all signals.
Why Breakout Entries Should Never Ignore Risk
A clean breakout does not guarantee success.
No setup does.
Every breakout must still respect predefined risk limits.
The usual mistake is to widen the stop-loss only because momentum looks good.
Another is to increase position size when your conviction is high.
Both decisions are full of emotional risk.
This is where most traders screw up their exposure.
Using the Position Size Calculator ensures that every breakout trade risks the same percentage of your account, regardless of stop-loss distance.
Confidence should never determine position size.
Process should.
Review Every Breakout in Your Journal
Most traders only record winners and losers.
Few records set up quality.
Your Trade Journal Template should include:
Breakout location.
Market session.
Higher timeframe trend.
ATR reading.
Support or resistance level.
Entry quality.
Reason for entry.
Trade outcome.
After several months, you’ll discover something valuable.
Not every breakout behaves the same.
You may find your highest-performing trades occur only during the London session.
Or only when daily trends align.
Those insights become part of your personal trading edge.
Breakouts Improve When Combined with Patience
Many traders believe breakout trading requires speed.
Often it requires restraint.
Waiting for confirmation may reduce the number of trades you take.
It also removes many unnecessary losses.
Our article, “How Small Daily Goals Reduce Drawdown,” explains why focusing on execution quality rather than trading frequency often leads to smoother equity growth.
A missed trade hurts far less than repeatedly entering poor ones.
Scaling a Repeatable Breakout Strategy
Professional trading firms rarely evaluate traders based on spectacular individual trades.
They evaluate consistency.
The disciplined trader firms want to see is the one that waits for clean breakout situations, sizes the position correctly and controls drawdowns.
Firms such as The5ers, FTMO, and FundedNext reward traders that follow organized processes instead of emotional impulses.
If your journal indicates a consistent track record of profitable breakout execution and disciplined risk management, a The5ers evaluation account can allow you to trade more capital while employing the same repeatable approach you have already created.
Final Thoughts
A clean breakout isn’t defined by excitement.
It’s defined by evidence.
The strongest breakout traders don’t predict which levels will break.
They wait until the market proves that buyers or sellers have genuinely taken control.
When you notice price pushing past support or resistance next time, resist the temptation to chase.
Ask yourself, has your confidence been truly justified in the breakthrough.
That one behavior may take more losing trades out of the equation than any new indicator ever could.
How to Build a Trading Edge For your next read, understand how consistent trade selection promotes long-term profitability.
Frequently Asked Questions
What is a clean breakout in forex?
A clean breakout occurs when the price closes decisively beyond a significant support or resistance level, with strong momentum, expanding volatility, and continued market acceptance.
How do you identify a false breakout?
False breakouts will often reverse shortly after breaking a major level and are unable to retain their momentum and move back into the previous trading range in a short period of time.
Should I wait for the candle to close before entering a breakout?
Many experienced traders prefer waiting for the candle to close because it confirms that the price has accepted the breakout level rather than briefly trading beyond it.
Does ATR help confirm breakouts?
“Yes. Higher ATR readings suggest greater volatility which can frequently encourage stronger breakout moves when accompanied with a positive market structure.
What timeframe works best for breakout trading?
Many day traders will find support and resistance on a higher time frame and then look for breakouts on the lower intraday charts. Most people find that using multiple timelines makes for better decisions.
Why do breakout traders use position sizing?
Position sizing is risk equalized regardless of stop loss distance. This gives traders an objective way to handle unsuccessful trades while safeguarding long term account growth.