
You’ve probably seen this: the price moves sideways for 20 minutes, resistance is clearly defined, and then a massive bullish candle eventually breaks through it. You walk in, expecting the market to run. Instead, price reverses, hits your stop, and later breaks higher without you.
It is frustrating, especially when your analysis was not entirely wrong. The problem may have been the timing of your entry and your failure to judge the market’s volatility.
Not every breakout deserves a trade. Some moves have enough momentum to continue, while others are little more than a temporary push beyond a familiar price level.
This is where volatility break filters can be useful. They offer a realistic way to judge whether a breakout is worth trading before you risk your money. They won’t take away bad trades, but they can stop you from jumping in just because a candle seems good.
What Are Volatility Break Filters?
Volatility break filters are rules that traders use to assess the strength and conditions surrounding a breakout. They help you decide whether a move beyond support or resistance, or a consolidation range, has enough evidence to justify an entry.
Traders commonly use the Average True Range (ATR), Bollinger Band Width, candle ranges, and volume to evaluate these conditions.
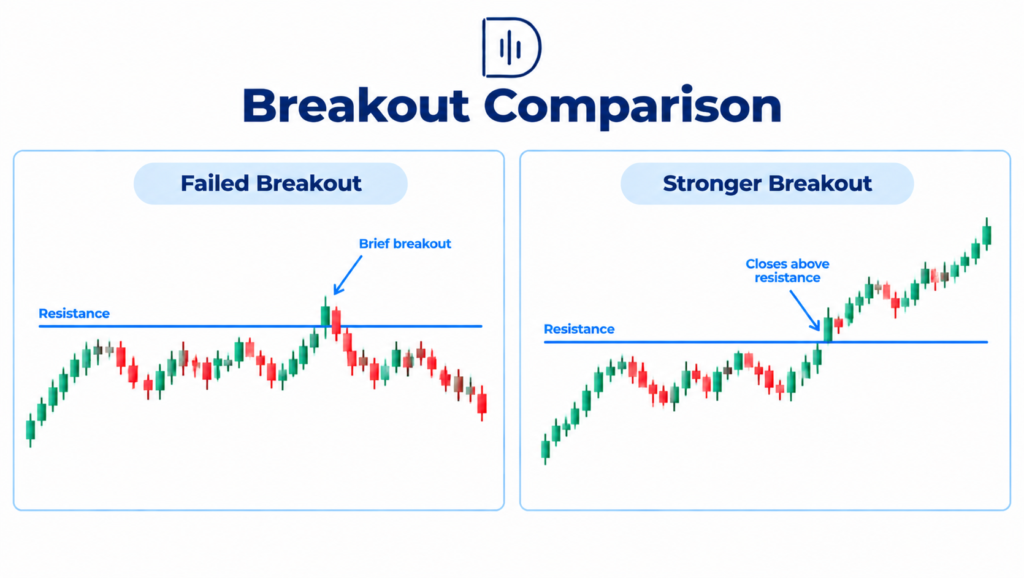
Imagine EUR/USD has been moving inside a narrow 15-pip range. Price briefly pushes above resistance but closes back inside the range. A few minutes later, another candle breaks the same level and closes firmly above it.
Both moves crossed resistance, but they did not show the same behavior.
The first breakout failed to hold its ground. The second showed better acceptance above the level. That does not guarantee further upside, but it gives you a more reasonable basis for considering a trade.
The real purpose of a volatility filter is to separate a simple price break from a move that shows signs of genuine expansion.
The Best Volatility Filters for Breakout Trading
1. Average True Range (ATR)
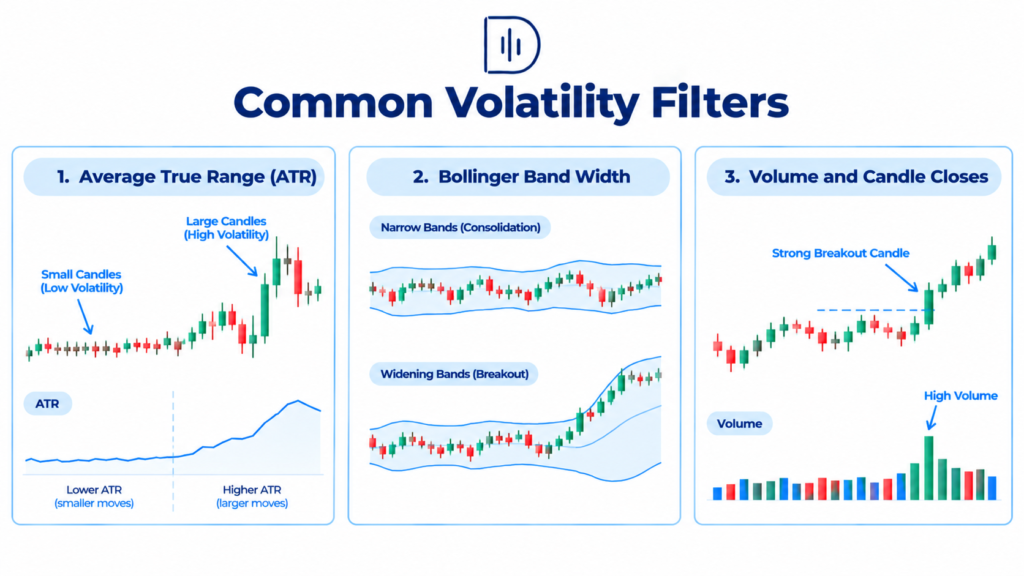
ATR is one of the most practical tools for judging whether a breakout candle is unusually large or small compared with recent price movement.
Suppose EUR/USD has an ATR of 6 pips on your chosen timeframe. A candle with a 3-pip range represents relatively limited movement, while a 10-pip range indicates a much larger move.
That does not mean you should automatically buy the larger candle.
If the price has already traveled a considerable distance before you enter, much of the opportunity may be gone. Your stop may need to be wider, and the next resistance level could be too close to offer an attractive reward.
ATR is a reference point, not a trade indication. Compare the breakout candle to the current move, see where it closes, and decide if there is enough room for the trade to work.
2. Bollinger Band Width
Bollinger Bands are useful when the market has been unusually quiet.
When the bands narrow relative to their recent width, the price is experiencing a period of relatively low volatility. If the bands begin widening as the price leaves a consolidation range, it can signal that market activity is increasing.
However, a squeeze does not tell you which direction the price will move.
For example, a narrow range might break upward, attract buyers, and then reverse sharply. The same setup could also produce a sustained trend. Your job is to wait for the price to show its hand rather than assume that a squeeze must lead to a profitable breakout.
Charles Schwab explains the practical use of this indicator in its guide to Bollinger Bands.
3. Volume and Candle Closes
For stocks and exchange-traded futures, volume can help you judge whether participation increases as price breaks a key level.
A breakout accompanied by rising volume and a strong close may offer better supporting evidence than one that occurs on unusually light activity. Still, high volume does not guarantee continuation.
Forex traders need to be more careful with volume data. Spot forex is decentralized, so the volume displayed by a retail broker generally reflects tick volume or broker-specific activity rather than the total volume traded across the market.
Always watch the candle close on any instrument. If price breaks resistance briefly but closes back inside the range, the move doesn’t show the same strength as a candle that closes above the level and stays there.
How to Use Volatility Break Filters in Real Trading
The biggest mistake is adding several indicators to a chart without knowing what decision each one should help you make. A simpler process is often more useful.
Start With a Clear Price Level
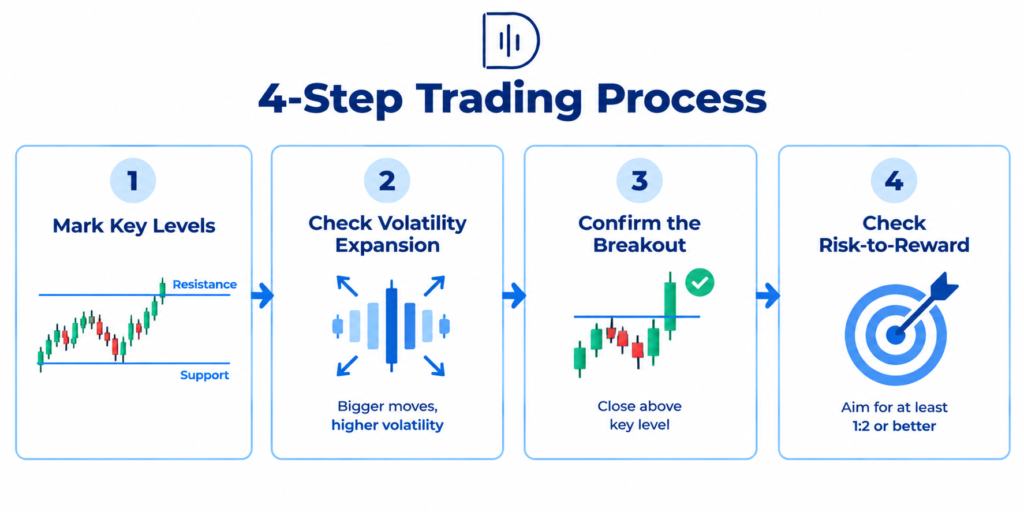
Before thinking about volatility, identify the level that matters. It could be the high of a consolidation, a previous session high, or a well-tested resistance area.
Mark it before the breakout happens. Otherwise, it is easy to redraw levels after a large candle and convince yourself that you saw the opportunity coming.
Check Whether Volatility Is Expanding
Once the price approaches the level, compare its recent candle ranges with ATR or another volatility measure.
A breakout after quiet consolidation may be worth watching if the price begins to move more decisively. But if the market has already produced several unusually large candles, another expansion candle could leave you entering too late.
Context matters more than the indicator reading alone.
Wait for Evidence That Price Can Hold the Level
Suppose gold breaks above an intraday resistance level. The first candle closes above it, but the next candle drops straight back into the previous range.
That is a warning worth respecting.
Depending on your strategy, you might wait for another close above resistance or a retest that holds. You will occasionally miss breakouts that never retest, but avoiding every missed move is not the goal. The goal is to take trades that consistently meet your rules.
Check Whether the Trade Still Makes Sense
Even a strong breakout can be a poor entry if there is little room left before the next obstacle.
Imagine your planned stop is 8 pips away, but the next resistance level is only 10 pips above your entry. Your potential reward is just 1.25 times your risk before transaction costs are accounted for.
If your strategy requires at least 2R, the trade does not qualify. There is little point in having a sophisticated volatility filter if you ignore the reward available after entering.
Pay Attention to the Trading Session
A breakout during an active London or New York session may behave differently from a similar move during a quiet period.
Scheduled economic releases can further complicate matters. A sudden burst of volatility may push the price beyond a level, only for the market to reverse once the initial reaction fades.
Know in advance whether your trading strategy permits trading around important news releases; if it doesn’t, don’t break that rule, even if the candle seems very attractive.
What Research Tells Us About Volatility
Volatility measurements describe how much prices are moving, but they do not tell you whether a breakout will succeed.
Charles Schwab’s Bollinger Bands guide explains how the indicator reflects changes in volatility. For a day trader, the practical lesson is to recognize changing market conditions without assuming that expanding bands predict a particular direction.
The CME Group’s guide to futures profit and loss also highlights why price movement must be considered alongside contract value. A larger move can create more opportunity, but it can also increase the amount you stand to lose if your exposure is not adjusted properly.
The SEC’s investor education resource, Thinking of Day Trading? Know the Risks, provides further context on the risks associated with rapid trading and leverage.
Together, these resources highlight a practical point: understanding volatility is only half the battle. You still need to have a reasonable entry, a set invalidation level, and a position size that makes sense for the trade.
Risk Management: Adjust to the Market, Not Your Emotions
One of the mistakes traders often make in volatile conditions is to widen their stops once they’ve entered because the price is moving more aggressively than they anticipated. Another way is to maintain the same position size when the setup calls for a broader stop.
Neither approach is ideal.
Your stop should reflect the point where your trading idea is no longer valid. Once that distance is clear, calculate the position size around your chosen risk limit. If the required stop makes the trade too expensive, reduce your position or skip the setup.
The DayTradersDiary Position Size Calculator can help you determine an appropriate position size based on your stop distance and planned risk.
Also, remember that stop orders can experience slippage during fast markets. Your actual exit may be worse than the price you originally planned.
A good volatility filter should help you become more selective, not give you an excuse to take on greater risk.
Track Your Results Before Changing Your Strategy
It is easy to remember the breakout that ran for 50 pips and forget the three that failed earlier in the week. That is why journaling matters.
Record the instrument, session, breakout direction, ATR reading, candle range, stop distance, and the final result in R-multiples. Make a note of whether the price moved beyond the breakout level or returned swiftly to the range.
After 50 to 100 trades, compare setups that met your volatility rules with those that did not. Look at average R per trade, drawdown, win rate, and trading costs.
The DayTradersDiary Trade Journal Template can help you organize these observations and identify patterns in your execution.
Do not judge a filter by how many losing trades it prevents. It may also exclude profitable trades. What matters is whether it improves your overall results after costs.
Can Volatility Filters Help You Scale Your Trading?
Once you have evidence that your strategy works, access to capital may become part of your longer-term planning.
Proprietary trading evaluations offer one possible route, but they are not a shortcut to profitability. The5ers, FTMO, and TradeThePool offer different programs and trading conditions, so it is important to compare the instruments available, evaluation requirements, drawdown rules, fees, and payout conditions.
You can review the current offerings on the official The5ers website.
An evaluation may make sense for a trader who already follows consistent risk limits and can stick to a strategy during drawdowns. If you are still changing your rules after every losing trade, paying for an evaluation is unlikely to solve the underlying problem.
First, establish that your volatility filters produce a repeatable edge. Then decide whether an evaluation account fits your financial circumstances and trading approach.
FAQs About Volatility Break Filters
What is the best volatility filter for day trading?
ATR helps compare current price movement to recent conditions. Bollinger Band Width helps to discover volatility compression and expansion. The ideal choice will rely on your market, timeframe, and strategy.
Do volatility filters prevent false breakouts?
Nope. They can help you avoid some weak setups, but even a breakout with high volatility growth can revert. Look at volatility readings alongside price structure and a clear entry plan.
Which ATR setting should I use?
The 14-period ATR is a popular starting point, but not necessarily the ideal choice for every strategy—Backtest on your real trading time frame and instrument.
Can timeframe bands predict breakout direction?
No. Narrow bands indicate relatively low volatility, not whether the price will move higher or lower. Wait for price action to provide directional evidence.
Should I trade every high-volatility breakout?
No. Large candles can mean that a move is already extended. Check your stop distance, nearby support or resistance, transaction costs, and remaining reward before entering.
How do I know whether a volatility filter works?
Try it out with a relevant sample of trades and see how it stacks up against your current strategy. Instead of win rate, look at anticipation, drawdown, missed opportunities, and costs.
Final Thoughts
Volatility break filters are most useful when they help you stop treating every breakout as an opportunity.
A big candle can be convincing, but what happens around that candle is more important. Is the price remaining above the level? Are we seeing volatility broadening out from a quiet base or after an already lengthy move? Is there enough room for the risk to be worth it?
For your next 20 trading sessions, record the breakouts you see and note which ones meet your rules. Avoid changing the rules halfway through. Review the results when you have enough observations to make a fair comparison.
That small exercise can teach you more about your trading than adding another indicator to your chart.
Next read: Explore How to Find High-Probability Setups to build a more consistent process for identifying and evaluating trading opportunities.