
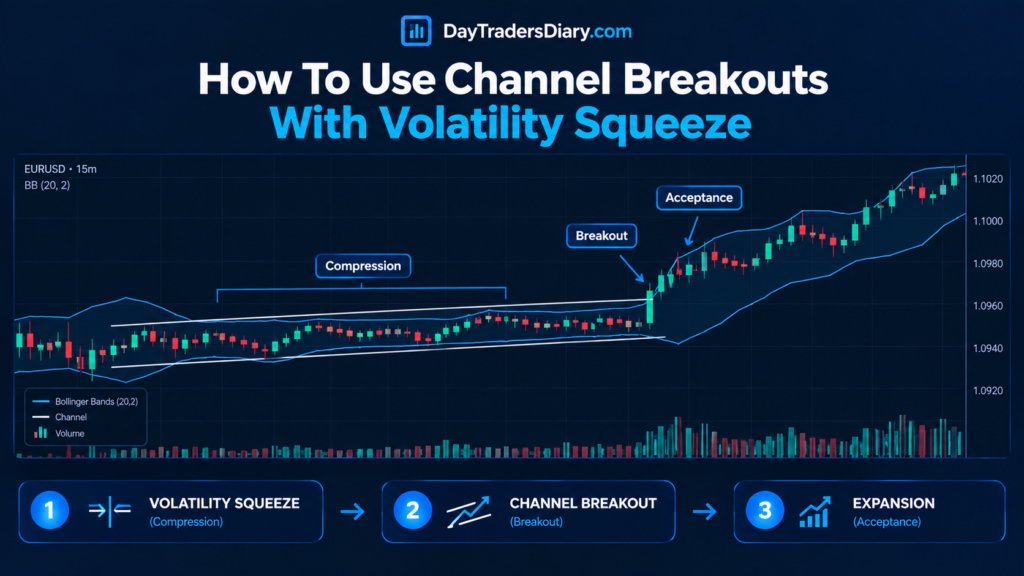
The breakout candle is usually the least interesting part of a breakout.
That sounds strange until you watch enough of them.
A trader sees price sitting inside a narrow range. The channel becomes obvious. Volatility contracts. Candles get smaller. Bollinger Bands tighten. The market looks ready to move.
Then price breaks the upper channel.
The trader buys.
Thirty seconds later, price falls back inside the channel.
The breakout was real enough to trigger the order, but not real enough to produce continuation.
This is where many traders misunderstand the relationship between a channel breakout and a volatility squeeze.
A squeeze does not mean a breakout must happen.
A channel does not mean the next break will trend.
And a break above resistance does not necessarily signal the market has accepted higher pricing.
The question to ask is:
When a market is compressed within a specified channel, what evidence tells you that the subsequent expansion has a fair likelihood of being directional rather than merely another liquidity sweep?
That is the problem this article addresses.
The goal is not to create another indicator combination that looks impressive on a chart. The goal is to build a decision process around three things that behave differently: price structure, volatility compression, and post-breakout acceptance.
What a Channel Breakout Actually Represents
A channel is simply a way of defining where price has been repeatedly contained.
The upper boundary represents an area where sellers have previously appeared or where buying has repeatedly failed to push price higher.
The lower boundary represents the opposite.
A breakout occurs when price moves beyond that established boundary.
But there is a critical difference between penetration and acceptance.
Penetration means price traded outside the channel.
Acceptance means price remained outside it long enough to demonstrate that the old range was no longer controlling the auction.
That distinction is responsible for a large percentage of breakout failures.
Imagine EUR/USD trading between 1.0840 and 1.0870 for several hours.
The upper channel is 1.0870.
Price trades at 1.0873.
A trader buys.
Price immediately returns to 1.0864.
The trader calls it a false breakout.
But what actually happened?
The market tested the boundary and rejected it.
The mistake was treating the first print above the channel as proof of acceptance.
A volatility squeeze makes this problem more interesting because compressed markets can produce an abrupt expansion in both directions.
The first expansion is information.
It is not necessarily the trade.
What Is a Volatility Squeeze?
A volatility squeeze occurs when price movement contracts relative to its recent behavior.
You can identify compression in several ways.
Bollinger Band width may contract.
Average True Range may fall.
The size of recent candles may decline.
A Donchian or price channel may become unusually narrow.
Realized volatility may fall relative to its recent range.
These are different measurements of a similar phenomenon: the market is moving less than it was previously.
John Bollinger describes Bollinger Bands as adaptive bands built around the observation that volatility is dynamic rather than static. That is important because a squeeze is not simply “low volatility.” It is a period in which the market’s current movement has compressed relative to its own recent behavior.
The practical implication is simple.
A squeeze tells you that the market’s current range of movement has become unusually compressed. It does not tell you which direction the next expansion will take.
That distinction should be written into every squeeze-based trading plan.
Why Volatility Compression Matters
Robert Engle’s Nobel Prize work on time-varying volatility provides one of the foundations for understanding this behavior.
Financial returns do not exhibit constant volatility. Quiet periods tend to cluster, and turbulent periods also tend to cluster. Engle describes this phenomenon as volatility clustering, where high-volatility periods are more likely to be followed by high-volatility periods and quiet periods are more likely to remain quiet for a time.
For a day trader, this has an important practical implication.
A quiet market does not necessarily stay quiet forever.
Eventually something changes.
New information arrives.
Orders become imbalanced.
A session opens.
A major level is reached.
Liquidity changes.
A scheduled economic release approaches.
Or traders who were comfortable inside the range begin repositioning.
The squeeze therefore matters because it tells you that the market is operating under a compressed volatility regime.
The breakout determines whether that compression is actually resolving into directional movement.
The Difference Between Compression and Preparation
This is one of the most important ideas in the entire setup.
A squeeze is not always “smart money building up before a breakout.”
That answer sounds tempting because it makes a neat story.
Markets are seldom that clean.
A narrow range can be the result of accumulation, distribution, temporary balance, uncertainty, waiting for news, lack of participation, or just inactivity.
You cannot determine the cause from the squeeze alone.
Instead, treat the squeeze as a state.
Then use price action to determine what happens when that state changes.
This approach prevents you from assigning a story to price before price has actually provided evidence.
The Channel Breakout Volatility Squeeze Framework
A practical framework can be built around four stages:
Compression.
Location.
Break.
Acceptance.
Compression tells you that volatility has contracted.
Location tells you whether the compression is occurring around a meaningful price area.
The break tells you which side of the channel is being tested.
Acceptance tells you whether the break has actually changed the market structure.
Most retail breakout strategies focus almost entirely on stage three.
The better process pays much more attention to stages two and four.
Stage One: Identify Genuine Compression
Do not call every small range a squeeze.
You want measurable contraction.
For example, suppose EUR/USD has an average five-minute true range of 8 pips during the previous hour.
The latest 10 candles average only 3.5 pips.
At the same time, the Bollinger Band width is near the lower end of its recent distribution.
The channel has narrowed significantly.
That is much more meaningful than simply saying:
“The candles look small.”
You can create your own squeeze measurement.
One simple version is:
Squeeze Ratio = Current ATR / Reference ATR
If the current ATR is 4 and the reference ATR is 8:
Squeeze Ratio = 0.50
The market is operating at approximately half the recent volatility level represented by your reference period.
The exact threshold is not universal.
You need to test it on the instrument and timeframe you trade.
Why Relative Volatility Is Better Than Absolute Volatility
A 5-minute ATR of 4 pips means very little without context.
EUR/USD during the Asian session may behave completely differently from EUR/USD during the London or New York overlap.
The same applies to gold.
A $2 average candle can be extremely quiet in one environment and completely ordinary in another.
That is why I prefer percentile or ratio-based measurements.
Ask:
How compressed is current volatility compared with this market’s recent behavior?
Not:
Is volatility low?
That small change in wording leads to better research.
Stage Two: Where Is the Squeeze Happening?
A squeeze in the middle of nowhere is less interesting than a squeeze around a meaningful level.
Imagine two setups.
Setup A has a tight range sitting directly underneath the previous session high.
Setup B has the same tight range in the middle of a larger trading range.
Both have identical Bollinger Band compression.
They are not the same trade.
Setup A is compressing beneath a known liquidity area.
A breakout could trigger stops, attract momentum traders, and force short positions to cover.
Setup B has less obvious structural significance.
The breakout may simply move price toward the opposite side of the larger range.
This is why channel location should come before breakout direction.
Stage Three: Wait for the Channel to Break
Now we reach the part everybody watches.
Price finally breaks the channel.
But do not immediately ask:
“Buy or sell?”
Ask:
How did price break?
There is a major difference between a breakout candle that closes strongly outside the channel and a wick that briefly crosses the boundary.
There is also a difference between a breakout that occurs during expanding volume and one that occurs during an illiquid period.
There is a difference between a breakout that moves directly into higher timeframe resistance and one that has open space in front of it.
The candle itself is only one piece of the evidence.
Stage Four: Acceptance Is the Real Confirmation
This is where the squeeze setup becomes much more robust.
Suppose the upper channel is 1.0870.
Price breaks to 1.0880.
Instead of buying immediately, you watch what happens next.
If price pulls back toward 1.0870 and buyers defend the area, the market has demonstrated something more useful than the original breakout.
It has shown that the former resistance may now be accepted as support.
That is acceptance.
You can enter on the retest.
Or you can enter on renewed momentum after the retest.
Or, depending on your strategy, you can use the first breakout as the trigger and the retest as confirmation.
There is no universally correct entry.
The important point is that your strategy should define what constitutes confirmation before you see the breakout.
Otherwise the trader starts inventing rules in real time.
The Three Types of Channel Breakout
I find it useful to classify breakouts into three categories.
Expansion Breakout
Price exits the channel with strong momentum, volatility expands, and price continues to hold outside the range.
This is the cleanest environment for momentum traders.
The challenge is avoiding chasing an already extended candle.
Breakout and Retest
Price exits the channel, returns toward the boundary, holds, and then resumes the original direction.
This is often easier psychologically because the trader has a defined invalidation point.
The disadvantage is obvious.
Sometimes there is no retest.
Price simply runs.
If you require a retest for every trade, you will miss some genuine expansions.
That is not necessarily a problem.
A missed trade is often cheaper than a badly defined trade.
False Breakout
Price exits the channel, fails to hold outside it, and returns into the range.
This is where traders can get trapped.
But it is also where the failed breakout itself becomes information.
If price breaks upward and immediately loses the channel, the market has shown that higher prices were rejected.
That can create a reversal setup, but only if your strategy has independently tested that behavior.
Do not turn every failed breakout into a reversal trade simply because it looks obvious afterward.
A Channel Breakout Volatility Squeeze Example
Imagine gold is trading at $2,640.
On the M5 chart, price has been trapped between $2,632 and $2,640 for 45 minutes.
ATR has fallen from $3.20 to $1.70.
Bollinger Band width is near its recent low.
The range is tightening directly beneath a prior intraday high at $2,642.
Now price breaks $2,642.
The first candle reaches $2,646.
The new buyer buys it immediately.
The more fastidious trader will pose three questions:
Is volatility really that much higher?
Did the candle close out side the range?
After initial expansion, will price hold over $2,642?
Suppose the next candle pulls back to $2,642.50 and buyers immediately defend the level.
Now the setup has improved.
The trader can define risk below the structural invalidation area rather than placing an arbitrary stop beneath the breakout candle.
That is the difference between trading a breakout and trading a breakout process.
What Happens When the Breakout Is Too Large?
This is another area where traders get into trouble.
A squeeze can create a large expansion candle.
The trader waits patiently for the breakout, then finally gets the signal.
But the candle has already moved three times the normal five-minute range.
Now the trader feels forced to enter because the setup has finally arrived.
This is where patience becomes expensive.
Suppose your planned risk is 10 pips.
The breakout candle has already moved 25 pips.
Your structural stop would require another 15 pips.
The trade no longer fits your original risk model.
You have three choices:
Wait for a pullback.
Reduce position size.
Skip the trade.
The worst choice is usually to increase risk simply because the market moved faster than expected.
Compression Followed by Expansion Is Not Enough
A common squeeze strategy is:
Low volatility.
Breakout.
Enter.
That is too simplistic.
The missing variable is directional context.
A squeeze creates potential energy, but it does not specify the direction of release.
A market can compress beneath resistance and break upward.
It can compress beneath resistance and fail upward.
It can break upward, trap buyers, and then produce a stronger downside move.
The same applies at support.
Therefore, the squeeze should be treated as a volatility condition, not a directional signal.
Use Higher Timeframe Structure as the Directional Filter
Suppose you are trading a 5-minute channel.
The 5-minute structure is bullish.
But the hourly chart is approaching major resistance.
That should change how you interpret the squeeze.
An upside breakout may still work.
But there is less room before the next structural obstacle.
Now reverse the situation.
The hourly structure is bullish and the five-minute squeeze forms below a prior high with open space above.
That is a different environment.
You are not guaranteed continuation.
You simply have more structural room for it.
This is why the higher timeframe should answer:
“Where could price reasonably travel?”
The lower timeframe should answer:
“How is price attempting to get there?”
The Hidden Variable: Channel Width
Channel width deserves more attention than it usually gets.
Suppose the channel is 20 pips wide.
A breakout of 2 pips is not necessarily meaningful.
But if price breaks 20 pips beyond the boundary while volatility expands, the market is behaving differently.
You can normalize the breakout by channel width.
For instance,
Breakout Expansion Ratio = Distance Outside Channel ÷ Channel Width
If the channel is 20 pips broad, and price goes 5 pips beyond it:
Expansion Ratio = .25
If price continues 20 pips:
Expansion Ratio = 1.0
This does not create a universal trading threshold.
It gives you a way to compare breakouts across different market conditions.
That becomes particularly useful in journaling.
Volatility Squeeze and ATR
ATR is useful here because it provides a simple measurement of recent true range.
But do not make the mistake of using ATR as a direction indicator.
ATR does not tell you whether price should rise or fall.
It tells you about the magnitude of recent movement.
That makes it useful for determining whether a breakout is occurring from a compressed regime.
A simple framework could compare:
Current ATR.
Longer reference ATR.
Width of channel.
Extension breakout.
You can then classify the setup.
Low ATR vs reference.
Narrow passage.
Strong break out.
ATR expansion.
That combination is more revealing than any one variable on its own.
A recent SSRN study of a Donchian channel breakout framework with ATR-based volatility filtering shows that the results of the tested strategy are sensitive to transaction costs, parameter selections, and market conditions. The authors were careful to state that their findings were narrow and instrument-specific, and not universal.
That limitation is actually useful for traders.
It tells you not to copy a published ATR threshold and assume it will work on EUR/USD, gold, Nasdaq futures, and crypto.
The threshold belongs to the instrument and strategy you tested.
Bollinger Bands and Channel Breakouts
Bollinger Bands can be used to determine compression as the breadth of the bands fluctuates with volatility.
However, in John Bollinger’s official material, volatility is stressed as changing, and Bollinger Bands can be used for all markets and timeframes.
But there is an important practical distinction.
Bollinger Bands are not necessarily your channel.
You can have:
A Donchian channel defining structural highs and lows.
Bollinger Band width defining volatility compression.
ATR measuring current movement.
Price action determining the breakout.
That combination gives each tool a different responsibility.
This is much cleaner than putting five indicators on the screen and asking all five to give the same signal.
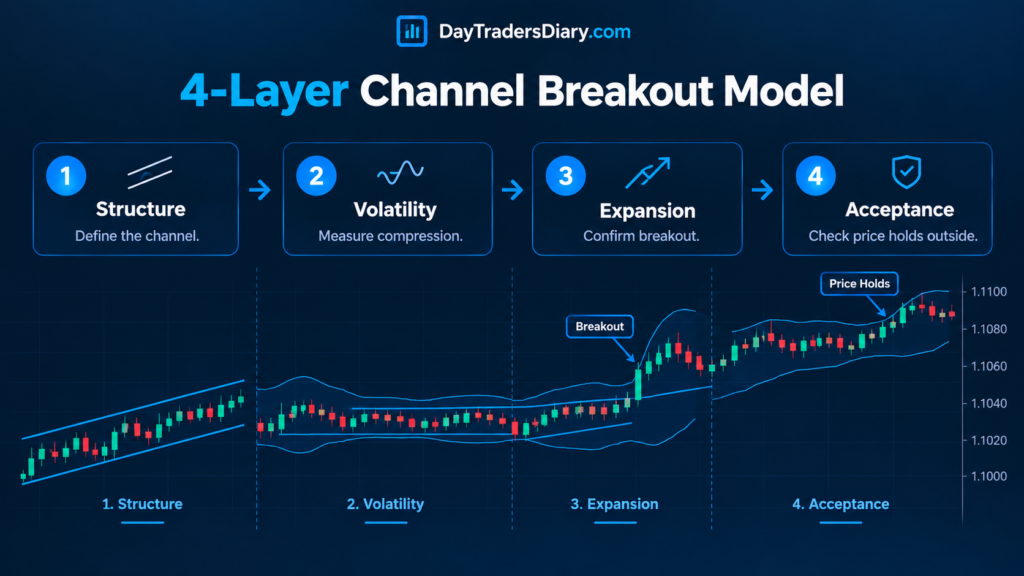
The Four-Layer Channel Breakout Model
A robust model can therefore look like this:
Layer 1: Structure
Where is the channel?
Layer 2: Volatility
Is the market actually compressed?
Layer 3: Expansion
Is volatility increasing as price leaves the channel?
Layer 4: Acceptance
Does price hold out of the channel?
If all four are in alignment, you have a high-information setup.
You just have a range if the first layer is all there is.
If there is structure and compression, but no expansion, you are waiting.
If expansion occurs but acceptance fails, you may have a false breakout.
This framework keeps the trader from confusing potential with confirmation.
The Volatility Squeeze Can Also Warn You Not to Trade
This is an underused application.
Sometimes the squeeze occurs immediately before a scheduled event.
Suppose EUR/USD is extremely compressed 10 minutes before CPI.
You see a perfect channel.
Bollinger Bands are tight.
ATR is low.
The range boundaries are obvious.
That does not mean the breakout setup is attractive.
It may mean the market is waiting for information.
The first expansion after the release may be too fast for normal execution.
Spreads can change.
Slippage can increase.
Both sides of the range can be swept.
The correct decision may be to wait until the initial volatility shock is absorbed.
A squeeze is therefore not always a reason to prepare an order.
Sometimes it is a reason to wait.
News Events Change the Meaning of a Squeeze
A compression before scheduled news is fundamentally different from a compression that develops naturally during a normal session.
Before news, the market may simply be waiting.
After news, compression may represent a temporary pause after a volatility shock.
During a normal session, compression may develop because buying and selling pressure have temporarily balanced.
These environments can look identical on a chart.
The cause is different.
That is why your trading journal should record the event context.
Avoid the “Energy Building” Story
You will hear traders describe a squeeze as energy building inside the market.
It is a useful metaphor.
But do not mistake the metaphor for market mechanics.
A compressed market does not contain a guaranteed amount of stored energy that must be released upward or downward.
Volatility is simply lower.
The future path remains uncertain.
The danger of the energy metaphor is that it makes the breakout feel inevitable.
It is not.
Treat compression as a change in statistical conditions, not a promise of movement.
A Better Way to Enter a Squeeze Breakout
There are three reasonable entry models.
Breakout Entry
Enter once price closes outside the channel.
This gives you early participation.
The trade-off is a higher exposure to false breaks.
Retest Entry
Wait for price to break and return to the channel boundary.
This gives you a more clearly defined structural level.
The trade-off is that strong breakouts may never retest.
Expansion Confirmation Entry
Wait for the breakout, and then go when the expansion of volatility continues with another structural confirmation.
This decreases false signals but creates later entries.
Neither is naturally better.
Your journal should identify which one provides the best expectation after spread, slippage, and failed trades.
The Importance of the First Pullback
One of the best pieces of information after a breakout is the first meaningful pullback.
Why?
Because the breakout itself tells you that price can move outside the channel.
The pullback tells you whether other participants are willing to defend that new territory.
Suppose the upper channel was 100.
Price breaks to 104.
Pulls back to 101.
Buyers defend 101.
Price then reaches 108.
The first pullback has demonstrated acceptance.
Now compare that with:
Break to 104.
Pullback to 99.
Return into the old range.
The market rejected the breakout.
That distinction is far more useful than staring at the breakout candle itself.
Risk Management for Channel Breakouts
The stop should be based on trade invalidation.
Not on the amount you want to lose.
Not on the width of the previous candle.
Not on an arbitrary 10-pip rule.
Suppose you buy an upside breakout and your thesis is:
“Price should hold above the former channel high.”
Then a sustained return into the channel may invalidate the thesis.
Your stop should reflect that logic.
Once the stop distance is known, calculate the position size.
This is where most traders miscalculate risk. Using a Position Size Calculator removes guesswork and prevents the trader from allowing the desired lot size to determine the monetary risk.
That becomes especially important after squeezes because the breakout candle can expand rapidly.
The market can move farther than expected while the trader is still deciding how much to buy.
Never Widen the Stop Just Because the Breakout Is Volatile
This mistake usually happens after entry.
The trader enters a breakout.
Price pulls back.
The stop is close.
The trader sees volatility expanding and thinks:
“I need to give it more room.”
Maybe.
But if you did not define the wider invalidation level before entry, you are changing the trade after receiving information that you dislike.
That is usually emotional risk management.
There is a better approach.
If volatility expansion means the normal stop is too close, define the structural stop before entering and reduce the position size accordingly.
If the required size becomes too small to justify the trade, skip it.
That is a professional outcome.
Risk Should Be Based on the Entire Setup, Not the Entry Candle
Suppose your account risk per trade is $100.
You identify a breakout with a structural stop 20 pips away.
You calculate the appropriate size.
Then price jumps another 10 pips before your order fills.
Your actual entry is now worse.
The stop distance is 30 pips.
Your original position size is no longer correct.
This is one reason entry quality matters.
The trade may still be valid.
But the position size should reflect the actual fill and actual invalidation distance.
This is quite similar to the entry delay problem discussed here in the DayTradersDiary post on Measuring Entry Delay Risk in Forex. The delay of execution affects the distance between entry and invalidation , significantly worsening a technically correct setup.
The Psychology of Chasing a Squeeze
Squeezes create a particularly strong psychological trap.
The trader watches the market compress for 30 minutes.
Nothing happens.
Then one large candle appears.
Suddenly the market is moving.
The trader feels that if they do not enter immediately, the opportunity will disappear.
That emotional reaction is predictable.
The solution is to define the entry conditions before the breakout.
For example:
I will enter only if the price closes outside the channel and the pullback afterward respects the border.
Otherwise:
If the breakout distance is still below the max expansion threshold, I will only allow the first one outside of the channel.
The exact rule is less important than having one.
When the breakout arrives, you should be executing a decision you already made, not negotiating with yourself.
When Channel Breakouts Fail Most Painfully
The most dangerous breakout is not necessarily the weakest one.
It is often the one that looks strongest.
A large candle breaks the range.
Everyone sees momentum.
Late traders enter.
Then the market reverses.
Why does this hurt so much?
Because the trader has entered at the worst location in the short-term structure.
The breakout candle creates emotional confidence while simultaneously increasing the distance to a sensible stop.
This is why expansion magnitude should be part of your model.
A breakout that has already traveled an unusually large multiple of recent volatility may still continue.
But your expected entry quality has changed.
You need to measure that rather than assume it.
Use a Maximum Extension Rule
One practical rule is to define a maximum acceptable breakout extension relative to ATR.
For example:
Maximum extension = 1.0 ATR beyond the channel.
That is only an example.
Your actual threshold should come from testing.
If a breakout has already moved 1.5 ATR beyond the channel before you can enter, perhaps your strategy’s expectancy deteriorates.
That is valuable information.
You do not need to predict a reversal.
You simply recognize that the original setup has moved beyond its tested entry conditions.
False Breakouts Can Become Information
Suppose price breaks upward after a squeeze and fails.
Do not automatically call the trade a loss of opportunity.
The failed breakout may reveal that the market is rejecting higher prices.
Now watch the lower side of the channel.
If price subsequently breaks the opposite boundary with expanding volatility, you may have a different setup.
This creates an interesting sequence:
Compression.
Upside break.
Rejection.
Return to range.
Downside break.
Expansion.
That is not the same trade as the original breakout.
Treat it as a new event.
Do not mentally combine the two.
Channel Breakouts and Liquidity Sweeps
This is particularly relevant for day traders using price-action concepts.
A channel high often contains clustered stops from traders who are short.
A break above that high can therefore trigger buying.
But if larger participants use that liquidity to execute opposing orders, price can quickly return inside the channel.
That is why the first move outside the channel should not automatically be interpreted as directional commitment.
A recent 2026 SSRN research on important currency pairs and gold studied breakout attempts and found considerable differences among instruments and regimes, with many breakouts failing or reversing in its FX sample. The study is an independent working paper and not a consensus, thus the particular data should not be accepted as general market truths. Its more general practical lesson is useful: breakout behavior can vary significantly by instrument and regime.
For your own trading, that means you should not assume that a channel breakout behaves identically on EUR/USD, GBP/JPY, gold, Nasdaq, and Bitcoin.
Test them separately.
Why Instrument Matters
A squeeze on EUR/USD may behave differently from a squeeze on XAU/USD.
Macro releases can trigger violent moves in gold.
Nasdaq futures can expand quickly with a rise in index volatility.
USD/JPY can be very sensitive to expectations of central banks.
Crypto trades 24/7 and can have volatility regimes outside of standard session patterns.
The channel calculation may be identical.
The behavior after the breakout is not.
Therefore, your journal should always record the instrument.
Do not combine everything into one strategy statistic unless you have enough data to justify doing so.
Session Timing Matters Too
A channel breakout during the middle of an inactive session is not the same as one occurring near a major market open.
Liquidity changes.
Participation changes.
Spreads can change.
The probability of follow-through can change.
A squeeze that forms before London opens can be a preparation phase for increased participation.
A squeeze that forms during the middle of an already active session may have a different interpretation.
The setup is the same visually.
The market context is not.
How To Build a Day Trading Channel Breakout Scanner
If you want to make this process systematic, start with simple conditions.
Look for a narrow channel over a defined number of candles.
Measure channel width relative to ATR.
Measure current ATR relative to a longer reference ATR.
Identify the location of the channel relative to higher timeframe structure.
Then wait for the breakout.
Once the breakout occurs, measure:
Distance outside channel.
Breakout candle range.
Volume if reliable for the instrument.
ATR expansion.
Retest behavior.
Distance to the next higher timeframe level.
You now have a dataset.
You can test whether certain combinations actually produce better results.
That is far more useful than optimizing an indicator until the historical chart looks perfect.
Do Not Optimize the Squeeze to Death
This is another problem I have seen repeatedly.
A trader starts with:
Bollinger Band squeeze.
Then adds:
ATR filter.
Then adds:
RSI.
Then volume.
Then moving-average slope.
Then session filter.
Then candle pattern.
Eventually the strategy takes three trades a month.
It looks fantastic in hindsight.
But the system may simply be overfitted.
The goal should be to identify the smallest number of variables that explain a meaningful difference in expectancy.
For this setup, the core variables are usually enough:
Compression.
Location.
Breakout quality.
Acceptance.
Risk.
Everything else should earn its place through testing.
How To Journal a Channel Breakout
Your Trade Journal Template should capture the setup before and after the trade.
Record the channel width.
Record the ATR.
Record the squeeze ratio.
Record whether Bollinger Band width was compressed relative to its recent history.
Record the higher timeframe location.
Record the breakout direction.
Record the breakout extension.
Record whether price retested the channel.
Record maximum adverse excursion.
Record maximum favorable excursion.
Record the final result in R.
Most importantly, record whether you entered on the breakout, retest, or later confirmation.
After 30 to 50 trades, compare the groups.
You may find that breakout entries produce a higher win rate but lower average R.
You may find that retests produce fewer trades but better expectancy.
You may find that your strategy works only when channel width is below a certain percentile.
You may find that none of the squeeze measurements matter once session timing is controlled.
That is exactly the kind of information a serious trading journal should uncover.
Measure the Setup in R, Not Just Dollars
Suppose you lose $100 on one breakout and make $300 on another.
That means little without knowing the planned risk.
If both trades risked $100, the results are -1R and +3R.
Now they can be compared.
Do the same with squeeze trades.
Your task is to see whether your R distribution is better under some volatility circumstances.
For example,
Normal channel breakout: +0.12R expectation.
Clean acceptance after strong squeeze +0.34R.
Strong squeeze followed by immediate failed breakout: -0.42R.
Those are actionable observations.
Dollar profits are not.
A More Useful Performance Metric: Expansion-to-Risk Ratio
One useful research variable is the relationship between breakout expansion and initial risk.
Assuming the price breaches the channel by 10 pips and your first risk is 10 pips.
Expansion to risk ratio = 1.
If price breaks 30 pips and your first risk is 10 pips.
Expansion to risk ratio = 3.
The bigger the ratio, the more you are entering after a move in relation to your anticipated risk.
That does not necessarily mean the trade is bad.
It means the entry is later.
You can then test whether late entries perform differently.
This is a much more useful question than:
“Do big breakout candles work?”
The Relationship Between Squeeze and Reward-to-Risk
A squeeze can improve the potential reward-to-risk because price begins from a relatively compressed range.
But there is a trap.
Traders sometimes project the entire channel width as a guaranteed target.
For example:
Channel width = 30 pips.
Breakout occurs.
Trader assumes a 30-pip continuation target.
There is nothing inherently wrong with testing that.
But the market does not owe you a move equal to the width of the previous range.
The channel width is a measurement.
It is not a promise.
Targets should be based on your tested strategy and nearby market structure.
Scaling Your Strategy as Capital Grows
Once you have a tested channel breakout process, the next challenge is scaling.
The temptation is to increase size because a few recent trades worked.
That is backwards.
Scale when your process has demonstrated stability, not simply because your confidence has increased.
If your strategy risks 0.5% per trade on a personal account, scaling capital can increase the dollar value of the same percentage risk without requiring you to alter the strategy.
But the psychological response to larger dollar losses can be different.
A trader who handles 0.5% comfortably on a $10,000 account may react differently when the same percentage represents a much larger amount.
That is why capital scaling and position scaling should be treated as separate decisions.
Evaluation Accounts and the Scaling Problem
This is one reason professional traders sometimes consider evaluation-based proprietary trading programs.
The attraction is not simply the headline account size.
The real attraction is the possibility of applying a tested process to a larger capital allocation while keeping personal capital exposure structurally different from a traditional self-funded account.
But the model introduces rules.
Those rules matter.
The5ers’ current High Stakes program, for example, uses a two-step evaluation and publishes a 5% maximum daily loss and 10% maximum loss, with scaling milestones that can take the program toward $500,000 depending on the account and progression. It also states that holding positions over high-impact news is allowed while new order execution is restricted from two minutes before to two minutes after the event.
That latter factor is immediately relevant to squeeze traders.
Imagine your strategy is targeting the compressed ranges just ahead of CPI.
If your testing program does not allow you to run during the news window, don’t expect that your typical strategy will carry over unmodified.
The same applies to futures programs, where The5ers currently publishes different rules, including a 4% maximum loss, 40% per-position consistency requirement, contract limits, and scaling mechanics.
Other firms use different rules.
The correct process is to compare the actual trading restrictions against your tested strategy.
If your channel breakout method works on normal sessions and you can operate it within the rules, an evaluation such as The5ers High Stakes can be considered as one possible route for scaling trading capital.
The key is not passing an evaluation quickly.
The key is demonstrating that your existing risk process survives the evaluation rules.
The Trader Who Scales Too Early
Here is a common sequence.
The trader develops a squeeze breakout strategy.
The first 10 trades produce strong results.
Confidence increases.
Position size doubles.
The next five trades include three normal losses.
The trader believes something has changed.
It has.
But not necessarily in the market.
The position size has changed.
The psychological response has changed.
The trader begins interfering with exits.
They skip valid setups after losses.
They chase the next breakout.
They widen stops.
A strategy that was profitable at 0.5R risk becomes untradeable at 1.5R because the trader is no longer executing the same process.
This is why scaling should be boring.
If scaling feels exciting, it is probably happening too quickly.
A Practical Channel Breakout Routine
Before the session, identify major higher timeframe levels.
During the session, watch for a channel to develop.
Measure widthwise.
Compare present volatility with past volatility.
See whether the channel is growing and approaching meaningful structure.
“Wait for the break.
Measure the growth.
If the move is already outside your tested entry conditions, don’t chase the move.
If your system requires acceptance, wait for the retest.
Calculate the actual stop distance.
Use the Position Size Calculator.
Enter only if the resulting size and reward structure still fit the plan.
After the trade, record the setup.
That routine is intentionally simple.
Complexity is not the objective.
Repeatability is.
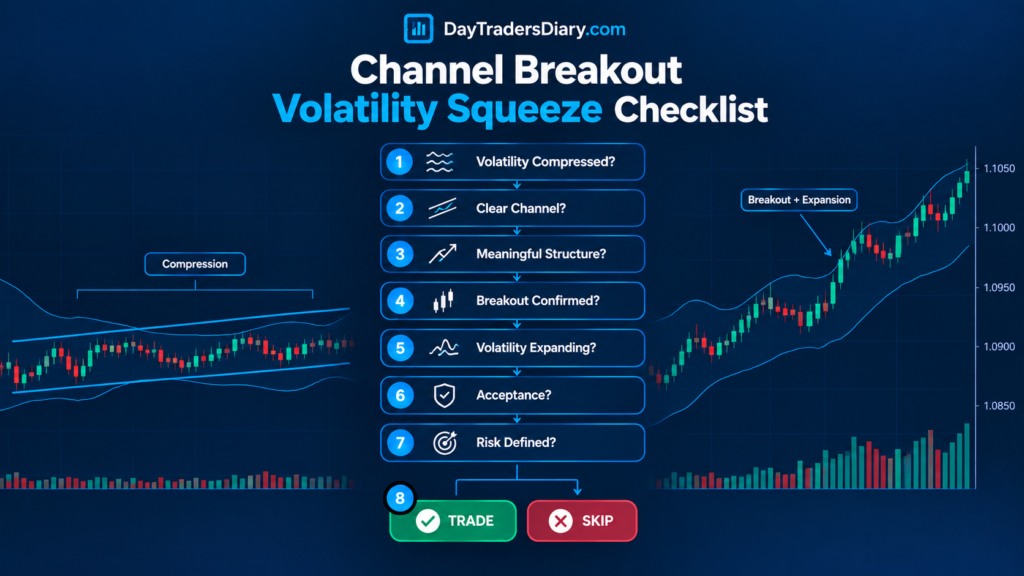
A Decision Tree for the Setup
You can reduce the entire method to a sequence of questions.
Is volatility compressed?
No = Not a squeeze setup
Is there a clearly defined channel?
If no, there is no objective breakout level.
Is the channel located at meaningful structure?
If no, the breakout may have less contextual significance.
Is the price really breaking the channel?
If not, wait.
Has the break caused more volatility?
If not, the breakout may not have enough momentum.
Is the pricing acceptable from outside the channel?
If not, maybe hold off.
Structurally, is the stop valid?
If not, there is no trade.
Position size within the risk limit?
If not, lower size or skip.
Does the arrangement still have an acceptable expectation after costs and slippage?
If not, move on.
That is a trading framework rather than an indicator signal.
What Research Can and Cannot Tell You
The research around volatility clustering is well established.
The fact that volatility changes over time and tends to cluster is foundational to modern financial econometrics. Engle’s Nobel-recognized work formalized ways of modeling that behavior.
Research into specific breakout systems is much more conditional.
Recent studies examining Donchian breakouts, opening-range breakouts, and other technical rules have produced results that depend heavily on market, timeframe, transaction costs, parameter selection, and testing methodology. For example, recent SSRN work on breakout systems has found both positive results under particular specifications and weak or nonexistent results under other specifications.
That is exactly why traders should be cautious about claims such as:
“Volatility squeezes always precede big moves.”
They do not.
Or:
“Channel breakouts have a high win rate.”
That depends on the channel, market, timeframe, entry, exit, costs, and regime.
The useful lesson from research is not that one indicator is secretly the answer.
It is that market behavior is conditional.
Your job is to identify the conditions under which your particular setup performs.
Frequently Asked Questions
What is a channel breakout volatility squeeze?
A channel breakout volatility squeeze is when price is squeezed in a relatively narrow channel and the volatility decreases, then expands and breaks the boundary of the channel. The squeeze tells you compression is happening and the breakout tells you if price is trying to break out of the range.
Does a volatility squeeze predict a breakout?
Nope. A squeeze is a way to identify unusual compression in volatility, not direction. The price can break up or break down or make a fake breakout and go back to the range.
How do you trade a channel breakout after a squeeze?
First, locate quantifiable compression and a clear channel. Then wait for the price to break the channel. Depending on your tested technique, you can enter on the breakout, on a retest of the channel boundary, or after further confirmation. Position size should be determined by the structural stop, not the size of the breakout candle.
What is the best indicator for a volatility squeeze?
There is no universally best indicator. Bollinger Band width, ATR, realized volatility, and channel width can all measure different aspects of compression. A useful approach is to give each measurement a specific job instead of stacking multiple indicators that all measure similar information.
Should I buy when price breaks the upper channel?
Not necessarily. The upward breakout must be put in context. The quality of the setup can be influenced by higher timeframe resistance, the size of the breakout, growth of volatility, liquidity, and post-breakout acceptance.
What is a false breakout after a volatility squeeze?
It happens when price exits the compressed channel but does not stay outside it and comes back to the original range. Sometimes an unsuccessful breakout turns into a reversal setup, but that behavior should be investigated independently, not assumed.
How does ATR help with channel breakouts?
ATR gives an assessment of recent price movement. You can compare the current ATR to a longer reference to help you spot volatility compression and expansion. ATR can also help you with normalizing breakout size and position sizing.
Should I wait for a retest after a channel breakout?
It is contingent upon your tested entry model. A retest can give a more definitive amount of invalidation; however, powerful breakouts don’t retest sometimes. Breakout versus retest notes in your diary should give the right choice.
How much should I risk on a squeeze breakout?
The amount should be determined by your established risk model, not by how attractive the breakout looks. Once the structural stop is identified, position size can be calculated so the potential loss remains within the predefined risk limit.
Can channel breakout strategies work for forex and gold?
They can be tested on both, although they can behave quite differently. Breakout characteristics can vary with session time, liquidity, volatility, sensitivity to news, spread and instrument particular market structure. Don’t expect EUR/USD results automatically work in gold.
Can a volatility squeeze help with day trading?
Yes. As a market-state filter. This may be helpful in finding periods where the volatility has shrunk, and a prospective growth is underway. It’s not a directional signal by itself.
The Breakout Is Only the Beginning
The biggest upgrade you can make to a channel breakout strategy is to stop treating the breakout candle as the complete signal.
The candle tells you price crossed a boundary.
The squeeze tells you volatility had contracted.
The expansion tells you the volatility regime may be changing.
The retest tells you whether the old boundary is being accepted or rejected.
The risk calculation tells you whether the trade is actually executable.
Your journal tells you whether any of those observations improve your results.
That is the complete process.
For your next 30 channel breakout trades, record one thing most traders ignore: the state of volatility immediately before the breakout and the amount of expansion already completed when you entered.
Then separate the trades into compressed and non-compressed conditions.
Do the same with breakout entries versus retest entries.
You may find that the squeeze improves your setups.
You may find that it only helps during certain sessions.
You may find that the best trades occur after the first false break rather than the first breakout.
That is the kind of discovery that creates a real trading edge.
Do not try to predict every expansion.
Learn to recognize when compression, location, breakout quality, and acceptance are aligned.
For your next read, study how to measure entry delay risk in Forex. A breakout can be perfectly identified and still become a poor trade if your actual entry arrives too far from the planned price. That connection between breakout quality and execution quality is where many otherwise profitable strategies lose their edge.