
A trader can be completely right about direction and still trade the wrong setup.
This happens more often around major economic events than many day traders realize. EUR/USD may look bullish on the five-minute chart. The higher timeframe may show a clean bullish structure. Momentum may be expanding. Yet the market can still behave nothing like the trader expects once a major central bank decision, inflation report, employment release, or geopolitical shock enters the equation.
One reason is that spot traders usually look at only one side of the market.
They look at price.
Options traders are looking at something else too: what the market is willing to pay for protection and convexity at different prices.
That is where the volatility smile becomes useful.
A volatility smile is not a magic indicator that tells you whether EUR/USD will rise or fall. It is better understood as a map of how the options market prices uncertainty across different strike prices. When the curve changes shape, the market is not simply saying that volatility is higher or lower. It can also be saying that uncertainty is becoming more expensive in one direction than the other.
For a day trader, that distinction matters.
A rising implied volatility environment can tell you that the market expects larger movement. A steepening downside skew can tell you that protection against a sharp fall is becoming relatively expensive. A flattening smile can indicate that the asymmetry between tails is changing.
None of these observations should replace price action.
They can, however, change how aggressively you trade price action.
That is the practical purpose of understanding the volatility smile.
What Is a Volatility Smile?
The simplest way to understand a volatility smile is to imagine plotting implied volatility against option strike prices for options with the same expiration.
In a perfectly simplified Black-Scholes world, options with the same maturity would theoretically be associated with the same volatility input. In real markets, they are not.
The implied volatility derived from option prices changes depending on the strike.
Plot those implied volatilities and the curve can look like a smile.
The left and right sides of the curve represent options further away from the current underlying price. The middle generally represents options close to at-the-money.
A simplified volatility smile might look conceptually like this:
Low implied volatility near the center.
Higher implied volatility toward both tails.
That is the traditional “smile.”
But here is where traders often make their first mistake.
They assume every volatility curve should look symmetrical.
It does not.
In many markets, especially equity markets, the curve is heavily tilted toward downside protection. In FX, the shape can also become strongly asymmetric, and the direction of that asymmetry can change with market conditions.
That is why traders often use the broader terms “volatility smile,” “volatility skew,” and “risk reversal” when discussing the same family of information.
They are related, but they are not identical.
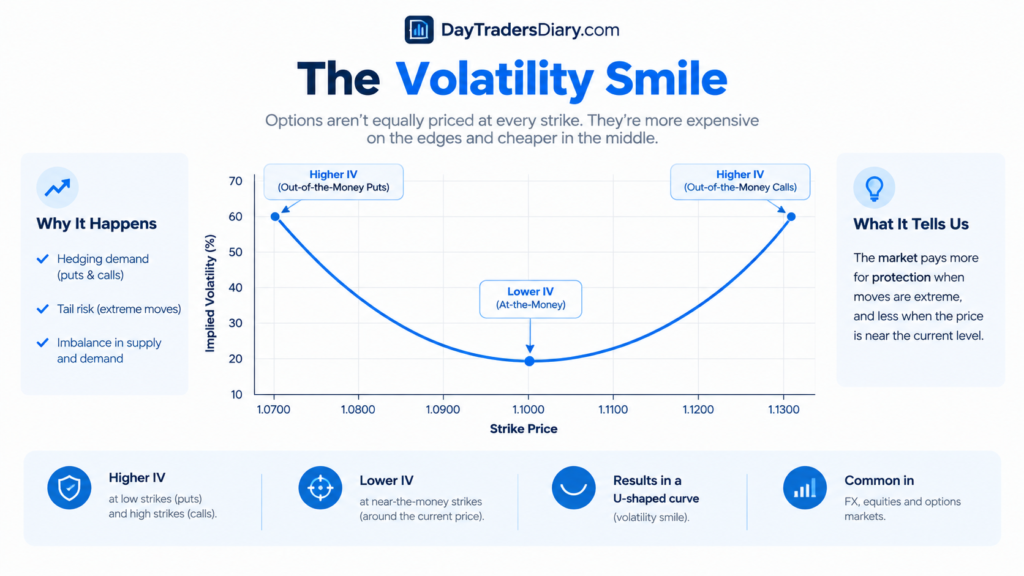
Volatility Smile vs Volatility Skew
Volatility smile – the link between implied volatility and strike or moneyness.
That asymmetry in the relationship is called a volatility skew.
Take a look at EUR/USD options with the same expiration dates.
Suppose the at-the-money implied volatility is 8%.
A lower-strike option has implied volatility of 9%.
A higher-strike option has implied volatility of 8.5%.
That is not a symmetrical smile. The downside is priced differently from the upside.
The real question is:
“Why?”
The solution could include desire for hedging, perception of tail risk, positioning, supply and demand for options, assumptions on correlation, and predictions of future events.
The Bank for International Settlements has long documented how FX options markets use risk reversals to express the difference between implied volatility on out-of-the-money calls and puts. That information gives traders a way to observe whether the market is placing a greater premium on one tail than the other.
For an active day trader, this is much more useful than memorizing the definition of a smile.
You want to know what the asymmetry is saying about the environment in which your setup is developing.
The Three Pieces of Information Traders Should Separate
When I look at volatility information, I do not treat the smile as one number.
There are three different questions.
First, how high is overall implied volatility?
Second, how different is the implied volatility between upside and downside options?
Third, how quickly is that relationship changing?
Those questions produce very different trading information.
A high overall implied volatility environment means the market is pricing larger uncertainty.
An asymmetric smile tells you that uncertainty is not being priced equally in both directions.
A rapidly changing smile tells you that the options market is repricing the distribution of possible outcomes.
That third point is often overlooked.
The level can be interesting.
The change can be much more interesting.
Why Implied Volatility Is Not the Same as Expected Direction
This distinction will save you from a lot of bad trades.
Suppose EUR/USD one-week implied volatility rises sharply.
That does not mean EUR/USD is expected to fall.
It means the options market is pricing greater uncertainty about future movement.
The market could move aggressively higher.
It could move aggressively lower.
It could initially move in one direction and then reverse.
Implied volatility is therefore closer to a measurement of expected movement and uncertainty than a simple directional forecast.
The BIS has described implied volatility as information about the dispersion of market participants’ expectations. That is important because a trader looking only at the volatility level may accidentally convert an uncertainty signal into a directional signal.
Do not make that conversion automatically.
If implied volatility rises while the spot market breaks higher, you have a very different situation from implied volatility rising while spot breaks lower.
The options market provides context.
Price provides the immediate confirmation.
What Does a Volatility Smile Chart Actually Tell You?
A volatility smile chart can answer a question that a normal price chart cannot:
How expensive is protection or convexity at different prices?
Imagine EUR/USD trading at 1.1000.
You examine one-week options.
The at-the-money implied volatility is 7.2%.
The 25-delta put implied volatility is 8.0%.
The 25-delta call implied volatility is 7.4%.
The market is therefore charging more implied volatility for the downside option than the comparable upside option.
That does not guarantee a decline.
It tells you that downside optionality is relatively expensive.
That difference can reflect hedging demand or concern about downside tail events.
Now imagine the same market a week later.
ATM volatility remains around 7.2%.
But the put rises to 8.5% while the call stays near 7.3%.
The overall volatility level has not exploded.
The asymmetry has changed.
For a day trader, that can be more informative than simply seeing that volatility is “high.”
Risk Reversal: One of the Most Useful FX Smile Measurements
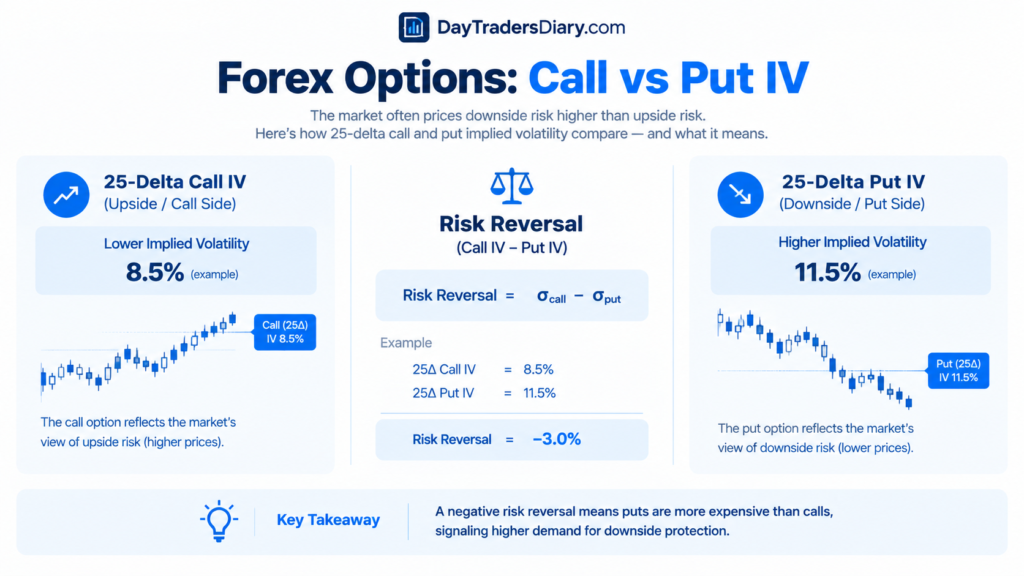
Risk reversals are a typical way for FX traders to refer to the relative implied volatility of OTM calls and options with similar deltas.
A simplified 25-delta risk reversal can be written as:
25D Risk Reversal = 25D Call IV – 25D Put IV
The exact market convention depends on the currency pair and quote convention, so traders should always verify the convention used by their data provider.
But conceptually, the idea is straightforward.
If call volatility is greater than put volatility, the risk reversal is positive.
If put volatility is greater than call volatility, the risk reversal is negative.
A negative reading therefore indicates that comparable downside protection is carrying a higher implied volatility premium than the upside option under that convention.
That can be particularly useful in FX because currency markets often have asymmetric macro risks.
For example, suppose the market is approaching a major central bank decision.
EUR/USD is trading near a resistance level.
Price action looks bullish.
But the short-dated risk reversal is becoming increasingly negative.
That does not mean you should immediately short EUR/USD.
Instead, it changes the quality of the information surrounding the breakout.
If EUR/USD breaks resistance and holds, price has demonstrated actual buying.
But if the breakout immediately fails and downside liquidity is taken, the asymmetric options pricing gives you additional context for why downside hedging may have been receiving attention.
That is a much more professional interpretation.
Butterfly Volatility Helps You See the Curvature
Risk reversal tells you about asymmetry.
Butterfly volatility gives you another piece of the puzzle: how expensive the wings are relative to the center.
A 25-delta butterfly in simplified form is:
25D Butterfly = [ (25D Call IV + 25D Put IV) / 2 ] – ATM IV
The specific construction may vary according to market convention.
The intuition matters more than the formula.
If the butterfly increases, options away from the center are becoming relatively expensive compared with at-the-money volatility.
That can indicate that the market is placing more value on tail outcomes.
Now combine the two.
Risk reversal tells you which side is relatively more expensive.
Butterfly tells you how much the wings are being priced relative to the center.
Together they provide a much richer picture than looking at a single implied volatility number.
A Volatility Smile Forex Example
Consider EUR/USD ahead of a major ECB announcement.
Spot is trading at 1.0900.
The intraday chart has been forming higher lows.
A trader sees a bullish consolidation and plans to buy a breakout above 1.0930.
Now imagine the options market shows the following:
ATM implied volatility: 7.0%
25D call volatility: 7.1%
25D put volatility: 8.0%
25D risk reversal: strongly negative
25D butterfly: elevated
What does this tell us?
Not that EUR/USD must fall.
It tells us that the market is paying a meaningful premium for downside and tail protection.
That should affect execution.
Instead of blindly buying the first move through 1.0930, the trader can demand stronger confirmation.
For example, the trader may wait for a break above resistance, a pullback that holds the former resistance zone, and renewed buying momentum.
The options information has not generated the trade.
It has changed the standard required to accept the trade.
That is one of the most useful applications of volatility smile analysis for a day trader.
The Best Use of the Smile Is Often as a Filter
This is where I think many traders misuse derivatives information.
They try to turn everything into an entry signal.
That is usually a mistake.
A volatility smile is much more useful as a filter.
Suppose your normal breakout strategy performs well when short-term volatility is balanced.
You discover from your journal that your worst losses occur when downside skew becomes extreme before major announcements.
You do not necessarily need to create a completely new strategy.
You can create a filter.
When the smile is relatively balanced, trade the setup normally.
When the smile becomes strongly asymmetric, reduce size or require confirmation.
When both implied volatility and the smile are changing rapidly around a major event, avoid treating a normal technical breakout as a normal market condition.
That is a decision framework.
It is also something you can test.
A Four-State Volatility Framework
One useful framework is to classify the options environment into four states.
State One: Low Volatility and Balanced Smile
This is often the easiest environment for structured technical setups.
Price movement is relatively contained and neither tail is receiving an obvious volatility premium.
Breakouts may still fail, but the market is not obviously pricing a major directional tail.
You can follow your usual setup rules.
The fallacy here is to assume that minimal volatility indicates low risk.
A tight market can move quickly.
State Two: High Volatility but Balanced Smile
Here, the market expects movement but does not show an obvious directional asymmetry.
This is where traders often need to adjust stop placement and position size.
If expected movement is larger, a stop that worked perfectly during quiet sessions may become noise.
The answer is not automatically to widen the stop.
The answer is to calculate the correct size for the structural stop.
That distinction matters.
State Three: High Volatility and Strong Skew
This is the environment where the smile becomes particularly valuable.
The market is pricing larger movement and placing a greater premium on one side.
This can be an important warning that the distribution of outcomes is becoming asymmetric.
A day trader should be especially careful about fading strong momentum simply because a price level looks extended.
At the same time, blindly following the expensive tail can be equally dangerous.
Options pricing reflects risk and demand. It does not guarantee the next move.
State Four: Rapid Smile Repricing
This is the state I pay the most attention to.
If the grin is changing abruptly and the spot is also moving fiercely, the market is repricing both direction and uncertainty.
This might occur around central bank pronouncements, inflation figures, employment releases, political shocks, worries of intervention, or unanticipated geopolitical events.
The usual technical setup may still appear on the chart.
The market regime, however, has changed.
That is when a trader should question whether the historical statistics behind the setup still apply.
The Most Important Question: Is the Smile Confirming or Contradicting Price?
Rather than asking:
“Is the volatility smile bullish or bearish?
Question:
“Is the options market in line with what price is doing?”
Take a bullish EUR/USD breakout for example.
Price breaks out of resistance.
The momentum builds.
Volume increases.
The breakout retests successfully.
Meanwhile, downside skew begins to flatten.
That combination is more internally consistent than a breakout accompanied by rapidly increasing downside protection demand.
Again, this is not creating assurance.
It works.
Now think the other way.
Price breaks out of resistance but gives it back immediately.
And momentum dies.
Then the breakout is a liquidity grab.
At the same time, downside implied volatility rises sharply.
The smile is now providing context to the failed breakout.
The options market did not predict the failure.
It helped you interpret the failure.
That is a much more realistic use of derivatives information.
Volatility Smile and Liquidity Sweeps
There is an interesting connection between smile analysis and liquidity behavior.
Day traders often see price take a prior high or low and immediately reverse.
They call it a liquidity sweep, stop hunt, false breakout, or failed auction depending on their framework.
The mistake is assuming the options market must independently predict that event.
It cannot.
But the smile can help identify whether the market is entering an environment where a sharp tail move is being priced differently.
If USD/JPY is approaching a major high ahead of a Bank of Japan statement.
The price is under pressure from resistance.
Implied volatility, short-dated, increases.
The downward wing is getting more and more expensive. A breakout occurs.
It fails.
Price falls through the intraday range.
The options market did not tell you exactly where the reversal would happen.
But it told you that the market was not pricing upside and downside risk symmetrically.
That is valuable context for deciding whether to chase the first breakout candle.
When Volatility Smile Information Should Make You Trade Less
This is one of the most practical applications.
Traders usually use volatility information to find opportunities.
Experienced traders also use it to identify situations where their normal setup deserves less trust.
Imagine your strategy normally risks 0.5R on a breakout.
You discover through testing that when short-dated implied volatility is elevated and downside skew is extreme, your breakout failure rate increases.
I think the right thing to do is not necessarily to reverse your strategy.
It could simply be:
0.5R in the typical situation.
0.25R when stressed.
Do not trade if the conditions are outside your tested threshold.
That’s how derivatives information is incorporated into risk management, rather than just another indication on a crowded chart.
Do Not Confuse a Volatility Smile With a Forecast
This deserves repetition.
A volatility smile is not saying:
“EUR/USD will fall.”
It is saying something closer to:
Options at these strikes are being priced with more or less implied volatility than options elsewhere.
That difference may contain information about perceived tail risk, hedging demand, supply and demand, or market positioning.
But implied volatility is a risk-neutral market price, not a guaranteed real-world probability.
This distinction is essential.
The BIS has used option-implied information, including risk reversals, to study how markets price tail risks. The same research framework also demonstrates why these measures can contain useful information without becoming perfect directional forecasts.
For a day trader, that means the smile belongs in the context layer of your process.
Not the trigger layer.
How to Read a Volatility Smile Chart Without Overcomplicating It
When you open a volatility smile chart, do not immediately start calculating every Greek.
Begin with five questions.
Where is spot in relation to the strikes?
What is the ATM implied vol?
Which wing is more costly?
Is the smile getting steeper or flatter?
Is the change occurring when spot is moving or when spot is reasonably stable?
That last question is particularly important.
A smile that changes while spot is quiet may represent positioning or hedging demand.
A smile that changes violently while spot is moving can represent an active repricing of risk.
Those are not identical situations.
A Practical Intraday Routine
Before a major trading session, first identify whether there is an event capable of materially changing volatility.
Then examine the relevant short-dated options information if you have access to it.
Look at ATM volatility.
Look at the 25-delta call and put volatility.
Look at the risk reversal.
Look at the butterfly.
Then compare the current values with their recent range.
You are not trying to predict the market.
You are building a volatility map.
Next, go to your normal price chart.
Mark the major structural levels.
Identify where your setup normally occurs.
Now ask whether the volatility environment supports normal execution or requires more selectivity.
For instance, if your breakout technique typically demands a clean close above resistance, you might need a retest when short-dated volatility and skew are high.
If the volatility environment is quiet and balanced, your standard execution model may be adequate.
Rules should be based on testing, not just intuition.
Why Historical Comparison Matters More Than the Absolute Number
A trader might see 9% implied volatility and think:
“That is high.”
But high compared with what?
A 9% implied volatility reading may be unusual for one currency pair and ordinary for another.
Even within the same pair, the appropriate interpretation depends on maturity and market regime.
This is why percentile-based analysis is often more useful than absolute levels.
Suppose one-week EUR/USD implied volatility is currently at 8%.
If the last year’s observations show that 8% is near the 90th percentile, the environment deserves more attention.
If 8% is around the 40th percentile, the same number means something completely different.
The same principle applies to risk reversal and butterfly values.
You want to know whether today’s smile is normal for the current market or unusual.
How Day Traders Can Use Smile Data Without Trading Options
You do not need to trade options to benefit from options information.
This is an important distinction.
A spot FX trader can use the options market as a source of market-condition information.
For example, an EUR/USD day trader might use short-dated implied volatility and risk reversal data to classify the session.
A gold trader might monitor broader volatility and cross-asset risk conditions.
An index trader might use SPX implied volatility and skew to understand whether downside protection is becoming unusually expensive.
The options market becomes an additional layer of information.
Price remains the execution instrument.
Volatility Smile and Position Size
This is where the concept becomes directly relevant to risk management.
Suppose your trading system normally risks $100 per trade.
A volatility expansion does not automatically justify risking $150.
In fact, the opposite may be appropriate.
If the market is pricing larger potential movement, your existing stop distance may become statistically easier to hit.
That means your position size may need to decrease.
For example, suppose your normal stop is 20 pips and you risk $100.
If market conditions force you to use a 35-pip structural stop, you should not keep the same lot size simply because the setup still looks attractive.
The risk calculation has changed.
This is where most traders miscalculate risk.
Using a Position Size Calculator removes guesswork by forcing the trader to start with account risk and stop distance rather than allowing the desired trade size to determine the risk afterward.
The sequence has to be:
Structure of the market.
Level of invalidation.
Funds risk.
Position sizing.
Implementation.
Not:
Preferred position size.
Emotional halt.
HOPES.
That distinction is particularly crucial when the volatility smile data is telling you that the market is entering an extremely uncertain regime.
Volatility Expansion Can Make Good Entries Look Bad
Here is a subtle problem.
A trader may correctly identify a breakout but use a stop based on ordinary market conditions.
The trade gets stopped.
Price then continues in the original direction.
The trader concludes that the strategy failed.
Sometimes the strategy did not fail.
The volatility assumption failed.
This is why volatility should be connected to execution statistics.
If your average stop-out excursion increases dramatically during high-implied-volatility periods, you need to know that before increasing your stop distance or reducing your size.
A volatility smile can help identify those environments.
Your trade journal tells you whether the observation is actually valid.
Journaling Volatility Smile Effects
Do not write:
“Volatility was high.”
That is almost useless.
Record measurable information.
For each relevant trade, record the volatility regime, approximate implied volatility level if available, risk reversal direction, whether the smile was steepening or flattening, the distance between entry and invalidation, realized excursion after entry, maximum adverse excursion, maximum favorable excursion, and whether the trade occurred before or after a major scheduled event.
Then categorize the result.
Was it the usual strategy loss?
Was the stop too tight for the volatility regime?
Was the breakout a flop?
Did the market expand right after entry?
Did the deal work but need additional room?
Did you enter during a period of extreme repricing?
This is exactly where a Trade Journal Template becomes useful. The purpose is not to write a diary about how you felt after losing money. The purpose is to create enough structured information to discover when your edge changes character.
A Better Metric: Volatility-Conditioned Expectancy
Suppose your breakout strategy produces the following results over 200 trades.
Overall expectancy: +0.18R.
That looks useful.
But then you divide the results into two volatility regimes.
Normal volatility:
+0.31R.
Elevated volatility with strong skew:
-0.14R.
Now the headline statistic is hiding something important.
Your strategy may not have one expectancy.
It may have conditional expectancy.
This is one of the biggest opportunities for advanced traders.
Instead of asking:
“Does my strategy work?”
Ask:
“When does my strategy work?”
The volatility smile can become one variable in that question.
A Volatility Smile Decision Matrix
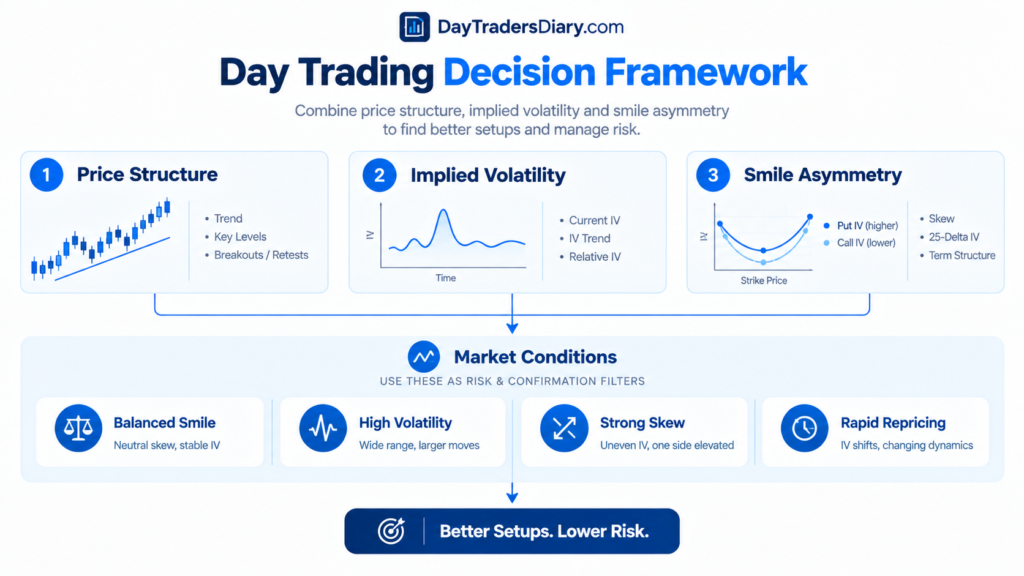
You can create a simple framework around three variables.
Price structure.
Implied volatility.
Smile asymmetry.
Consider four examples.
Price bullish, volatility normal, smile balanced.
Trade according to the normal setup.
Price bullish, volatility high, smile balanced.
Trade selectively and adjust size according to tested volatility conditions.
Price bullish, volatility high, downside skew extreme.
Demand stronger confirmation or reduce exposure.
Price bullish, volatility and skew rapidly repricing.
Treat the market as an event regime rather than an ordinary technical session.
Notice what this framework does not say.
It does not say “short when skew is negative.”
It does not say “buy when the smile flattens.”
It does not turn one derivative metric into an entry signal.
It forces you to integrate information.
That is much harder, but also much more useful.
The Psychology of Trading During Asymmetric Volatility
There is a psychological trap here that experienced traders recognize immediately.
When volatility expands, the opportunity feels bigger.
The trader sees larger candles and thinks:
“I can make my daily target quickly.”
That is exactly when position size can become disconnected from risk.
A trader who normally trades one lot suddenly trades two because the setup “looks strong.”
Then a normal retracement produces a much larger dollar loss.
The problem was not the market.
The problem was that volatility changed the trader’s perception of opportunity faster than it changed the trader’s risk rules.
The solution is to define size before the emotional part of the trade begins.
If your volatility regime requires smaller size, the decision should already be made before price reaches the entry.
What the Smile Can Tell You About Event Risk
Event risk is where volatility smile analysis becomes especially interesting.
Before major announcements, traders are not simply asking where price might go.
They are asking what kind of distribution of outcomes they should prepare for.
A central bank decision could produce:
A small move.
A large directional move.
A sharp move followed by reversal.
A temporary spike followed by mean reversion.
An unexpected gap in liquidity.
Options pricing attempts to incorporate the possibility of these outcomes.
The day trader cannot know which outcome will occur.
But they can recognize when the market is charging more for protection against extreme outcomes.
That can justify changing execution behavior.
For example, instead of entering immediately before the event, you may wait for the initial reaction and trade the second structure.
That is not because the smile predicted the direction.
It is because the smile changed your estimate of the environment.
Why a Steep Smile Does Not Mean “Crash Incoming”
Another common mistake is interpreting a steep volatility curve as proof that a major move is imminent.
It is not.
Options can become expensive because traders want insurance.
Insurance can become expensive precisely because people are worried, even if the feared event never happens.
Cboe research and educational material on skew makes a similar point in equity markets: option-implied volatility can differ substantially across strikes because the market places different values on tail protection.
That is pricing information.
It is not a guarantee of the future path.
This distinction is particularly important when a trader sees an extreme reading and becomes convinced that something dramatic must happen.
Sometimes the market pays a large premium for protection and nothing dramatic occurs.
Sometimes the protection turns out to be extremely valuable.
Your job is not to guess which one.
Your job is to structure your exposure so either outcome remains manageable.
How To Combine Smile Analysis With Price Action
A functional hierarchy does the trick.
Begin with the structure of greater timeframes.
Then identify the intraday level.
Then determine liquidity and momentum.
Then measure the volatility circumstances.
Then use smile information as a risk and confirmation filter.
Finally, execute according to a predefined trigger.
For example:
EUR/USD is bullish on H1.
Price is approaching a weekly resistance zone.
Implied volatility for a week is high.
Downside risk reversals are getting more negative.
It’s not the good conclusion “short”.
The right conclusion is:
The directional bias is to the upward, but the options market is pricing more downside asymmetry. “I want stronger confirmation before I drop money on a breakout.”
That is a professional decision.
A Second Example: USD/JPY
Suppose USD/JPY is trading beneath a major resistance level before a Bank of Japan event.
The options market shows rising short-dated implied volatility.
The smile becomes more asymmetric.
Price breaks resistance.
Instead of buying the first candle, you wait.
Price pulls back.
The old resistance becomes support.
The next candle rejects the level and closes higher.
There are now two different strands of evidence for the trade.
Price confirmed acceptance above resistance.
The volatility environment explains the instability that might be seen in the initial move.
You can build the trade on the confirmed level and not chase the 1st expansion.
That can materially improve execution quality.
What To Do When You Do Not Have Good Options Data
Many retail traders simply do not have reliable FX volatility surface data.
That is fine.
Do not pretend an unreliable volatility smile chart is precise information.
Related proxies are still available.
You can help yourself with a decent source of short-term implied volatility.
The VIX and equities volatility data could add greater risk context when trading USD pairs or indexes.
Economic calendar risk can identify periods when volatility repricing is likely.
Realized volatility can show whether current price movement is expanding or contracting.
ATR can help you compare current movement with recent conditions.
The key is not to manufacture precision.
A rough but reliable volatility regime classification is often more useful than a highly detailed smile chart based on questionable data.
Volatility Smile Effects on Stop Placement
One of the most misunderstood ideas is that high volatility automatically means wider stops.
Not necessarily.
Your stop should still be placed at the level that invalidates the trade thesis.
If that level is farther away because the market structure requires more room, then position size should decrease.
If the structure remains close but the market is extremely noisy, the correct decision may be to avoid the trade rather than artificially widening the stop.
This is an important distinction.
Volatility analysis should influence the relationship between size, stop distance, and trade frequency.
It should not give you permission to place random stops.
Volatility Smile and Reward-to-Risk
Volatility can also distort the way traders think about reward-to-risk.
A chart may show a clean 1:3 setup.
But if the first target sits inside a region where volatility is rapidly expanding, the probability of reaching that target may not match the visual simplicity of the chart.
Likewise, a setup that looks like 1:1.5 in normal conditions may have very different expectancy during a volatility expansion.
This is why reward-to-risk should be treated as a structural measurement, not a standalone edge.
The market’s distribution of movement matters.
Use Realized Volatility to Validate the Smile
An implied volatility reading becomes much more useful when compared with realized volatility.
Suppose one-week implied volatility is 10%.
If realized volatility has recently been 5%, the options market may be pricing a significant premium for future uncertainty.
That does not automatically mean implied volatility is overpriced.
The future can become much more volatile.
But the gap itself is worth monitoring.
Likewise, if realized volatility has exploded while implied volatility barely responds, the market may be underpricing the continuation of uncertainty.
For a day trader, the important question becomes:
Is the market’s current volatility pricing consistent with what price is actually doing?
That is a much better question than simply asking whether volatility is high.
The Trader’s Volatility Smile Checklist
Ask yourself before moving to an event sensitive set up:
What is the present implied vol regime?
Is the smile fairly symmetrical or asymmetrical?
Which wing is paying the premium?
Are risk reversals shifting?
Is butterfly volatility shifting?
Is the location verifying the same message?
Is realized volatility going up?
Is this a regular trading session or is this an event regime?
Does my historical strategy have a good expectancy in current environment?
Does my current position size make sense for the stop distance?
If you cannot answer those questions, there is nothing wrong with simplifying the trade.
Complex information should make your decisions clearer, not more complicated.
How To Turn Smile Data Into a Backtestable Rule
This is where most educational material stops too early.
Knowing what a volatility smile means is not an edge.
Testing how your strategy behaves under different smile conditions is where the edge can begin.
Suppose you trade breakouts.
Take your historical trades and divide them into:
Normal implied volatility.
Implied volatility is elevated.
Heavy downside skew.
Strong positive skew.
Slant changes fast.
Then compare
“Winning percentage.
Average R.
Maximum unfavorable excursion.
Maximum good engulfs.
Stop out Rate.
Ready to fire.
Average slippage.
Trade frequency.
Now you can ask a useful question:
“Does my breakout strategy deteriorate when the smile becomes unusually asymmetric?”
If so, you’ve got something to go on.
Maybe the answer is to go smaller.
Maybe it’s slow entrance.
Maybe it’s just waiting to re-test.
Maybe it’s avoiding some events.
Perhaps the effect diminishes after we control for realized volatility.
The smile itself is not the strategy.
It is a variable that may explain when your strategy behaves differently.
A Useful Rule for Advanced Traders
Here is a simple principle worth remembering:
Use price to decide direction.
Use structure to decide invalidation.
Use volatility to decide how much room the market may require.
Use implied volatility and the smile to understand how uncertainty is being priced.
Use your journal to determine whether those observations actually improve your expectancy.
That division of responsibilities prevents indicator overload.
Scaling Capital Without Scaling Bad Decisions
There is another reason volatility analysis matters when you start increasing account size.
A trader who scales capital often assumes the same strategy can simply be traded at a larger size.
The dollar numbers change, but the psychological pressure changes too.
A $100 loss may feel irrelevant on one account.
The same percentage loss at a larger account size can become psychologically significant.
That can cause earlier exits, hesitation, moving stops, or excessive monitoring.
Volatility smile analysis can help you recognize when the market itself is becoming more difficult while your account size is becoming larger.
You are not trying to get the biggest.
The goal is to increase awareness while maintaining the quality of delivery.
That distinction is more relevant when you are dealing funded or eval accounts.
Using Evaluation Accounts as a Capital-Scaling Tool
A trader can develop a genuine edge and still face a capital constraint.
That is one reason professional traders sometimes explore evaluation programs.
The logic is simple.
If your approach has positive anticipation, rigorous risk management and a documented execution procedure, then additional capital can potentially improve the dollar worth of the same edge without having you focus all of your own cash in one trading account.
It introduces another layer of constraints.
Daily drawdown limits, maximum loss rules, trading restrictions, payout rules, consistency requirements, and execution conditions can all change how your strategy needs to be operated.
The5ers is one example of this model. Its current High Stakes program uses a two-step evaluation structure, with stated maximum daily loss and maximum loss parameters, and the program provides a scaling path that can increase account allocation as performance targets are reached. Its current published High Stakes information states that scaling can extend up to $500,000, with the exact conditions depending on the account tier and program rules.
That makes the program relevant to the same principle discussed throughout this article: scale the process, not the emotional risk.
Other proprietary trading firms use different structures, so traders should compare the actual rules rather than choosing a program based solely on headline account size.
The5ers also publishes separate futures programs with their own drawdown, consistency, contract, and scaling rules. The important lesson is that the funding model should fit the trading process, not the other way around.
Your technique may not be a fit for a program with limits around particular news execution, if it’s only good if you can hold through every event and aggressively scale into volatility.
An assessment structure could be easier to implement if your approach relies on regulated intraday risk, pre-defined invalidation, and progressive scaling.
That is the correct way to think about funded trading.
Not “How fast can I get through?”
But instead:
Can I run my existing process within these rules without changing its risk behavior?
If the answer is yes, you can consider exploring a The5ers evaluation account as one possible route to scaling trading capital.
What Serious Traders Should Actually Track
A serious volatility-based trading journal should eventually answer more than whether a trade won.
You want to know whether the market regime affected the quality of your decision.
Track the implied volatility situation if applicable.
Note if the smile was balanced or asymmetrical.
Monitor risk reversal direction.
Track volatility.
Watch out for the trade if it is near planned news
Track entry delay.
Track stop distance.
Track maximum adverse excursion.
Track maximum favorable excursion.
Track the final R result.
Then review the data every 20 to 30 trades.
You may discover something unexpected.
Perhaps your best trades happen when volatility is elevated but the smile is balanced.
Perhaps your worst trades occur when volatility is low and suddenly explodes after entry.
Perhaps skew has almost no predictive value for your particular strategy.
That last result is perfectly acceptable.
The goal of research is not to prove that every market variable matters.
The goal is to discover which variables actually improve decisions.
Frequently Asked Questions
What is a volatility smile in forex?
In forex, a volatility smile is the phrase used to indicate different implied volatilities at different option strikes or deltas for the same expiry. Instead of a single implied volatility, there can be various strikes with various levels of volatility.
Is the volatility smile bullish or bearish?
Not by itself. A volatility smile describes how uncertainty is priced across strikes. The asymmetry of the smile can indicate that one side of the distribution is being priced differently, but it should not be treated as a guaranteed directional forecast.
What is a volatility smile forex example?
Assume EUR/USD at 1.1000, one-week options are showing 7% ATM implied volatility, 8% implied volatility for a corresponding downside put and 7.3% for an upside call. The discrepancy shows that downside protection is somewhat more expensive. A day trader could use that information as a risk or confirmation filter rather than a direct short signal.
What is a risk reversal in forex?
Risk reversal (RR) A risk reversal compares the implied volatility of out-of-the-money calls and puts with the same delta, often 25 delta. FX commonly uses this to represent relative pricing of upside and downside tail risk.
What does a negative FX risk reversal mean?
The general norm is that a negative risk reversal indicates the put has a larger implied volatility than the similar call, which is call implied volatility minus put implied volatility. This suggests a comparatively higher demand or pricing premium for downside protection, but not necessarily a future drop.
Can day traders use volatility smile data without trading options?
Yes, I am. Options information might provide market context to spot traders. Using implied volatility, risk reversals and grin changes, it is possible to identify volatility circumstances, event risk and asymmetry before using a standard price based trading strategy.
Should volatility smile information change position size?
It can, if your testing shows that certain volatility regimes change the behavior of your strategy. Higher volatility may require smaller size when structural stops become wider. The decision should come from predefined risk rules rather than intuition.
Is implied volatility the same as expected volatility?
No. Implied volatility is derived from option prices and reflects the market price of uncertainty under the option-pricing framework. It contains information about expected future volatility, risk premia, supply and demand, and other factors. It should not be interpreted as a perfect forecast.
What is more useful for day trading, volatility smile or price action?
They address distinct questions. Price action shows you what the market is actually doing at this moment. The volatility smile tells you how options are pricing uncertainty over various scenarios. For the majority of day traders, price should be the primary execution tool and smile information should provide extra context and risk filters.
The Real Edge Is Knowing When Your Strategy Changes Character
The biggest mistake is trying to turn the volatility smile into another entry indicator.
That misses the point.
The real value is recognizing that markets do not distribute risk evenly across every environment.
Sometimes the options market is calm.
Sometimes it is aggressively pricing movement.
Sometimes the market is paying a large premium for one tail.
Sometimes the smile changes before the spot market has made its biggest move.
Sometimes it changes because traders are hedging rather than because they have a reliable directional forecast.
Your job is not to guess which interpretation is correct from one snapshot.
Your job is to combine the information with price, structure, realized volatility, event risk, and your own trading statistics.
That is how a volatility smile becomes useful.
For the next 30 relevant trades, try one experiment.
Record the volatility regime and smile condition before every trade. Then compare your results when the smile is balanced versus strongly asymmetric.
Do not change your strategy during the experiment.
Just collect the evidence.
You may discover that volatility smile effects are a meaningful filter for your trading.
You may discover they matter only around major events.
Or you may discover that they add little to your particular edge.
All three outcomes are useful.
The next step is to study your entry timing and execution quality, particularly how volatility affects the distance between your planned entry and your actual fill. That is where the information from the options market can connect directly with the execution process.
Your edge is not knowing every market variable.
Your edge is knowing which variables deserve your attention, when they matter, and when they do not.