
The chart is ready, so you enter a breakout.
Price rises over resistance. The bullish candle closes. The momentum oscillator starts to rise. You acquire in anticipation of continuation.
Instead, price stalls.
Then it slips back into the range.
Your stop gets hit.
Ten minutes later, another breakout appears. You take it again. The same thing happens.
After a few trades, it is tempting to blame the entry, the indicator, or the market maker.
Often, the real problem is simpler.
You were trying to trade a market that had not developed enough momentum to sustain directional movement.
This is one of the most expensive mistakes a day trader can make because low-momentum ranges look deceptively clean. Support is obvious. Resistance is obvious. The candles are orderly. The breakout level looks important.
But a clean structure does not automatically mean a tradable structure.
After reviewing enough intraday charts, one lesson becomes hard to ignore: the best breakout opportunities usually arrive after the market has demonstrated an increase in participation, range expansion, or directional pressure. The breakout itself is often the final confirmation, not the first clue.
What Research Tells Us About Momentum and Market Conditions
There is a more general reason this matters.
Time-series momentum was documented across equity indexes, currencies, commodities and bond futures by Moskowitz, Ooi, and Pedersen. Their investigation demonstrated the instrument’s historical returns were durable across numerous markets and over multiple time horizons.
That does not mean a five-minute momentum oscillator predicts the next candle. It means something more useful for a day trader: directional persistence is a measurable market behavior, and it is different from simply seeing a price move a few points beyond a level.
The distinction is critical.
A market can break resistance without developing persistence.
That is a failed breakout.
The Bank for International Settlements also treats liquidity as more than simply the presence of buyers and sellers. Market depth, bid-ask spreads, trading activity, price impact, and immediacy all matter when assessing how efficiently prices can move.
For a day trader, the practical lesson is straightforward.
A narrow range with weak participation is not merely boring. It can be structurally hostile to breakout trading because there may not be sufficient directional pressure to push the price out of the range.
Research on FX markets provides another useful perspective. A BIS study found that higher FX volatility was associated with greater trading activity in the market studied, except at extremely high levels of volatility.
This does not mean “more volatility is always better.”
It means opportunity and participation often change together.
Your job is to recognize when the market has shifted from compression to expansion.
You can read the comprehensive research from Moskowitz, Ooi, and Pedersen’s Time Series Momentum study, as well as the BIS research on FX volatility and liquidity.
The First Mistake: Confusing Movement With Momentum
This is where many indicator-based strategies go wrong.
Suppose EUR/USD has been trading inside a 15-pip range for 90 minutes.
Price breaks the upper boundary by four pips.
The breakout candle is bullish.
Stochastic crosses upward.
MACD histogram turns positive.
A trader sees four confirmations.
I see one question:
Has the market actually changed state?
A four-pip extension from a 15-pip range does not prove that.
Separating price movement and momentum persistence is one of the most important habits you can form.
Movement asks: “
Price action?
The momentum goes:
“Is the market still trending in one direction?”
That distinction alters your reading of leading momentum indicators.
An oscillator rising from 35 to 50 inside a compressed range may simply be reacting to a short-term candle. It does not automatically tell you that a sustained directional auction has begun.
This is why I prefer to read momentum in context rather than treat an oscillator as a green-light signal.
A Better Framework for Identifying Low-Momentum Ranges
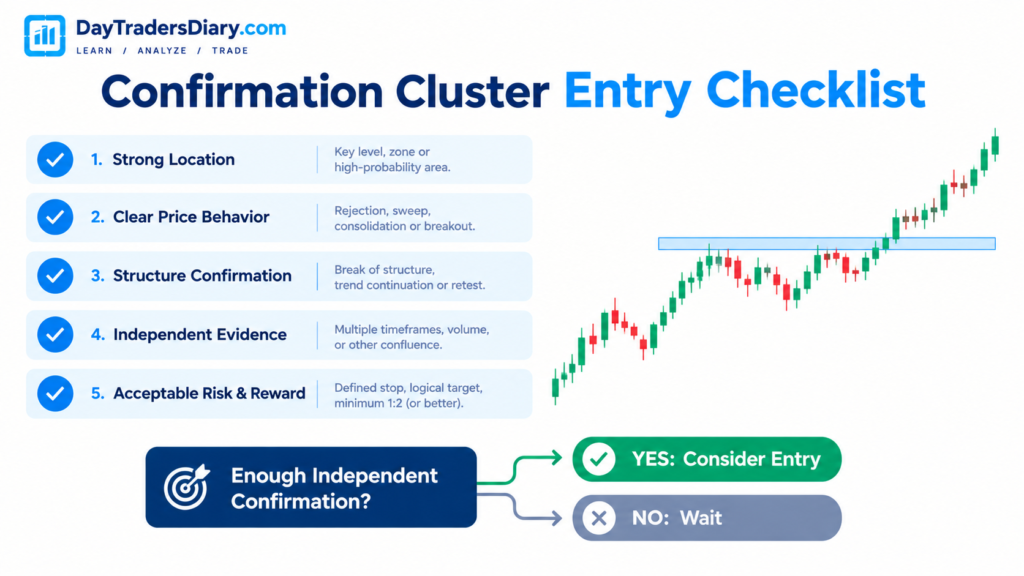
Before taking a breakout, I want three things to agree on: structure, volatility, and participation.
Structure tells me where the market is trapped.
Volatility tells me whether the price has enough movement to travel.
Participation tells me whether the move is being accepted.
Imagine NASDAQ has spent 45 minutes between 18,950 and 19,000.
ATR is declining.
Candles are getting smaller.
Volume is below its recent average.
Momentum oscillators repeatedly cross the midpoint without producing meaningful follow-through.
That is a low-momentum environment.
The obvious mistake is to keep buying every break above 19,000.
The better decision is to wait for evidence that the market is leaving compression.
That evidence might appear as expanding candle ranges, increasing relative volume, stronger closes near the candle extreme, rising ATR, or a momentum oscillator accelerating rather than merely crossing a level.
The important word is change.
A static indicator reading is less informative than its transition.
For example, an ADX reading you 18 indicates the market lacks strong directional movement.
ADX rising from 16 toward 25, while the price breaks structure tells a different story.
That is why the DayTradersDiary framework for classifying trend strength using ADX clusters focuses on the evolution of momentum rather than treating a single indicator value as a signal.
The Momentum Expansion Test
Here is a simple routine worth testing.
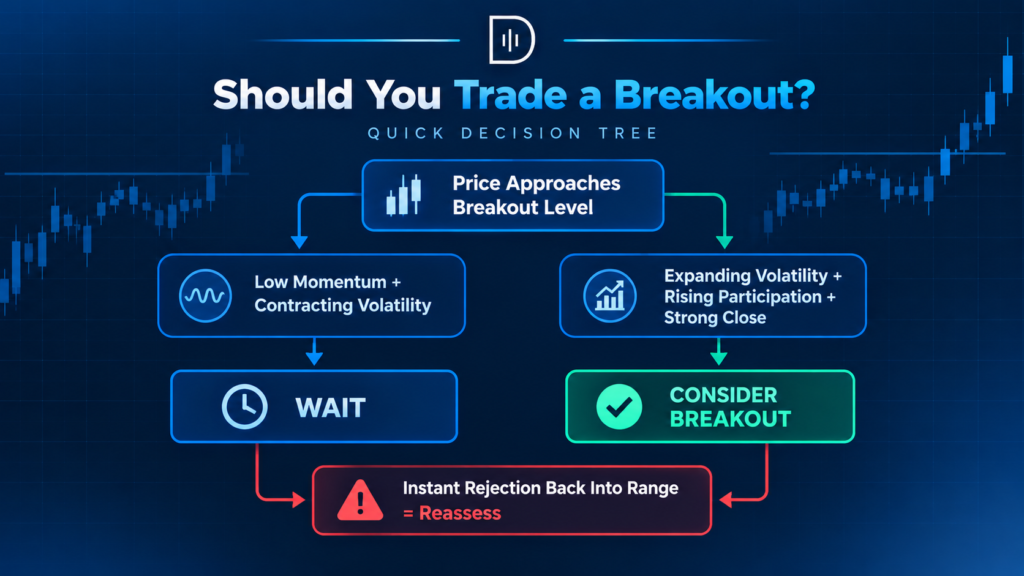
When the price approaches a major intraday breakout level, do not ask whether you should enter.
Ask whether the market is becoming more capable of producing the move you want.
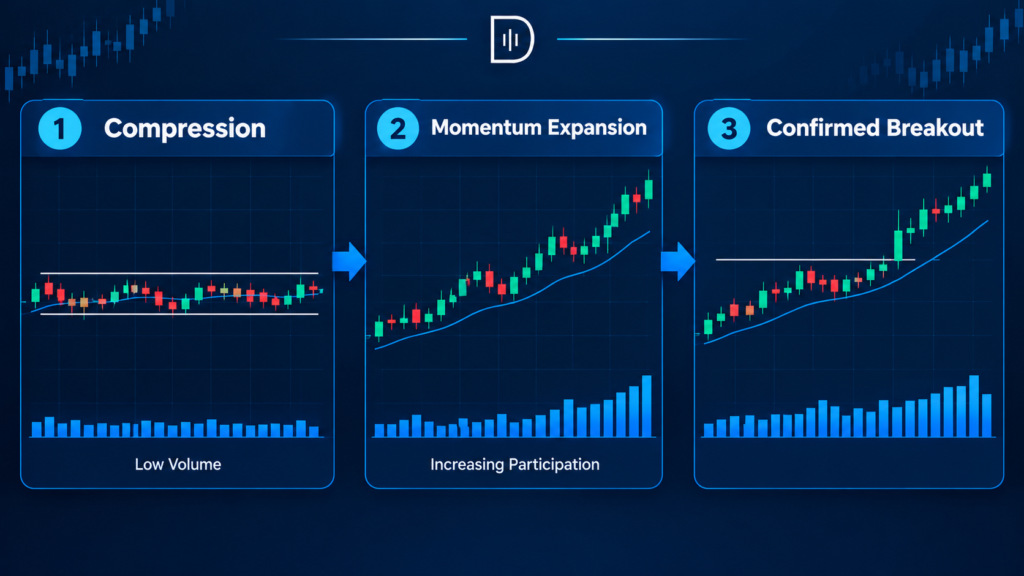
If the range is compressing, candles are strongly overlapping, momentum is flat, and volume is dropping, the answer is usually no.
The answer gets more fascinating if the range broadens, candles close closer to their extremes, momentum accelerates, and participation improves.
This is a situationally practical setup:
Let it compress and have low momentum.
Good. Then get ready for momentum compression.
Think implementation. Break out with extended range and participation.
Breakout with instant rejection back into range: evaluate, don’t chase.
That last condition matters enormously.
A failed breakout is information.
It tells you that the price temporarily exceeded the range but failed to achieve acceptance outside it.
Our guide on how to identify range breakouts only after volatility expansion goes deeper into this transition from compression to expansion.
When Low Momentum Does Not Mean “Do Nothing”
There is an important nuance here.
Avoiding low-momentum ranges does not mean avoiding every range.
Range trading and breakout trading require different expectations.
A trader using mean reversion may actually prefer a low-volatility range because repeated movement between established boundaries creates opportunities.
The mistake is using a breakout strategy in a market that behaves like a mean-reverting market.
That is a strategy-regime mismatch.
If price repeatedly rejects the same extremes and momentum fails to persist, the market may be telling you that continuation is not currently being rewarded.
In that environment, your best trade may be no breakout trade at all.
This is also where a Stochastic Oscillator approach can be interpreted more intelligently. The oscillator should help you understand the market’s state and timing rather than dictate direction on its own.
Risk Management: The Hidden Cost of Trading Dead Markets
Low-momentum conditions create another problem that traders underestimate.
They encourage overtrading.
You take a breakout.
It fails.
You wait.
Another breakthrough.
You got it.
It doesn’t work.
Each loss is little, and the damage seems trivial.
But after six tries, the trading day can be profoundly unfavourable.
This is the time when execution discipline beats all other indicators.
Your risk should be determined before the trade, not adjusted because the setup “looks better.”
A wider stop in a volatile market does not automatically mean greater account risk. Position size can be reduced to keep the planned risk stable.
This is where most traders miscalculate risk. A Position Size Calculator removes much of the guesswork by translating your account risk and logical stop distance into an appropriate position size.
The calculator should not decide where your stop belongs.
Your market thesis decides that.
The calculator prevents the position from becoming larger than the thesis can justify.
Journal the Market State, Not Just the Trade Result
If you want to know whether avoiding low-momentum ranges is actually improving your performance, your journal needs more than entry, stop, target, and result.
Record the market condition at entry.
Was ATR expanding or contracting?
Was volume increasing relative to the recent session?
Was the breakout candle larger than the preceding candles?
Where did the candle close within its range?
Was momentum accelerating or simply crossing a midpoint?
Did price remain outside the range after entry?
Most importantly, record whether you should have traded the setup at all.
This creates a powerful category in your journal:
“Good setup, bad market condition.”
And that category can expose an unsettling truth.
It’s possible that your method isn’t losing because the entrance is bad.
It could be losing because you are in the improper volatility regime with it.
You can download the Trade Journal Template and customize it to track these situations and your usual trade statistics. DayTradersDiary says it’s also useful to note the setup, the market environment, the quality of execution, and your emotional state when analyzing performance.
After 50 or 100 trades, compare the expectancy between expanding and contracting environments.
That number is far more useful than arguing online about whether RSI, MACD, Stochastic, or ADX is the “best” momentum oscillator indicator.
Scaling the Edge Beyond Your Own Capital
There is another issue that eventually appears.
Suppose you finally develop a repeatable edge.
Your entries are consistent.
Your risk is controlled.
You have enough data to prove that your strategy performs better when momentum expands.
Now, capital becomes the limitation.
This is where evaluation programs can make sense, provided you approach them as a professional test of your process rather than a shortcut to money.
The5ers, FTMO, and other firms use evaluation structures with defined objectives and risk limits. The exact rules differ, so traders should compare drawdown rules, profit targets, trading restrictions, payout conditions, and scaling policies rather than choosing based on account size alone.
For example, The5ers currently offers evaluation programs, including its High Stakes model, which uses a two-step evaluation process and allows traders unlimited time to complete it, subject to the program’s rules. FTMO similarly offers one-step and two-step evaluation structures with defined trading objectives and maximum-loss parameters.
The logic is simple.
If your personal account limits the size at which your proven edge can be deployed, an evaluation account can provide another route to scaling while forcing you to operate within predefined risk constraints.
But there is a catch.
If you cannot avoid low-momentum trades with your own money, a larger evaluation account will not solve the problem.
It will simply give the mistake a bigger stage.
If your process is already stable, consider reviewing The5ers evaluation program and comparing its current rules with alternatives such as FTMO. Treat the evaluation as a test of your trading process, not as a shortcut around developing one.
FAQs
What is a low-momentum range in day trading?
An intraday market is one where the price bounces around within some bounds during the day without a sustained directional move. It generally has overlapping candles, declining volatility, weak follow through and momentum that keeps resetting.
How can I identify a low-momentum market before trading?
Look for several conditions occurring together rather than relying on one indicator. Contracting ATR, narrow candle ranges, weak relative volume, repeated rejection at the same boundaries and flat momentum are useful warning signs.
Are momentum oscillators useful in ranging markets?
Yes, but the function changes. Boundaries can be identified by oscillators in ranges for short-term placement. Traders who treat overbought and oversold readings as automatic reversal indications are less dependable.
Is ADX useful for avoiding low-momentum ranges?
ADX can be used to quantify directional strength, especially if you examine its slope and regime changes instead of just a single static value. During structural expansion, an ADX rise can provide more useful information than just looking at ADX above or below a set value.
Should I avoid all breakouts after a low-volatility period?
No. Low volatility might set up the compression that precedes a major move. The trick is to wait for the signs that volatility and participation are expanding, rather than believing the first price breach is the breakout.
Why do traders keep losing money inside ranges?
Usually, because they apply continuation logic to a market that is behaving rotationally, repeated failed breakouts can also trigger revenge trading, increasing the number of attempts while reducing selectivity.
Final Thoughts
The biggest improvement may not come from finding another leading momentum indicator.
It may come from being selective about when your existing strategy is appropriate to use.
A breakout is not automatically valuable because the price crossed a level.
A momentum oscillator is not automatically useful because it has changed direction.
And a clean range is not automatically a good setup.
The market has to provide the conditions your strategy needs.
For the next 20 trading sessions, try one experiment: before every breakout trade, classify the market as compressing, transitioning, or expanding.
Then measure the results.
You may discover that your best trades are not simply the ones with the strongest-looking breakout candles. They are the trades where momentum, volatility, structure, and participation all changed state before you entered.
That is the difference between trading every opportunity and trading the opportunities your edge was actually designed for.
For your next read, explore how to identify range breakouts only after volatility expansion. It builds directly on this framework and takes the idea from market diagnosis into breakout execution.