
You notice a stock breaking out of resistance. The candle appears strong, buyers are jumping in and for a moment it feels as if the move you have been waiting for. You go into the transaction thinking that the price would continue increasing. Instead it stalls, falls back below resistance and triggers your stop-loss.
A few minutes later, you watch the same stock move in the opposite direction.
If you have traded breakouts for a while, you have probably experienced this more than once. The frustrating part is that your analysis may not have been completely wrong. You entered before the market showed whether it could actually hold above the level.
And that’s where being able to know how to spot false breakout pushes can come in handy. You start paying attention to what the price does after the breakout instead of reacting to every strong candle. That minor tweak can help you avoid pursuing moves that are not likely to continue.
What Does a Fake Breakout Actually Look Like?
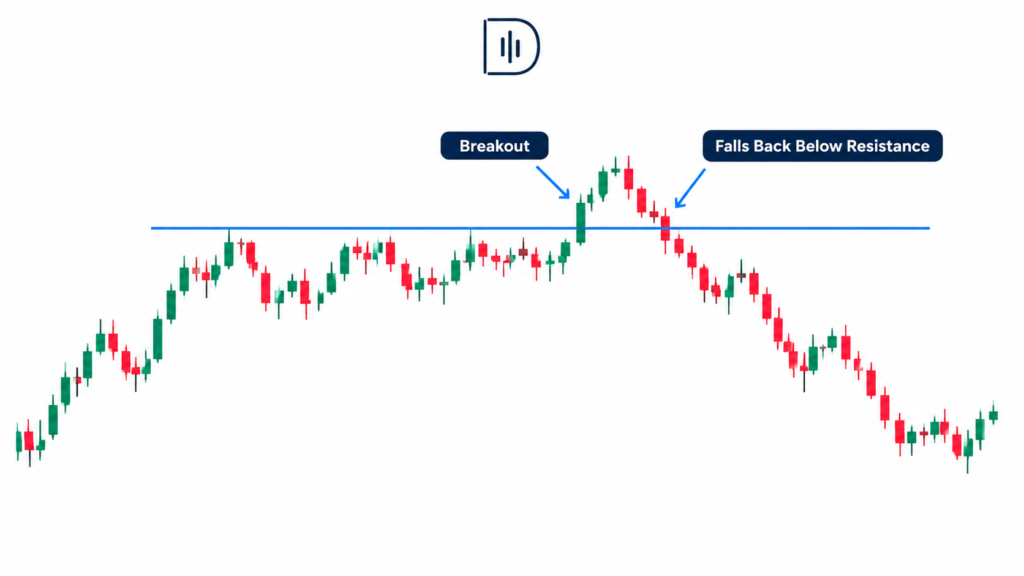
A fake breakout happens when the price moves beyond an important level but fails to stay there. It may break above resistance, push below support, or move beyond the previous session’s high or low before reversing.
Imagine a stock that has been trading between $48 and $50 for most of the morning. Suddenly, buyers push it above $50 and the price hits $50.35. Traders looking for a breakout begin to buy, hoping for another move higher.
But the buying does not continue. Price falls back below $50, attempts to recover, and fails again. The stock eventually drops toward $49.50.
The important clue was not simply that the price crossed $50. It was that the market could not maintain its position above that level.
Of course, not every breakout that pulls back is fake. Strong breakouts often retest the level before continuing. The challenge is learning to distinguish a healthy retest from a failed attempt to move into a new price area.
Three Signs That a Breakout May Be Failing
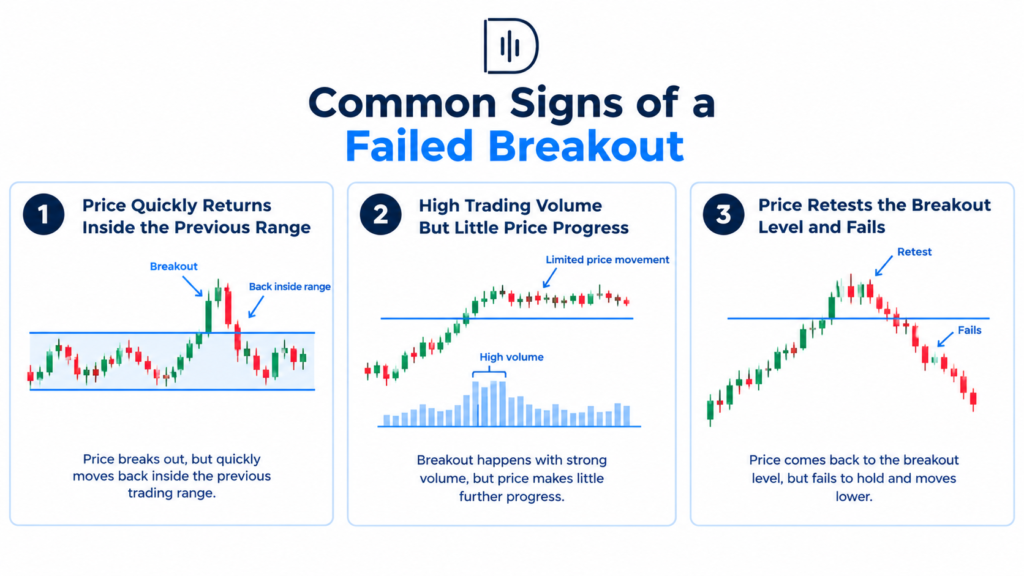
1. Price Breaks Out but Quickly Returns
One of the first things I would watch is how long the price manages to stay beyond the breakout level.
A quick move above resistance, followed by a close back inside the range, deserves attention. It suggests that buyers have not yet established control at higher prices.
For example, suppose the S&P 500 breaks above its morning range. The first candle closes above resistance, but the next candle wipes out most of the move. Price then struggles to recover the breakout level.
That is a reason to become cautious, not an automatic signal to sell.
Give the market room to show its hand. A single rejection can be misleading, particularly during a strong trend.
2. Volume Increases, but Price Goes Nowhere
Volume is useful, but it is easy to read too much into it.
Many traders assume that a breakout accompanied by high volume must continue. In reality, high volume tells you that a lot of trading took place. It does not tell you that buyers will remain in control.
Watch how far the price moves relative to the activity taking place.
If volume rises sharply but price barely advances, buyers may be meeting strong selling pressure. The same logic applies to a downside breakout that attracts heavy selling but makes little additional progress.
This can be especially helpful if a breakout looks promising at first but then stalls quickly.
3. The Retest Fails
A failed retest is often a more useful clue than the initial breakout itself.
Suppose EUR/USD breaks above an intraday resistance level. Price pulls back, holds briefly above the level, and then tries to move higher again. This second attempt stalls, and the price falls back below the resistance.
Now you have more information than you had when the breakout first occurred. The market had an opportunity to continue higher, but failed to do so.
Some traders look for a break of a nearby short-term swing low before considering a short entry. Others wait for a candle to close below the reclaimed level. The exact trigger should match your strategy, but the principle is the same: wait for evidence instead of guessing the reversal.
What Research Tells Us About Failed Breakouts
Price can blow through a level and reverse violently for a cause. Liquidity, order flow, trading activity, and the reactions of market participants to changing prices all influence short-term price action.
The Bank for International Settlements’ research on electronic trading in fixed-income markets examines how electronic trading affects liquidity and market functioning. Although the results are specific to fixed income markets, they can provide a valuable backdrop for understanding the reasons for fast changes in liquidity circumstances and execution.
The BIS has also examined feedback effects in markets under stress in its research on positive feedback trading. When traders react to price movements by placing additional orders in the same direction, the move can temporarily reinforce itself. However, that momentum does not guarantee that the market will continue in the same direction.
This helps a day trader comprehend why a breakout can appear excellent for a couple of minutes and then fail. Momentum traders may come into the market, stops may get hit, and short-term orders may push the price through a familiar level. The move will backfire if you don’t follow through.
The U.S. Securities and Exchange Commission’s day trading guidance also highlights practical issues such as execution costs, rapid price changes, and the risks involved in short-term trading.
The lesson is not to distrust every breakout. It is to stop treating the initial move as proof that the trade will work.
A Simple Framework for Detecting Fake Breakout Pushes
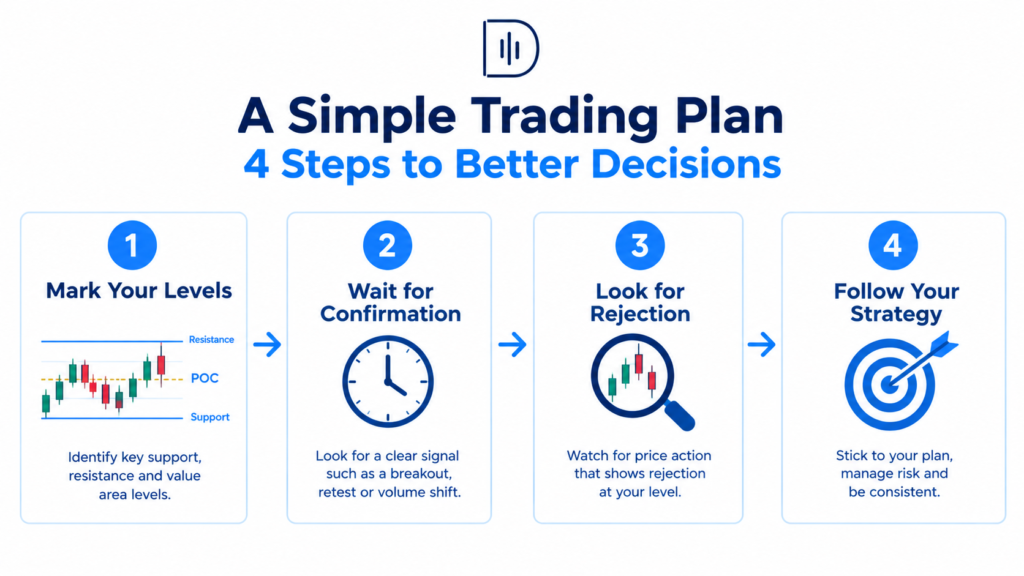
Step 1: Mark Your Levels Before Trading
Before the session, record the previous day’s high, low, opening range, and key intraday support and resistance levels.
These areas give you a reference point when the price starts moving quickly.
Avoid drawing new levels to justify a trade you already want to take. If the level was important before the breakout, you have a clearer reason to watch how the price reacts to it.
Step 2: Resist the Urge to Chase
Give a price time when it breaks a level.
Is the candle closing over the level? Or does the next candle stay there? Is the price moving with sensible follow through or has it traveled an exceptionally big distance already?
There is no need to answer every question perfectly. You are simply trying to avoid entering when the only evidence is a sudden burst of movement.
Sometimes the best decision is to let the breakout go. Missing a trade is usually easier to manage than entering impulsively and spending the next several minutes hoping the market turns in your favour.
Step 3: Look for Rejection
Expect the price to retrace into the range and find it difficult to get back out.
Repeated failure to remain above resistance for an upside breakthrough could indicate the market is rejecting higher prices. A swift bounce over the support level may suggest that sellers were unable to stay in control after a breakdown.
It all depends on context. A fake breakout near the middle of a tight range may not give much opportunity, but a fake breakout above the previoday’sy’s high might give a cleaner setup if the market also breaks short-term structure.
Step 4: Wait for Confirmation That Fits Your Strategy
You do not need to catch the exact turning point.
For a potential short trade, you might wait for the price to fall back below resistance, fail to reclaim it, and then break a nearby swing low. For a potential long trade after a downside false breakout, you might look for the price to recover support and form a higher low.
These are examples, not universal rules. Test your preferred entry trigger on the market and timeframe you trade.
The goal is to make decisions based on observable price behaviour rather than a feeling that the breakout looks suspicious.
Risk Management: Know When Your Idea Is Wrong
Even a good trade can go bad. The price might pull back to the breakout level. The market could reverse again. Or you might get an entry that’s not as good as you had hoped due to slippage.
That is why you should decide your invalidation point before entering.
Suppose your trading account holds $10,000 and you want to risk 0.5% on a trade. Your planned risk is $50. If your stop-loss distance requires a position size that exposes you to $80 of risk, the trade does not fit your plan.
Use the Position Size Calculator to work out an appropriate position size based on your account risk and stop distance. Remember to account for fees and the possibility of slippage.
Do not place a stop so close that ordinary market noise is likely to trigger it, and do not widen your stop simply because you want to avoid taking a loss.
If the setup requires more risk than you are comfortable accepting, wait for another opportunity.
How to Improve Your Results Through Journaling
One losing breakout trade tells you very little about whether your strategy works. A series of properly recorded trades can tell you much more.
After each potential false breakout, record where the level was, when the breakout occurred, whether the price returned inside the range, and what confirmation you used before entering.
Also record your entry price, stop-loss, result in R, and whether you followed your plan. Note the market conditions too. A failed breakout during a quiet session may behave differently from one that occurs around an economic announcement.
Over time, look for patterns. Perhaps your entries work better after a failed retest than immediately after price returns inside the range. Perhaps you lose money when you trade against a strong trend or enter during the first few minutes of the session.
Those findings are more valuable than repeatedly changing indicators after a few losses.
The Trade Journal Template can help you organize these observations and review your performance consistently. Collect a meaningful sample before deciding that a particular entry rule needs changing.
Can You Scale This Strategy With a Prop Firm?
Once you have evidence that your strategy works and you can follow your risk rules consistently, you may start thinking about trading more capital.
Evaluation programs offered by firms such as The5ers, FTMO, and TradeThePool provide different routes for eligible traders to pursue funded trading opportunities. Their markets and program structures differ, so compare the current rules carefully. The5ers and FTMO are associated with forex and CFD trading programs, while TradeThePool focuses on stock trading.
The crucial thing is that a funded account won’t remedy bad execution.
If you chase breakouts, add to your position after losses, or ignore your stop because you are sure a reversal is imminent, tight assessment standards can uncover those patterns rapidly.
Before paying for an evaluation, make sure you have tested your strategy, understand your average drawdown, and can trade within the firm’s daily and overall loss limits.
Consider a program such as The5ers if its current instruments, evaluation conditions, and risk rules fit your approach. Compare it with other providers rather than choosing based on the advertised account size alone.
Capital access can expand your opportunities, but only if your trading process is already disciplined enough to handle the additional constraints.
FAQs About Detecting Fake Breakout Pushes
What is the clearest sign of a fake breakout?
A quick return inside the previous range, followed by a failed attempt to reclaim the breakout level, is a useful warning sign. It becomes more convincing when the price also breaks the short-term market structure.
Can high volume indicate a fake breakout?
Yes. A failed breakout can be accompanied by heavy activity that delivers little additional price progress. Volume, by itself, won’t tell you if a breakout will be successful or not.
Which timeframe is best for identifying false breakouts?
On a higher timeframe, look for key levels and overall market context. Use your trading timeframe to judge the breakout and retest. It’s all about the correct mix based on your plan and holding duration.
Should I enter as soon as the price returns inside the range?
I don’t think so. You get a return in this range it is a warning sign, but not a guaranteed confirmation. Waiting for a failed retest or a break of short-term structure could offer a clearer entry, but it may mean entering later.
Do false breakout strategies work in forex and stocks?
Both can be used. But the times of sessions, liquidity, spreads, volatility, and execution are different. Instead of trusting that the same setup works everywhere, test your rules separately for each instrument.
How can I avoid getting trapped in breakouts?
Mark your levels ahead of time. Avoid chasing lengthy candles. Watch if the price gives up the level before entering. Define your invalidation point before entering. Review your transactions to see which confirmation signals genuinely boost your profits.
Final Thoughts
Detecting fake breakout pushes is less about predicting reversals and more about being patient enough to recognize when a move is failing.
The next time price breaks a level you have been watching, resist the temptation to jump in immediately. Pay attention to the follow-through, watch the retest, and wait for the price to give you a reason to act.
For your next read, explore How to Quantify News Volatility Before Entry. Knowing when volatility shifts might help you identify the difference between a regular failed breakout and a move occurring in exceptional market conditions.