
You find a tight range on your chart. Candles are getting smaller, the Bollinger Bands are narrowing, and the price keeps testing the same resistance level. It looks like a breakout is close, so you buy as soon as the price pushes above the range.
For a few seconds, the trade looks promising. Then price falls back inside the range, your stop gets hit, and the market goes nowhere.
The problem is familiar to anyone who trades breakouts. You spotted the squeeze correctly, but that did not mean the trade was ready.
A squeeze tells you that price movement has slowed. It does not tell you when the market will break out, which direction it will choose, or whether the move will last long enough to make the trade worthwhile.
The real skill is learning to separate an attractive chart from a good trading opportunity. That starts with grading the squeeze before you enter.
What a Squeeze Actually Tells You
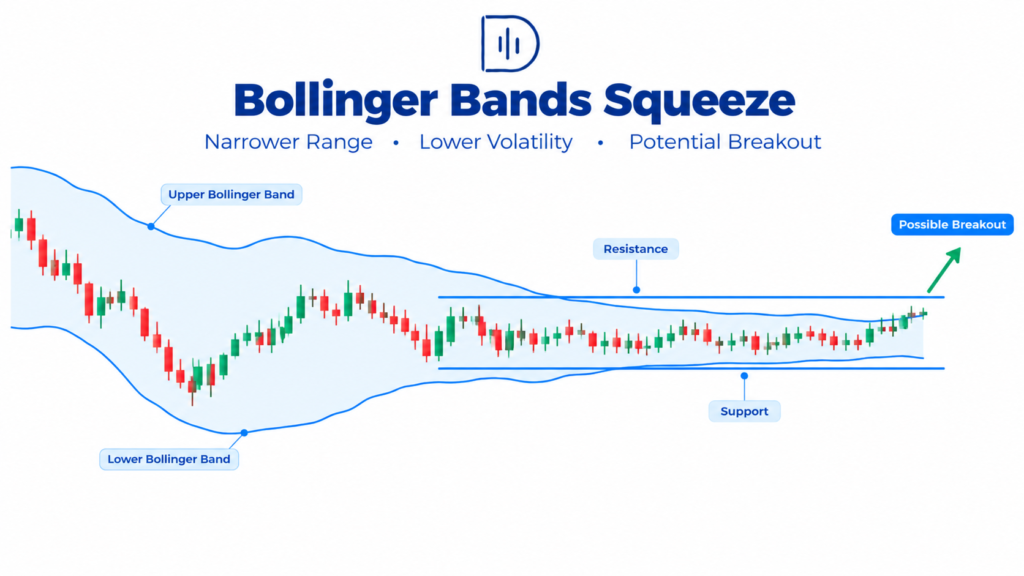
A squeeze forms when price movement becomes relatively quiet. Candles may shrink, the trading range may tighten, and Bollinger Bands may move closer together.
Because volatility might increase following a period of contraction, traders keep an eye on these situations. However, there is no assurance that the expansion will result in a clear direction. The price may move briefly outside the range before reversing, break above resistance, or fall below support.
The official Bollinger Bands website explains how the indicator adapts to changing volatility. Because of this, it can be used to pinpoint times when price movement has become remarkably quiet in comparison to recent circumstances.
Still, the bands cannot tell you whether the next move will be profitable.
Imagine two charts. Both show narrow Bollinger Bands and small candles. First, price is pressing against a resistance level that has rejected several previous attempts to break higher. On the second, the price is drifting sideways within a broad range.
The squeeze looks similar, but the trading opportunities are different. The first chart gives you a clear level to watch. The second offers little reason to expect the price to travel in one direction.
The quality of a squeeze depends on more than how tight the candles look. Where it forms and what price it commands around it matter just as much.
What Market Research Can Tell You
Financial markets move through periods of different volatility. Research on volatility clustering in equity markets examines how periods of market activity can cluster rather than appear at random.
For day traders, this helps explain why a quiet market can suddenly become active. However, it does not mean every period of low volatility will lead to a profitable breakout.
The CME Group’s technical analysis education covers concepts such as trends, support, resistance, and price patterns. These are useful when assessing whether a breakout has a meaningful reason to continue.
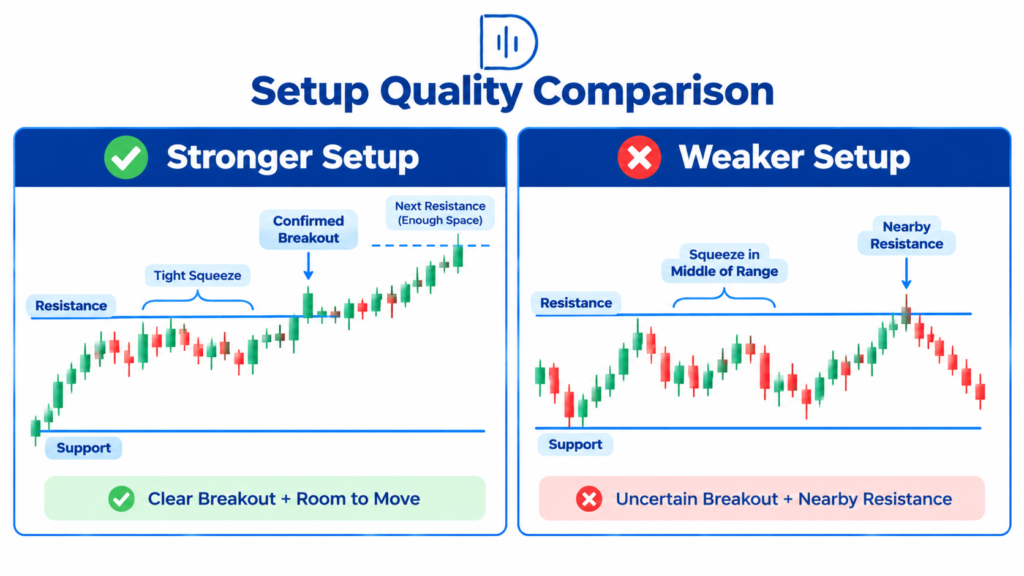
Imagine a squeeze developing slightly below the peak of a prior session. The market has surged past a level traders have been keeping an eye on if the price breaks above that high and stays there. Compare that to a breakout in the middle of a range, when there is minimal space for price to go before it encounters resistance once more.
Both moves qualify as breakouts. They do not offer the same opportunity.
Research and indicators can help you understand market behavior, but neither can supply a reliable win probability for your personal strategy without testing. For that, you need consistent entry rules and a record of actual results.
Five Questions to Ask Before Trading a Squeeze
1. Is the market genuinely quiet?
Start by comparing the current price movement with recent activity.
Are candles smaller than they were earlier in the session? Has the range tightened? Have the Bollinger Bands narrowed compared with their recent width? Is ATR falling relative to its recent readings?
You do not need to use every indicator. One or two reliable measures, combined with what you see on the chart, are often enough.
Be careful with fixed thresholds. A quiet period in gold will not look the same as one in EUR/USD or the Nasdaq. Compare current conditions with the instrument’s own recent behavior.
Also, do not assume that a squeeze becomes more attractive simply because it lasts longer. Price can sit in a narrow range for hours and still produce a disappointing breakout.
2. Where is the range forming?
Location is one of the first things I would check before considering an entry.
Suppose a stock has tested resistance three times. Each pullback is relatively shallow, and the price keeps returning to the same level. Buyers are not yet through with resistance, but sellers have also struggled to push the price away from it.
If the price begins compressing beneath that level, a breakout is worth watching.
Now imagine price forms the same tight pattern halfway between major support and resistance. There is no clear level being challenged, and the nearest opposing level may be close.
The second setup may look just as neat, but it gives you less information about where the price could go next.
Mark the range high and low. Then look beyond those boundaries. If a breakout runs straight into another important level, the potential trade may not offer enough room.
3. Does the broader trend support the idea?
A squeeze can break against the prevailing trend, but knowing the broader direction helps you understand the trade you are considering.
For example, the one-hour chart is making higher highs and higher lows. On the five-minute chart, price consolidates just below an intraday high.
An upside break would fit the existing bullish structure. You have a reasonable continuation scenario to work with.
But suppose the same squeeze forms directly beneath a major daily resistance level. Even if buyers break through, the price may struggle to continue once it reaches that area.
Do not treat the trend as a command to buy or sell. Use it to put the setup into context. A trend-aligned breakout and a countertrend breakout are different trades, and you should not judge them by the same rules unless your testing supports that approach.
4. Has price actually broken out?
This is where impatience becomes expensive.
Price trades a few ticks above resistance, and you assume the breakout has started. You enter immediately, only to watch the candle close back inside the range.
A brief move beyond a level is not always enough.
Some traders enter as soon as the price crosses the boundary. Others wait for a candle to close beyond it or for a retest of the broken level. Each approach has advantages and drawbacks.
You might receive a better price if you enter early, but you might be involved in more unsuccessful breakouts. You may avoid some poor trades by waiting for confirmation, but you may miss a quick move or in too late.
Choose a rule that suits your strategy and test it. Changing your entry method every time the previous trade loses makes it difficult to know whether the method actually works.
5. Is there enough room to make the trade worthwhile?
A breakout can look convincing and still be a poor trade.
Suppose a stock breaks above a range at $50.20. Your planned stop is $0.30 below entry, but a major resistance level sits at $50.60.
There is only $0.40 between your entry and that resistance. After accounting for the stop distance, trading costs, and slippage, the opportunity may not justify the risk.
Now consider a different configuration where the next big resistance level is located considerably further away. The trade might provide a better balance between risk and possible gain even if the breakout appears less dramatic.
Determine where the price could plausibly stall before you enter. Just because the squeeze has ended does not mean it will go across the chart.
How to Grade a Squeeze Breakout
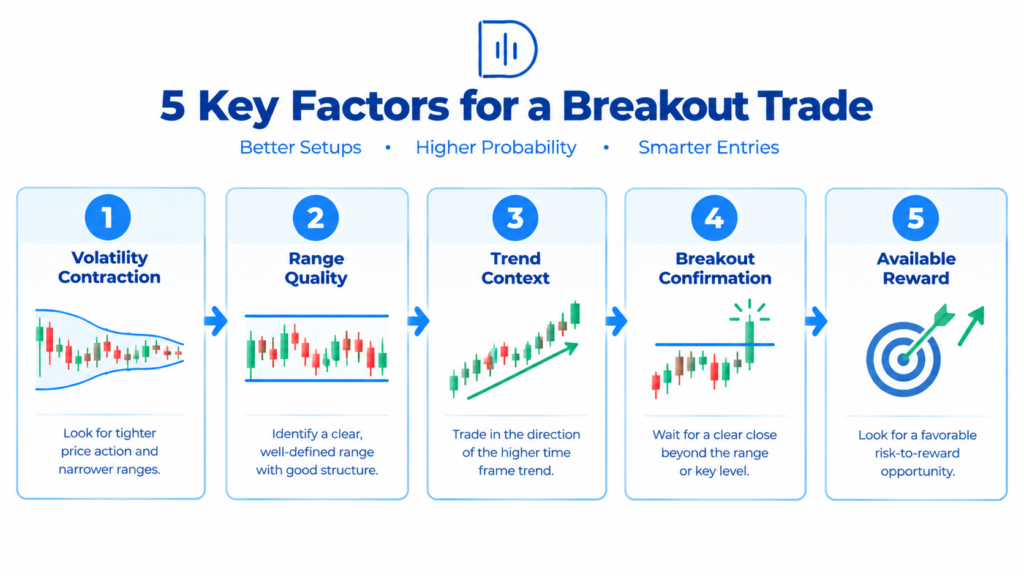
To make better decisions, you don’t need any fancy formula. Start by grading these 5 things: Volatility contraction, Range quality, Trend context, Breakout confirmation, Reward availability.
Give each factor a rating of strong, mixed, or weak.
A strong setup might have clear compression, a well-defined range, a supportive market structure, a confirmed break, and enough room before the next level of resistance. A weak setup might have a tight range but a poor location, a conflicting market structure, and little room for the price to move.
Use the ratings to compare opportunities, not to manufacture certainty.
For example, a setup that scores well on all five factors should not automatically be labeled an 80% probability trade. That number means nothing unless your own results support it.
After recording enough trades, you can compare the performance of strong, mixed, and weak setups. You may find that location matters more than the length of the squeeze, or that waiting for a candle close improves your results but reduces your average profit per trade.
That is the point of grading. It gives you a consistent way to judge setups and a practical way to find out which conditions deserve the most attention.
You can build this process into a day trading strategy backtest. Keep the rules fixed during each test so you can compare results fairly.
Risk Management: Know Where You Are Wrong
Even attractive squeezes can go wrong. It is your responsibility to control the transaction so that your account is not needlessly harmed by a single unsuccessful breakout.
Before you come to the configuration, determine what will break the configuration. Depending on your strategy, it may mean re-entering on the other side of the border or moving back inside the range. Don’t place your stop at a level that’s easier for you to work with for position sizing; place it at the level that the structure you’ve analyzed dictates.
Next, calculate your position size based on the stop distance and the amount you are willing to risk. The DayTradersDiary Position Size Calculator can help you work this out before placing the trade.
Do not widen your stop just because the breakout looks promising. A high-quality setup can still fail, and taking more risks does not make it more likely to succeed.
Keep an eye out for significant market openings and economic announcements. Slippage and abrupt price swings may occur during these times. Instead of presuming that the same rules will get the same results, record them individually if you have not tried your method under those circumstances.
Use Your Journal to Find Better Setups
Note how the squeeze appeared prior to the breakout when a deal closes. Note the instrument, session, duration, range limits, volatility conditions, direction of the trend, entry trigger, stop distance, and outcome.
Also, note what happened after the breakout. Did the price continue moving? Did it return inside the range? Did it reach the first target and then reverse?
The Trade Journal Template available through DayTradersDiary.com can help you keep those observations organized.
Once you have a reasonable sample of trades, compare the results. Check your win rate, average winner, average loser, and expectancy for each setup grade. Include costs and slippage where possible.
You might discover that squeezes near previous session highs perform better than those in the middle of a range. Or perhaps your entries work well when you wait for a close but suffer when you chase the breakout after a large candle.
Those findings are more useful than adding another indicator because a recent trade went wrong.
Scaling Up With a Proven Process
Once you have evidence that your breakout strategy works and you can follow it consistently, you may start thinking about trading with more capital.
Evaluations of proprietary trading are one option. Evaluation-based systems are available from The5ers and FTMO, and stock traders might also want to look into TradeThePool. Compare the current terms before making a decision because their markets and account rules are different.
Check The5ers’ current fees, drawdown limitations, evaluation standards, and payoff conditions if you’re thinking about using it.
A weak process cannot be fixed with more money. An evaluation account may make it more difficult to control behaviors like chasing breakouts, ignoring your stop, or raising risk following a loss.
First, do you have a hot streak going? If your strategy is working well and the rules of the program are compatible with your approach, you might want to consider pursuing access to extra trading funds.
FAQs
What is the squeeze breakout probability?
It’s a judgment of how good a breakout appears for volatility and range structure and trend context and confirmation and reward available. You need the backtested results of a clearly defined approach to have a meaningful numerical likelihood.
Which indicator is best for identifying a squeeze?
Bollinger Band width and ATR are both indications of low volatility. Neither forecasts the direction of a breakthrough alone. Combine the price structure and volatility data with a good trading strategy.
Does a longer squeeze produce a stronger breakout?
Not always. Big moves can be preceded by a long consolidation or failed breakout or just go sideways. Duration is not the important factor, all things considered, but rather range location and reason in the market.
Should I enter as soon as the price breaks resistance?
It is contingent upon your back-tested entry rules. A quick entry can yield a higher price and expose more false breaks. Waiting will allow you to confirm with a candle close or retest, but will delay your entry.
How do I know whether my grading system works?
Backtest results with a focus on the ‘conditions’ for each trade, including averages and other summary statistics like your Setup Grades. Look at Expectancy and Average Win, Average Loss, and Win Rate. For the real performance of the trade execution, add in your trading fee and slippage.
Final Thoughts
The mistake with squeeze breakouts is failing to recognize that a move may be coming. It is assuming that any move out of a tight range is worth trading.
Before your next 20 squeeze setups, take a moment to grade the volatility, location, trend context, confirmation, and available reward. Write down your assessment before entering, then record what actually happens.
Pay particular attention to the breakouts you skip and the ones that fail. Over time, those examples can show you which conditions genuinely improve your decisions.
You do not need to catch every breakout. You need a repeatable way to recognize the ones that offer a reasonable opportunity and leave the rest alone.
Next read: How to Find High-Probability Setups.