
A trade can look perfect on the chart and still be a bad trade because the market simply is not moving enough.
This is one of the most frustrating problems in day trading. You identify a clean breakout, the structure is aligned, your entry is technically valid, and the stop is placed where it should be. Then nothing happens. Price moves three pips, retraces two, moves four, retraces three, and eventually your trade either gets stopped out by noise or sits dead while the opportunity disappears.
The natural reaction is to blame the entry.
Often, the real problem is volatility.
Many traders use ATR, Bollinger Bands, or visual candle size to gauge market activity. Those tools are useful, but there is another approach that is surprisingly practical for intraday trading: build a volatility filter directly around pips.
A pip-based volatility filter asks a simple question before you enter:
Is the market currently moving enough, relative to my strategy, for this trade to have room to work?
That question sounds basic. In practice, it can eliminate a large amount of low-quality trading.
The key is not to create a magic pip number, such as “only trade when EUR/USD moves 30 pips.”
That approach breaks down immediately because 30 pips can represent completely different market conditions depending on the session, currency pair, news environment, timeframe, and recent volatility.
The useful approach is to make the pip measurement relative to what the market normally does.
This article builds that framework from the ground up and shows how to turn raw price movement into a practical trading filter.
What Is A Pip-Based Volatility Filter?
A pip-based volatility filter is a rule that measures recent price movement in pips and uses that information to decide whether market conditions are suitable for a particular trading strategy.
It does not predict direction.
It does not tell you whether to buy or sell.
It answers a different question:
Is there enough movement for my setup to produce its expected outcome?
Imagine you trade a five-minute breakout strategy on EUR/USD.
Your typical winning breakout needs about 15-25 pips of follow-through.
If the pair has moved only 8 pips over the last hour, expecting a clean 25-pip continuation may be unrealistic.
Now imagine the same setup appears after EUR/USD has already moved 35 pips during an active session.
The opportunity is different.
The second market may have enough movement to support your strategy.
The first may not.
This is where a pip-based volatility filter becomes useful.
Why Fixed Pip Rules Usually Fail
One of the first mistakes traders make is setting a fixed threshold.
As an example:
“I need EUR/USD to move 20 pips or more before I will trade.
Sounds quite matter of fact.
Not very adaptable.
A 20 pip move during the Asian session can signify a significant change.
The same 20-pip movement during an active London-New York overlap can represent an unusually quiet market.
The number itself has no context.
The same problem appears when traders use a fixed stop.
A 10-pip stop may be reasonable during a very quiet scalping environment and completely inadequate during a fast-moving news session.
Volatility changes the meaning of distance.
This is why a useful pip-based volatility filter should compare current pip movement with a relevant historical baseline.
The Basic Pip Volatility Calculation
Start with something simple.
Measure the range of each completed candle in pips.
For a five-minute EUR/USD candle:
High = 1.0862
Low = 1.0847
Range = 15 pips
You can calculate this for the previous 10, 20, or 30 candles.
Suppose the last 20 five-minute candles produced an average range of 8 pips.
The current candle has a range of 15 pips.
The current range is therefore:
15 ÷ 8 = 1.875
The current candle is approximately 1.88 times the recent average range.
That tells you much more than simply saying, “This candle is 15 pips.”
The market has expanded relative to its recent baseline.
That is the foundation of a useful pip-based volatility filter.
Average Pip Range Versus Current Pip Range
You can build the filter with two numbers.
The first is your baseline average pip range.
The second is the current or recent pip range.
For example:
Recent average five-minute range = 7 pips
Current five-minute range = 11 pips
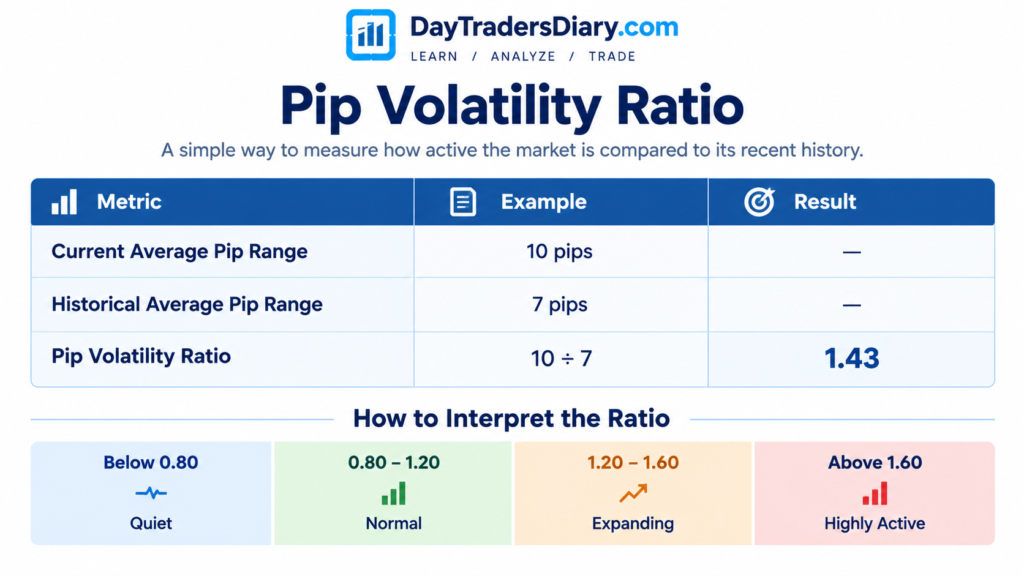
Volatility ratio = 11 ÷ 7 = 1.57
You could define your trading conditions like this:
Below 0.80 means unusually quiet.
Between 0.80 and 1.20 means normal.
Between 1.20 and 1.60 means expanding.
Above 1.60 means highly active.
These thresholds are examples, not universal rules.
The important part is that your strategy should determine the thresholds through historical testing.
A breakout strategy might benefit from expansion above 1.30.
A mean-reversion strategy could actually prefer the opposite environment.
The filter should serve the strategy, not become the strategy.
The Most Important Question: How Much Movement Does Your Setup Need?
This is where many volatility indicators become disconnected from actual trading.
A trader sees ATR rising and assumes conditions are improving.
But improving for what?
A volatility increase is not automatically positive.
Suppose your setup requires a 20-pip move to reach its target.
If the recent average movement is only 8 pips, your target may be ambitious.
If the average movement is 25 pips, the target becomes much more compatible with current conditions.
The filter should therefore begin with your strategy’s requirements.
Ask yourself:
How many pips does this setup normally need to reach the first target?
How many pips does the price typically move before the setup is invalidated?
How long does the trade normally remain open?
How much of the daily range has already been consumed?
Those questions turn volatility from an indicator into a decision-making tool.
A Simple Volatility Budget
Think of the market as having a daily movement budget.
Suppose EUR/USD has already traveled 80 pips from the daily low to the daily high.
Your historical data show that the pair frequently produces 90 to 110 pips under comparable conditions.
There may still be room for continuation, but the situation is different from entering after only 20 pips of movement.
Now consider the opposite situation.
The pair has moved just 25 pips, while your historical intraday range is around 90 pips.
The market may still have considerable room to move.
This does not mean price must travel another 65 pips.
Markets do not owe traders their average range.
It simply gives you context.
A pip-based volatility filter should therefore measure both recent movement and movement that has already been consumed.
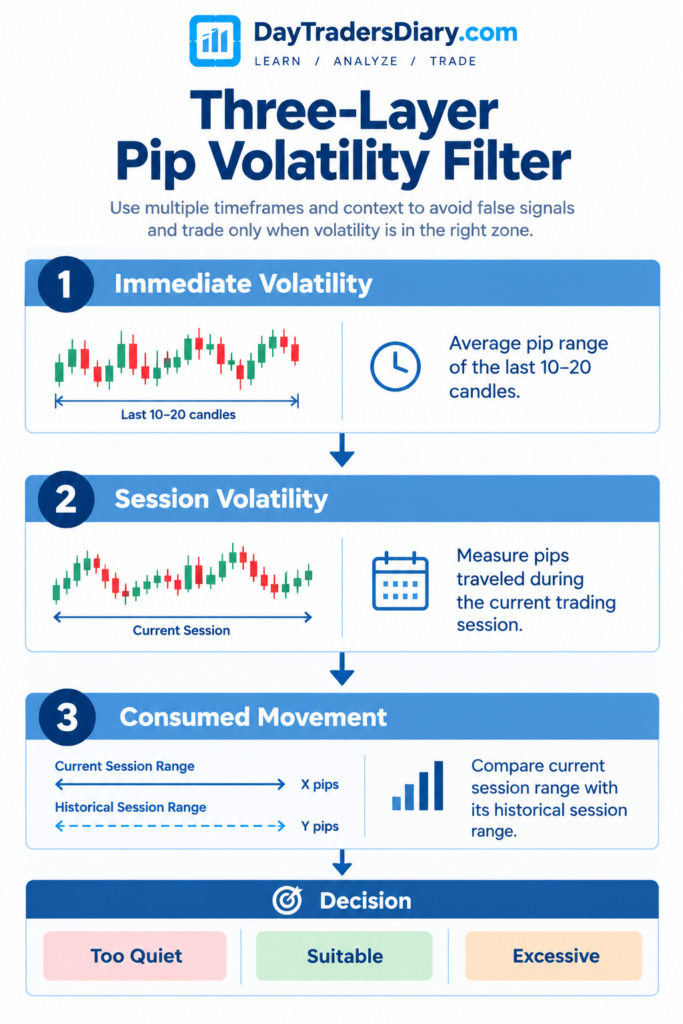
A Three-Layer Pip Volatility Filter
A practical filter can be built around three layers.
The first layer measures immediate volatility.
The second measures session volatility.
The third measures the amount of movement already consumed.
For immediate volatility, calculate the average pip range of the last 10 to 20 candles on your execution timeframe.
For session volatility, measure how many pips the pair has traveled since the relevant session began.
For consumed movement, compare the current session range with the historical range for that session.
Now you have context.
A five-minute candle may be expanding while the overall session has already traveled unusually far.
That is a very different environment from a five-minute candle expanding at the beginning of a quiet session.
Research Supports The Idea Of Volatility Regimes
This is not merely a charting trick.
Financial-market research has repeatedly shown that volatility is not constant.
Intraday FX volatility studies have observed volatility clustering and volatility switching across market periods. Research published in Oxford Academic evaluated whether volatility operates independently within a single market period or spills over across market segments, finding evidence of intraday volatility transmission.
For a day trader, the practical lesson is important.
You should not assume that yesterday’s volatility environment is automatically today’s volatility environment.
The market moves through regimes.
Quiet periods can persist.
Then information arrives, liquidity changes, and the size of price movements expands.
A volatility filter is essentially an attempt to identify which regime you are currently trading in.
What BIS Research Tells A Day Trader
The Bank for International Settlements has also examined the relationship between FX volatility and trading activity.
Its research on FX markets found that volatility and trading volume can move together under normal conditions, but the relationship can change during periods of extreme volatility.
Another BIS study found that FX volatility can increase trading activity, although extremely high volatility can produce different effects across market participants.
This distinction matters.
The objective of a volatility filter is not to find the highest possible volatility.
You are looking for usable volatility.
There is a major difference.
A market moving 50 pips because of an orderly breakout may be tradable for your strategy.
A market moving 50 pips through chaotic price gaps and rapidly changing liquidity may not be.
More volatility does not automatically mean better trading conditions.
ATR Is Useful, But Pip Measurements Add Context
Average True Range is one of the most widely used volatility measures.
Fidelity describes ATR as an average of true ranges over a selected number of periods and notes that it can be used to adapt stops and entry decisions to changing volatility. It also explains that shorter ATR periods can be used to focus more heavily on recent volatility.
ATR is useful.
But there is an important distinction between ATR and a simple pip-based filter.
ATR gives you a smoothed measure of volatility.
A pip filter gives you a language that is directly connected to your trade.
If your setup needs 18 pips to reach its first target, you can immediately compare 18 pips against the current movement.
That makes the information easier to integrate into an execution plan.
You do not necessarily need to choose between ATR and pip measurements.
Use ATR as the volatility context and pips as the execution language.
Build A Pip Volatility Ratio
One of the simplest useful formulas is:
Pip Volatility Ratio = Current Average Pip Range ÷ Historical Average Pip Range
Suppose the current 20-candle average range is 10 pips.
Your historical average for the same period is 7 pips.
Your ratio is:
10 ÷ 7 = 1.43
The market is currently producing approximately 43% more movement than its historical baseline.
Now imagine your breakout strategy performs best when this ratio is above 1.20.
The filter is telling you that the environment qualifies.
That does not mean you take the trade.
It means volatility is no longer the reason to reject it.
That distinction is important.
Do Not Use The Filter As An Entry Signal
This is one of the biggest mistakes I would avoid.
A volatility filter should generally be a permission layer, not a directional trigger.
If EUR/USD volatility increases, that does not mean you should buy EUR/USD.
It only tells you that the market may have enough movement for your setup to function.
Your directional framework still needs to come from price action, structure, momentum, order flow, macro context, or whatever your tested strategy actually uses.
Think of the filter as a gate.
Your setup tells you where you wish to trade.
Your volatility filter helps you determine if the atmosphere is right.
They both have to agree.
Example: Breakout Strategy
Imagine you trade a London-session breakout.
Your historical data shows that the strategy performs best when the five-minute average range is at least 1.25 times its normal baseline.
Today, the first hour produces very small candles.
Your current 20-candle average is 5 pips.
Your historical baseline is 8 pips.
Your volatility ratio is:
5 ÷ 8 = 0.625
The market is moving at barely 62.5% of its usual rate.
Price breaks resistance
Nice chart. But your volatility filter is showing a damped medium.
This is where many traders enter because the setup “looks good.”
The filter gives you a reason to wait.
Later, the average range increases to 10 pips.
The ratio becomes:
10 ÷ 8 = 1.25
Now the market has entered a volatility regime in which your breakout strategy has historically performed better.
The breakout itself may now deserve consideration.
The filter did not predict the breakout.
It helped you decide whether the environment was suitable for your breakout model.
Example: Mean Reversion Strategy
Now reverse the logic.
Suppose your strategy is a short-term mean-reversion setup.
Your historical data shows that it performs best when five-minute average ranges remain below 0.90 of normal.
Suddenly, a major news event causes the average range to jump to 1.80.
The mean-reversion setup appears.
Price reaches an extreme.
The temptation is to fade it.
But your volatility filter says conditions are completely outside the environment in which your strategy has historically worked.
That may be enough to stay out.
This is one of the most valuable applications of volatility filters.
They can stop you from applying a strategy outside its natural habitat.
Build The Filter Around Time Of Day
Volatility changes throughout the trading day.
A pip threshold that makes sense during the Asian session may be meaningless during the London-New York overlap.
Instead of calculating one average for the entire day, create time-specific baselines.
For example, you could calculate the average five-minute range for EUR/USD during the first hour of London over the previous 30 comparable sessions.
Then, calculate a separate baseline for the first hour of New York.
This produces a much cleaner comparison.
Suppose the London baseline is 7 pips and the New York baseline is 10 pips.
A current five-minute range of 8 pips would be above normal for London but below normal for New York.
The same eight pips have different information depending on the session.
This is one of the biggest improvements you can make to a pip-based volatility filter.
Build Pair-Specific Filters
Do not assume every currency pair should use the same pip threshold.
EUR/USD, GBP/JPY, USD/JPY, and GBP/USD have different volatility characteristics.
A 15-pip move does not carry the same meaning across every pair.
Your filter should therefore be pair-specific whenever possible.
If you trade five pairs, you may eventually have five separate baselines.
That sounds more complicated.
It is actually simpler than trying to force all pairs into one universal threshold.
Use Percentile-Based Thresholds
There is another method that can make your filter more robust.
Instead of saying:
“Trade when average range exceeds 8 pips.”
Use historical percentiles.
Suppose you collect the average five-minute range from the last 500 comparable trading periods.
You discover that today’s current range sits at the 70th percentile.
That means the current movement is greater than approximately 70% of the observations in your sample.
You could create rules such as:
Below the 25th percentile = suppressed volatility.
25th to 60th = normal.
60th to 80th = favorable expansion.
Above 80th = extreme.
Again, these are not universal thresholds.
The value comes from letting the data define what “quiet” and “active” mean in your particular market.
Why Percentiles Can Beat Fixed Pip Numbers
Imagine you trade GBP/JPY.
During one period, its normal five-minute range may be 12 pips.
During another market regime, it may average 20 pips.
A fixed 15-pip threshold would produce completely different information during those periods.
Percentiles adapt automatically.
You are asking:
“How unusual is today’s movement compared with the historical distribution?”
That is a more robust question than:
“Did price move more than 15 pips?”
The Hidden Problem: Volatility Can Expand Too Much
This is where traders often misuse volatility filters.
They assume:
Higher volatility = better opportunity.
That is not necessarily true.
Suppose your normal five-minute range is 7 pips.
The current candle suddenly prints 30 pips.
Your volatility ratio is above 4.
That looks extremely active.
But what caused it?
If it were an orderly trend continuation, your strategy may benefit.
If it were a major economic release with a violent spike and immediate reversal, your normal setup may be completely invalid.
Extreme volatility can increase execution risk, spread variability, slippage, and stop-outs.
So your filter should have both a minimum threshold and, for some strategies, a maximum threshold.
The objective is not maximum movement.
It is an appropriate movement regime.
The Volatility Sweet Spot
For many day-trading strategies, the best environment sits somewhere between dead and chaotic.
Imagine a simple scale.
Very low volatility may mean there isn’t enough movement to reach your target.
Moderate volatility gives the price enough room to travel while preserving structure.
High volatility can create opportunity but also increases execution uncertainty.
Extreme volatility can completely change the market’s behavior.
Your job is to discover where your strategy’s expectancy is strongest.
That range is your volatility sweet spot.
Build A Volatility Corridor
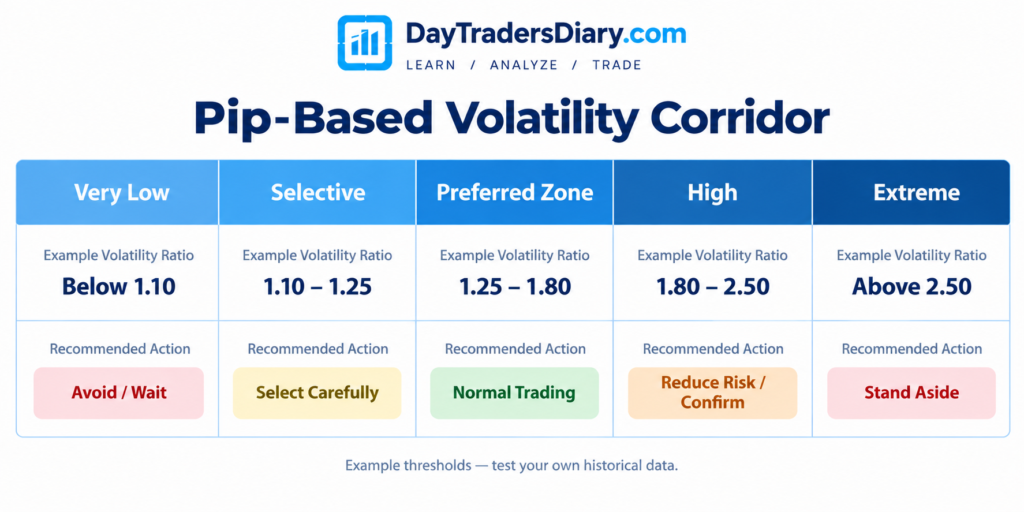
Instead of creating only a minimum threshold, consider creating a corridor.
For example:
Minimum acceptable ratio = 1.10
Preferred zone = 1.25 to 1.80
Maximum acceptable ratio = 2.50
Now the filter becomes more sophisticated.
Below 1.10, you may decide that the market lacks sufficient movement.
You can selectively trade between 1.10 and 1.25.
Rates between 1.25 and 1.80 might be the best fit for your plan.
You can shrink or need more confirmation between 1.80 and 2.50.
Above 2.50, you may stand aside.
Those numbers are only an example.
Your historical testing should determine the actual corridor.
Connect Volatility To Your Stop
This is where the filter becomes directly connected to risk.
Suppose your strategy normally uses a 12-pip structural stop.
But current volatility has increased dramatically.
Your structure now requires an 18-pip stop.
If you maintain the same position size, your dollar risk increases by 50%.
That is unacceptable if your risk plan is fixed.
You have two choices.
You can reduce the position size to keep the monetary risk constant, or you can reject the trade if the required stop is no longer consistent with your strategy.
This is why volatility filters should never be separated from position sizing.
The market does not care about your preferred stop distance.
Your stop needs to make sense relative to market structure.
This Is Where Traders Miscalculate Risk
Imagine you normally risk $100 with a 20-pip stop.
You calculate your position size once and use the same size throughout the session.
Later, volatility expands, and your structural stop becomes 35 pips.
You enter with the original position size.
You may now be risking substantially more than $100.
The mistake is easy to make because the trader thinks in terms of lots rather than risk.
A position size calculator removes much of that guesswork by converting account risk, stop distance, and instrument characteristics into an appropriate position size.
The DayTradersDiary.com Position Size Calculator is particularly useful in this process because the correct position size should adjust as the stop distance changes.
The broader lesson is more important than the tool.
Volatility should influence your stop, and your stop should influence your position size.
Pip Volatility And Reward-To-Risk
Volatility also affects whether your target is realistic.
Suppose your setup requires a 30-pip target.
The recent average five-minute movement is only 4 pips.
That does not mean the market cannot move 30 pips.
It means you should question whether your expected time-to-target and probability of reaching it are consistent with your historical data.
Now imagine the same setup during an active session where the average five-minute range is 11 pips.
The target is still not guaranteed, but the market’s recent movement makes the required displacement less extraordinary.
Your volatility filter, therefore, becomes part of your reward-to-risk analysis.
A 3R target is not automatically attractive if the market rarely moves far enough to reach it within your trading horizon.
The “Pips Per Minute” Version
For very short-term traders, a simple alternative is to measure the average number of pips traveled per minute.
Suppose EUR/USD moves 12 pips over 10 minutes.
That is approximately 1.2 pips per minute.
Now compare that with your historical average of 0.7 pips per minute.
Current movement is significantly faster.
This can be particularly useful for scalpers and one-minute or three-minute strategies.
But there is a weakness.
Price can travel 12 pips in one direction and then retrace 12 pips.
Your raw movement measurement may indicate high volatility even though directional opportunity is poor.
That is why a pips-per-minute filter should not replace structure or trend analysis.
It should support it.
Net Movement Versus Gross Movement
This distinction is extremely useful.
Gross movement measures how much the price has traveled.
Net movement measures how far the price ended from where it started.
Imagine EUR/USD moves:
+8 pips
-7 pips
+9 pips
-8 pips
The market traveled 32 pips in gross terms.
But the net displacement may be only 2 pips.
That is a very different trading environment.
For breakout strategies, net movement may be more informative.
For mean-reversion strategies, high gross movement combined with low net movement could actually be interesting.
This is why a sophisticated volatility filter should eventually measure more than candle size.
Add A Directional Efficiency Check
One useful extension is:
Directional Efficiency = Net Price Movement ÷ Gross Price Movement
Suppose the price moves a total of 40 pips during your measurement period, but finishes 20 pips from the starting point.
Your Efficiency is:
20 ÷ 40 = 0.50
Now imagine another period with 40 pips of gross movement but only 5 pips of net movement.
Efficiency is:
5 ÷ 40 = 0.125
Both periods had the same gross volatility.
But the first was much more directional.
That distinction can be extremely valuable for breakout traders.
Combine Pip Volatility With Market Structure
Never allow the volatility filter to override structure.
Suppose your filter says current volatility is ideal.
But the price is directly below a major resistance level.
A high-volatility environment does not make resistance disappear.
Likewise, low volatility does not automatically invalidate a setup.
You need to understand what the filter is actually doing.
It measures the environment around the strategy.
It is not replacing the strategy’s core logic.
A Practical Four-Step Decision Process
Before entering, first measure current pip movement against the historical baseline.
Then determine whether the current volatility falls inside your strategy’s acceptable corridor.
Next, check whether the structural stop and target still make sense in that volatility environment.
Finally, calculate the position size based on the actual stop distance and fixed monetary risk.
This process takes little time once automated or practiced.
More importantly, it prevents you from entering simply because the chart appears active.
The Filter Should Be Different For Breakouts And Pullbacks
Breakout tactics usually involve growth.
If pricing is stuck in a narrow range, a breakout can fail due to a lack of participation or follow-through.
A pullback strategy can perform differently.
You may actually want the initial impulse to create enough volatility and then want volatility to contract during the retracement.
This contraction can lead to a cleaner entry.
So the filter might be:
The impulse is very volatile.
Moderate/declining volatility on the retreat.
The trigger expanded again.
That’s a lot more advanced than saying, “ATR needs to be high.
The Best Filter May Be A Sequence, Not A Number
This is one of the less obvious insights.
Markets often move through sequences:
compression → expansion → continuation → exhaustion → compression.
A single volatility reading tells you where the market is now.
A sequence tells you what the market has been doing.
For example, a breakout strategy may perform best when volatility is compressed for several candles and then begins expanding.
The absolute volatility may still be only moderate.
But the change in volatility is the important information.
That suggests another metric:
Volatility Expansion Ratio = Current Pip Range ÷ Recent Pip Range
If recent candles averaged 5 pips and the latest candle prints 9 pips, the ratio is 1.8.
That expansion may be more meaningful than simply observing that the latest candle is 9 pips.
Build A Volatility Expansion Trigger
Suppose your five-minute strategy requires:
Recent 20-candle average = baseline.
The current candle range must be at least 1.4 times the baseline.
The session range can’t exceed your tiredness threshold.
Structure must be at least 1.5R.
The environment is qualified if all three conditions are satisfied.
Notice what this does.
It does not tell you to enter.
It simply prevents you from taking trades when the market’s movement profile is incompatible with your strategy.
That is a much healthier role for a filter.
Do Not Optimize The Threshold Until It Looks Perfect
There is a psychological trap in building filters.
You test 100 trades.
A threshold of 1.17 gives good results.
You test 1.18.
Results improve.
Then 1.19.
Better again.
Eventually, you find a threshold that looks fantastic.
That is where overfitting begins.
You have optimized the filter for historical noise.
Instead, use broad zones.
For example:
Below 1.0
1.0 to 1.25
1.25 to 1.5
Above 1.5
Then test whether performance differs significantly across regimes.
A good friendship should not vanish when your threshold has moved a little.
Use Out-of-Sample Testing
Once you identify a promising volatility relationship, test it on data that was not used to create the rule.
This is one of the most important steps in strategy development.
Suppose you discover that trades perform better when volatility exceeds 1.25 times its baseline.
Do not implement it yet.
Try another time.
If the partnership is long-lasting, confidence increases.
If it is lost, the original result may have been noise.
You have to prove your way into the trading plan.
Journal The Filter Separately
Your trading notebook shouldn’t only be a record of whether you followed the filter.
Note the true state of volatility.
For each trade, record the current average pip range, historical baseline, volatility ratio, session range, setup type, stop distance, target distance, and outcome.
Then compare performance by volatility regime.
This turns your journal into a research database.
The DayTradersDiary.com Trade Journal Template can serve as the foundation for that process, particularly because the site provides downloadable Excel and Notion templates for trade tracking.
The more useful question is not:
“Did I make money today?”
It is:
“Under what volatility conditions did my edge actually work?”
That is a much better research question.
Review The Filter Every 30 To 50 Trades
Do not change the filter after every losing trade.
That is how traders end up with constantly changing systems.
Instead, gather enough observations.
After 30 to 50 trades, review performance by volatility regime.
You may also like:
Low volatility Expectancy 0.2R
Expected 0.5R normal volatility
Expected expansion: 0.8R
Expected -0.3R Extreme volatility
Those are illustrative numbers.
But supposing you have this trend in your own data.
You’d have something to keep you busy.
Your filter could be:
DON’T go for low volatility.
Under normal conditions, trade selectively.
Expand. Prioritize.
Treat excessive volatility as a separate strategy.
This is a real trading framework.
Volatility Filters Can Improve Psychology Too
This is an underrated benefit.
Many traders experience frustration because they trade every visible setup.
When the market is quiet, they take mediocre breakouts.
When the market becomes volatile, they chase.
A volatility filter introduces a third option:
Do nothing.
That matters psychologically.
Once you know that your strategy is designed for specific market conditions, sitting out becomes part of the strategy rather than evidence that you are missing opportunities.
You are no longer trying to trade the market all day.
You are waiting for the market to enter the environment where your edge has been demonstrated.
Avoid The “Dead Market” Trap
A low-volatility market can be particularly dangerous for active traders because it creates the illusion of opportunity.
Price is moving.
Candles are forming.
Levels are breaking by one or two pips.
It feels like something is happening.
But if the average movement is too small relative to your stop-and-target requirements, you may simply be paying transaction costs to participate in noise.
This is where the pip filter earns its keep.
If your strategy needs 15 pips and the market is repeatedly producing 4 to 6 pip bursts, stop trying to force a 15-pip trade out of a six-pip environment.
Wait for the regime to change.
Avoid The Everything Is Moving Trap
The other error is to trade in any high volatility condition.
Traders sense urgency when volatility unexpectedly expands.
They assume that opportunity has come.
Sometimes it does.
Sometimes the market is simply unstable.
The solution is to add a second condition.
Ask:
Is volatility expanding with structure?
Is the movement occurring in the direction of the higher-timeframe context?
Is the spread acceptable?
Is the stop structurally valid?
Is there enough remaining room for the next major level?
Is the required target realistic?
If volatility is high but these conditions are poor, the filter should not grant permission.
Volatility And Execution Costs
Volatility also interacts with spread and execution.
A sudden increase in movement can create more trading activity, but it can also alter execution conditions.
The relationship between volatility, trading activity, and spreads has been studied in FX markets, including evidence that spreads can rise with volatility in some market environments.
This is why a volatility filter should eventually be combined with an execution filter.
A market can have excellent movement but poor execution quality.
Your DayTradersDiary.com guide on trading only when spread advantage occurs explores this problem from another angle, particularly the trade-off between saving spread and accepting a worse entry.
The important connection is this:
Volatility creates opportunity, but execution determines how much of that opportunity you actually capture.
The Pip Filter And News
News creates another special situation.
You may see a sudden 30-pip candle and conclude that your volatility requirement has been satisfied.
But the candle may be a one-off event.
Your baseline has not necessarily changed.
The market has experienced an information shock.
For this reason, I prefer to separate normal volatility expansion from event-driven volatility.
If your strategy is not designed for news, you can mark the period around major releases as a separate regime.
If your strategy is specifically designed for news, build a completely different dataset.
Do not mix ordinary session volatility with news volatility and expect the resulting average to remain meaningful.
A More Advanced Filter: Volatility Relative To ATR
You can combine pip movement with ATR.
Suppose the current five-minute average range is 9 pips.
ATR(14) is 7 pips.
The current range is 1.29 times ATR.
That suggests expansion.
You can then ask whether your strategy historically performs better when the ratio is above a certain level.
Fidelity notes that ATR can be applied to different timeframes and that shorter periods can be used when the objective is to focus more closely on recent volatility.
For a day trader, this provides a useful framework:
Use ATR to understand the broader volatility state.
Use pip range to understand what the market is actually doing in trade-relevant units.
Use structure to determine whether the movement is actionable.
Use position sizing to keep the monetary risk constant.
That combination is far more useful than relying on a single indicator.
A Complete Pip-Based Volatility Filter
Here is a practical model you can test.
Your execution timeframe is five minutes.
You calculate the average range of the last 20 completed candles.
You compare that number with the historical average range for the same currency pair and session.
You calculate the volatility ratio.
You also measure the current session range.
Then you check the distance to the next structural level.
Finally, you calculate your actual stop and position size.
Imagine the data says:
Current average range = 9 pips
Historical average = 7 pips
Volatility ratio = 1.29
Session range = 42 pips
Historical session range = 65 pips
Required stop = 14 pips
Target = 28 pips
Expected R = 2R
This could qualify for a breakout strategy if your historical research supports those conditions.
Now, imagine the same setup occurs after the session has already traveled 95 pips against a historical average of 65.
The volatility ratio remains attractive, but the consumed session range is extreme.
Your filter may reject the trade.
This is why one metric is rarely enough.
The Filter Should Answer Three Questions
A mature volatility filter should answer three questions.
Is the market moving enough?
This is your immediate pip-range measurement.
Is the current movement normal for this time and market?
This is your historical comparison.
Is there enough movement left for my setup?
This is your session range and structural analysis.
If you can answer all three, you have a much more useful volatility framework than simply watching ATR rise and fall.
Scaling Your Strategy And Capital
Once you have an edge, another problem eventually appears.
Your strategy may work.
Your execution may be disciplined.
Your risk may be controlled.
But your personal trading capital may limit how much that process can produce in absolute dollar terms.
This is where traders often start increasing risk aggressively.
That is usually the wrong way to solve a capital problem.
A better approach is to separate strategy quality from capital allocation.
If your process has demonstrated an edge, an evaluation account can provide another route to accessing larger notional trading limits without simply increasing the percentage of your own account exposed to each trade.
This is the logic behind professional evaluation programs.
They are not shortcuts.
They introduce another set of constraints that a trader has to operate within.
For example, The5ers High Stakes program currently describes its High Stakes offering as a two-step evaluation with no fixed time limit, subject to its published trading rules and risk limits. Its current rules also specify restrictions on order execution during high-impact news events.
That matters to a volatility-based trader because a strategy that performs well in uncontrolled market conditions still needs to operate within the capital provider’s rules.
Other proprietary trading firms use different structures, evaluation requirements, drawdown models, payout policies, and restrictions.
So the right question is not simply:
“Which firm gives me the biggest account?”
The better question is:
Does the firm’s rule set fit the way my strategy actually trades?
If your strategy relies on news execution, overnight positions, aggressive scaling, or trading specific volatility periods, those rules need to be verified before you pay for an evaluation.
The5ers, for example, currently publishes different program structures and trading conditions across its offerings, including futures and forex-focused programs.
That is why serious traders should treat an evaluation as a business constraint to be researched, not simply as a larger account.
If your data shows that your edge works consistently and your risk process is already stable, you can explore The5ers’ evaluation program and compare its current rules with those of other evaluation-based proprietary trading firms.
The goal is not to use more leverage because it is available.
The goal is to determine whether additional capital allocation makes sense after the trading process has already been proven.
The5ers And Volatility-Based Trading
A volatility filter can also help you determine whether an evaluation account is compatible with your strategy.
Suppose your system only trades when volatility expands.
If the evaluation program has restrictions around news execution, you need to know whether those restrictions eliminate a meaningful part of your trading window.
The5ers currently states that holding positions over news is permitted in its High Stakes program, while execution of orders from two minutes before through two minutes after high-impact news is restricted under the published rules.
That distinction is important.
A trader who holds existing positions through volatility is operating differently from a trader who depends on entering precisely during a news spike.
Your filter, strategy, and funding rules, therefore, need to fit together.
Your Volatility Filter Should Affect Size, Not Just Entries
This is another advanced improvement.
Instead of using volatility only to decide whether to trade, you can use it to determine how aggressively to trade.
Let’s say your usual risk is 0.5%.
You retain that risk within the approach’s preferred volatility regime.
If volatility is abnormally high but still tradable, you might want to reduce risk because the uncertainty around execution and stop distance has increased.
When volatility becomes extreme, you might stop trading completely.
The exact numbers should come from your own risk plan.
The principle is more important:
Volatility can influence both trade selection and risk exposure.
Do Not Increase Risk Because Volatility Looks Good
This deserves emphasis.
A high-volatility environment can produce large winners.
It can also produce large losses.
Your risk percentage should not suddenly increase because candles are larger.
If anything, unusually high volatility may justify a smaller size because your structural stop is likely to be wider.
Your monetary risk should remain controlled.
That is where a volatility filter and position sizing work together.
A Weekly Volatility Research Routine
Grab your trades at the end of each trading week.
Separate them into regimes of low, normal, expansion and high volatility.
Then, compute the expectation for each group.
Next, compare your average stop size, target size, win rate, average winner, average loser, and maximum drawdown.
Then, examine whether your execution quality changed.
This last part is important.
You may discover that your strategy performs well during periods of high volatility, but your execution worsens.
That means the strategy itself may not be the problem.
Your ability to execute it under pressure may be.
The solution would then be different.
What To Do When The Filter And Setup Disagree
This is one of the most useful rules to establish before trading.
Suppose the setup is excellent, but volatility is below your minimum.
Does the setup override the filter?
Or does the filter veto the setup?
Decide before the session.
For a strategy specifically designed around volatility expansion, the filter may have veto power.
For a swing-oriented setup where volatility is less important, it may simply be a matter of context.
The mistake is making an emotional decision after seeing the chart.
A filter is valuable precisely because it removes some discretion.
Common Mistakes When Building A Pip Volatility Filter
The first mistake is using a single fixed pip number across all pairs and sessions.
The second is to use the current candle rather than a sample of recent candles.
The third is assuming that high volatility is automatically good.
The fourth is ignoring how much of the session’s typical range has already been consumed.
The fifth is allowing volatility to override market structure.
The sixth is changing the threshold after every losing trade.
The seventh is optimizing the threshold so precisely that it only works on historical data.
The eighth is forgetting that volatility affects stop-distance and, therefore, position size.
The ninth is mixing news volatility with normal session volatility.
The tenth treats the filter as an input signal rather than an environmental condition.
Avoiding these mistakes will probably matter more than finding the perfect formula.
The Simple Version You Can Start Testing Tomorrow
If you want to build this without creating a complicated system, start with a single currency pair and a single timeframe.
Measure the range in pips for every completed candle.
Calculate the average range of the last 20 candles.
Calculate the historical average range for the same time of day.
Divide the current average range by the historical average range.
Then classify the environment.
No trade below your tested minimum.
Normal execution is within your optimal range.
Above your upper threshold signifies a smaller size, further confirmation, or no trade, depending on your plan.
Then record the results.
Do this for at least several dozen trades before changing the rules.
The objective is not to find the perfect volatility number.
It is to find a stable relationship between market movements and your strategy’s expected returns.
The Real Edge Is Knowing When Not To Trade
This is perhaps the most important lesson.
Most traders spend their energy improving entries.
Experienced traders eventually realize that trade selection can matter just as much.
A good strategy in the wrong volatility environment can produce mediocre results.
A mediocre strategy in the right environment can sometimes look surprisingly good for a while.
Your job is to identify the conditions where your actual edge has been demonstrated.
A pip-based volatility filter gives you a simple way to do that.
It turns vague statements like “the market feels slow” into something measurable.
Instead of saying:
“EUR/USD looks dead.”
You can say:
“The current five-minute average range is 0.68 of its historical session baseline.”
That is actionable.
Instead of saying:
“Today’s market is crazy.”
You can say:
“The current range is 2.7 times normal and the session has already consumed 140% of its typical range.”
That is actionable, too.
Numbers do not eliminate uncertainty.
They make your decisions more consistent.
Frequently Asked Questions
What is a pip-based volatility filter?
A pip-based volatility filter measures recent price movement in pips and compares it with a historical baseline to determine whether current market conditions are suitable for a trading strategy.
It is primarily a market-condition filter rather than a directional trading signal.
How do I calculate pip volatility?
One simple method is to calculate the average high-to-low range of the last 10, 20, or 30 completed candles in pips.
You can then compare that average with the historical average for the same pair, timeframe, and trading session.
What is a good pip volatility threshold?
There is no universal threshold.
A useful threshold depends on the currency pair, timeframe, session, setup type, stop distance, and historical behavior of the strategy.
Instead of choosing a number from someone else’s system, test thresholds against your own trade data.
Is ATR better than a pip-based volatility filter?
They answer slightly different questions.
ATR provides a standardized volatility measurement based on true range.
A pip-based filter translates movement directly into the units traders often use for stops, targets, and execution.
Using both can provide better context than relying on either alone.
Should volatility be high before day trading?
Not necessarily.
Some strategies perform better in low-volatility environments, particularly certain mean-reversion approaches.
Breakout and momentum strategies may require expansion.
The important question is whether current volatility matches the environment in which your strategy has historically worked.
Can I use a pip filter for gold?
Yes, but be careful with the terminology.
Gold is not typically quoted in forex-style pips, unlike currency pairs.
For instruments such as XAU/USD, it is usually better to define movement in terms of the instrument’s actual price increments or points, and then normalize them to the instrument’s typical volatility.
The underlying concept remains the same.
Can a volatility filter improve stop-loss placement?
It can provide useful context.
If volatility expands, a fixed stop may become too tight relative to normal price movement.
A volatility-aware trader can assess whether the structural stop remains appropriate and then recalculate position size so monetary risk stays controlled.
Should I avoid trading when volatility is extremely high?
Not automatically.
Extreme volatility can create opportunity, but it can also change spreads, execution quality, slippage, and market structure.
Whether extreme volatility is tradable should depend on your strategy and historical evidence.
How many candles should I use for a pip volatility filter?
There is no universal answer.
Twenty candles is a reasonable starting point for an intraday experiment, but shorter or longer windows may be more appropriate depending on your timeframe.
The important thing is to test the window rather than assume one number works everywhere.
Should my volatility filter be based on the whole day?
For day trading, a session-specific baseline is often more useful.
London, New York, and Asian sessions have different volatility characteristics.
A pair’s typical five-minute range at one time of day may not represent its normal range at another.
How does volatility affect position size?
If higher volatility requires a wider structural stop, maintaining the same position size can increase the risk of losses.
To keep risk consistent, position size generally needs to be recalculated whenever the stop distance changes materially.
Can I use volatility as a trade entry signal?
You can, but that is different from using volatility as a filter.
A volatility expansion may become part of an entry strategy if it has been tested as such.
However, volatility alone does not provide directional information.
Final Takeaway
A pip-based volatility filter is not another indicator to put underneath your chart.
It is a way of answering a much more important trading question:
Is today’s market behaving in a way that gives my strategy enough room to work?
Start with one pair.
Choose one execution timeframe.
Measure the average pip range.
Compare it with the historical range for the same session.
Track how much of the normal session movement has already been consumed.
Then connect that information to your stop, target, position size, and actual trade expectancy.
Do not try to make the filter complicated on day one.
Build the simplest version that can answer whether the market is too quiet, suitable, or excessively volatile for your particular strategy.
Then collect the data.
After 30 to 50 trades, review it.
You may find that your biggest edge was never another entry pattern.
It was knowing when the market was not giving your existing edge enough room to breathe.
For the next stage, read How To Measure Entry Delay Risk in Forex and compare volatility conditions with the actual price deterioration you experience between your planned and executed entries.