
You spot a bullish trend on the 15-minute chart. Price is making higher highs and higher lows, the moving averages are pointing upward, and the market has already broken through a resistance level.
You switch to the one-minute chart to find an entry.
Within seconds, the picture changes.
Price breaks a minor low. A bearish candle forms. The fast EMA crosses below the slow EMA. A small lower high appears.
Now the one-minute chart looks bearish, even though the 15-minute trend is still bullish.
You hesitate.
A few minutes later, the price reverses and moves sharply higher without you.
This is one of the most frustrating problems in day trading. The higher timeframe gives you a clear directional idea, but the smallest timeframe keeps producing signals that contradict it.
The usual response is to add another indicator, change the moving-average settings, or switch between timeframes until the charts agree.
That rarely solves the underlying problem.
The issue is not necessarily that your indicators are too slow or too fast. The issue is that you are asking a micro timeframe to answer a question that it may not be equipped to answer.
A one-minute chart can help you identify an entry, but it can also exaggerate ordinary pullbacks, temporary liquidity shifts, and short-lived countertrend moves.
A micro timeframe trend filter solves this problem by separating the direction you want to trade from the short-term movement you use to time your entry.
It is not true that all charts must agree.
This is about establishing a repeatable methodology that tells you when a micro-trend is tradable, when it’s just noise, and when the larger market structure has genuinely changed.
What Is a Micro Timeframe Trend Filter?
A micro timeframe trend filter is a set of rules used to determine whether very short-term price movement supports a trade, conflicts with the broader market direction, or lacks enough structure to justify an entry.
It is particularly useful for traders working with one-minute, two-minute, three-minute, and five-minute charts.
The filter can combine price structure, moving-average direction, momentum, volatility, and higher-timeframe context.
But its purpose is more specific than simply identifying whether the market is bullish or bearish.
It should answer three questions.
Is the broader market direction clear enough to establish a trading bias?
Is the micro timeframe moving in a way that supports an entry in that direction?
Has the microstructure reached a point where the original trade idea is invalid?
These questions are related, but they are not interchangeable.
A market can be bullish on the 15-minute chart while bearish on the one-minute chart. That may represent a normal pullback rather than a trend reversal.
A micro trend filter helps you distinguish between those conditions without reacting to every small movement.
Why Micro Timeframes Produce So Much Conflicting Information
The lower the timeframe, the more the price changes direction .
A one-minute candle may be the result of transient order imbalances, transient spread changes, transient reactions to surrounding liquidity, and transient bursts of trading activity.
Some of those movements develop into meaningful trends.
Others disappear within a few candles.
This creates a problem for traders who treat every micro swing as a structural change.
Imagine EUR/USD is trending higher on the 15-minute chart.
On the one-minute chart, the price forms a lower low.
A trader interprets that move as a bearish reversal.
But the lower low may have occurred only because the price pulled back into a previously broken resistance zone before continuing higher.
The micro timeframe was not necessarily wrong.
It was showing a smaller part of the market’s behavior.
The mistake was assuming that a small-scale change automatically invalidated the larger directional bias.
A useful way to think about this is that every timeframe has its own structure, but not every structural change has the same significance.
A one-minute break of structure can be important for a scalping setup.
It does not automatically mean that the 15-minute trend has reversed.
The filter must therefore distinguish between a local directional shift and a broader change in market conditions.
What Research Says About Trend Filters
Trend-following research provides a useful foundation for building a micro timeframe filter, although it does not establish a universally profitable one-minute trading strategy.
A 2020 paper by Valeriy Zakamulin and Javier Giner, published in Quantitative Finance, compared moving-average and momentum-based trend-following rules. The authors examined how the two approaches relate to one another and how their forecasting properties behave under different trend conditions.
The practical consequence for the day trader is that several trend measurements can describe comparable information without being identical. A moving average filter and a price momentum filter may agree on a strong trend but disagree on a weaker trend. That is why it is crucial to know what each filter is doing instead of piling up indicators that are giving the same information.
In a separate 2022 study, Zeming Li, Athanasios Sakkas and Andrew Urquhart looked into intraday time-series momentum across 16 developed markets. The researchers reported evidence of intraday momentum and found that its strength varied with market factors including liquidity and volatility.
This is important since you do not want your micro time frame filter to regard all trading conditions as the same. A short-term trend rule may work differently in a tranquil session than at a volatile open or a market reacting to new information.
A 2022 study published in the International Review of Financial Analysis also explored short-term momentum in the U.S. stock market and the statistical issues in testing trend-following methods.
The lesson is not that a particular EMA combination or structure filter is proven to work across markets.
It is that trend persistence, market conditions, and the way a filter is tested all matter.
For a micro timeframe trader, this means the filter should be simple enough to understand, specific enough to test, and flexible enough to distinguish between different market environments.
The Core Principle: Separate Bias, Setup, and Trigger
The most useful micro timeframe trend filters begin with a separation of responsibilities.
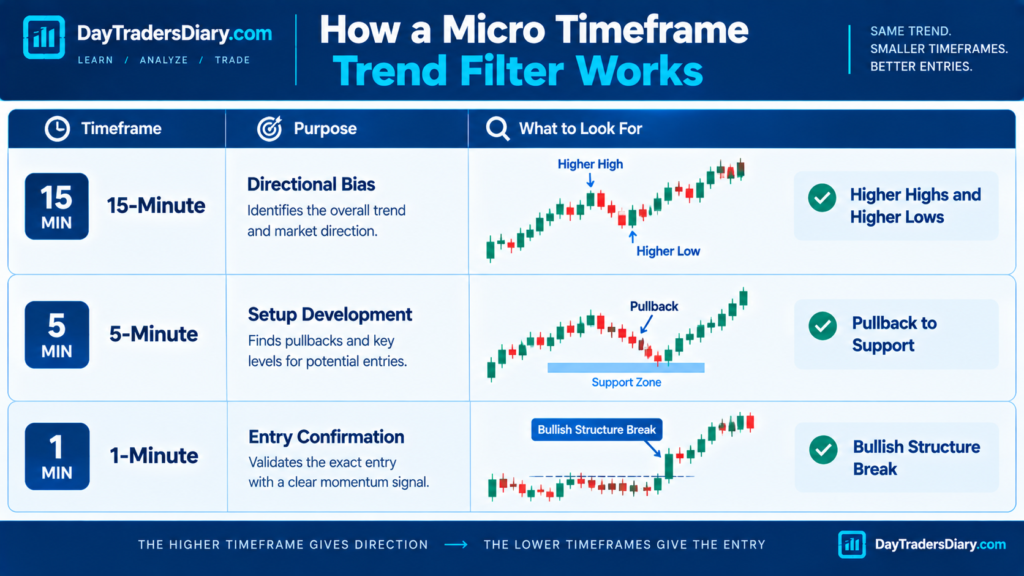
The higher timeframe establishes the directional bias.
The intermediate timeframe identifies the trading opportunity.
The micro timeframe determines whether the entry conditions are present.
For example, a trader might use the 15-minute chart for directional bias, the five-minute chart for setup development, and the one-minute chart for execution.
The 15-minute chart might show a bullish market structure.
The five-minute chart might show a pullback into a previous breakout zone.
The one-minute chart might then show a bullish structure shift after the pullback.
Each timeframe contributes a different piece of information.
The mistake is allowing the one-minute chart to rewrite the higher-timeframe bias continuously.
A better process is to establish the bias first, define the setup second, and use the micro chart only to confirm whether the entry conditions have developed.
This creates a hierarchy.
It also reduces the temptation to change your opinion every time a new candle appears.
Step 1: Define the Higher-Timeframe Direction
Before opening the one-minute chart, determine what the broader market is doing.
You do not need a complicated indicator dashboard.
Start with market structure.
Is price making higher highs and higher lows?
Is it making lower highs and lower lows?
Or is it moving between clearly defined support and resistance levels without establishing a directional trend?
A bullish structure suggests that buyers have been able to push the price beyond previous highs and defend pullbacks at progressively higher levels.
A bearish structure suggests the opposite.
A range suggests that neither side has established sustained directional control.
This classification becomes the first layer of your micro trend filter.
If the higher timeframe is bullish, your default search can focus on long setups.
If it is bearish, your default search can focus on short setups.
If it is ranging, you may need a different strategy or a more selective entry model.
The key is to define the bias before the micro chart starts creating emotional pressure.
Step 2: Identify the Market Regime
Directional bias alone is not enough.
A bullish market can be trending strongly, moving sideways near resistance, or losing momentum after an extended rally.
These conditions should not be treated identically.
A useful micro timeframe filter begins by classifying the market into three broad regimes.
Trending: Price is making directional progress, and pullbacks are generally being followed by continuation.
Ranging: Price is oscillating between boundaries without consistent directional progress.
Transitioning: The market is moving from one condition to another, such as breaking out of a range or losing a previously established trend.
This distinction is important because a trend-following micro filter is designed to capture directional continuation.
It may struggle when the market is moving sideways.
It may also produce conflicting signals during a transition, when the previous trend is weakening, but a new one has not yet become established.
You do not need to predict the next regime perfectly.
You need to recognize when your current trading model is operating in a condition it was not designed to handle.
Step 3: Choose a Micro Timeframe That Matches Your Execution Style
There is no universally correct micro timeframe.
A one-minute chart gives you more frequent observations and potentially tighter entry structures, but it also produces more short-term noise.
A three-minute chart smooths some of that movement while still allowing relatively precise intraday execution.
A five-minute chart provides more context but may require wider stops or later entries for a strategy built around very short-term price action.
The right timeframe depends on the instrument, the session, the strategy, and the amount of price movement you intend to capture.
A good beginning point for a trader with a 15-minute directional tilt may be:
15-minute chart shows the direction of the market.
5-minute chart for the location of the setup.
1-minute chart for confirmation of entry.
This is a starting framework, not a fixed rule.
A trader targeting a move that typically develops over 30 to 60 minutes may find a three-minute execution chart more useful than a one-minute chart.
A trader taking very short scalps may need a different structure.
The important point is to choose the timeframe before the trade rather than switching between charts until the setup looks attractive.
Step 4: Build a Price-Structure Filter
Price structure should be the foundation of the micro timeframe trend filter.
Indicators can help describe momentum, but the structure tells you whether the price is actually making progress.
For a bullish micro trend, look for a sequence in which price breaks a meaningful local high, pulls back, and then holds above the previous structural low.
A higher low followed by a break of the recent high can provide evidence that buyers are regaining control after a pullback.
For a bearish micro trend, look for a lower high followed by a break of a meaningful local low, with subsequent price action failing to reclaim the broken structure.
The word meaningful matters.
A one-minute chart can produce many tiny swing points.
If you treat every minor fluctuation as a structural level, your filter becomes too sensitive.
Instead, identify swings that represent a visible change in short-term control.
For example, a bullish pullback may create several small lower lows within a narrow range.
That does not necessarily mean the bullish structure has failed.
The more important question is whether the price has broken the swing level that supported the original bullish continuation idea.
This is where a structure-based filter becomes more useful than a simple moving-average crossover.
It focuses on what price has actually done rather than what an indicator is currently calculating.
Step 5: Use Moving Averages as a Directional Check
Moving averages can help you assess whether the micro timeframe is moving in the same direction as the broader bias.
A simple combination is a 9 EMA and a 21 EMA.
When the 9 EMA is above the 21 EMA, and both are rising, the short-term price average is generally moving in a bullish direction.
When the 9 EMA is below the 21 EMA, and both are falling, the short-term average is generally moving in a bearish direction.
But the relationship between the averages is only one part of the filter.
A bullish crossover inside a sideways market may have little continuation behind it.
A bearish crossover amid a bullish downturn can be a sign of transitory weakness.
That’s the reason moving averages should be used as a directional filter and not an automatic entry indication.
A practical rule might be:
For a bullish setup, prefer the micro chart to show a rising fast EMA and a slow EMA that is no longer falling sharply.
For a bearish setup, prefer the fast EMA to be declining while the slow EMA is flat or moving lower.
If the averages are flat and repeatedly crossing, treat the market as potentially range-bound.
This is especially useful when the price structure is unclear.
The moving averages do not need to provide a perfect signal.
They need to help you identify when the micro chart is moving against your intended trade.
Step 6: Measure Momentum Without Chasing Price
A micro timeframe trend filter should distinguish between a move that is gaining directional strength and one that is simply moving quickly.
These are not the same thing.
A large bullish candle can indicate strong buying pressure.
It can also represent a late-stage burst of movement that leaves little room for a sensible entry.
Momentum should therefore be evaluated alongside location.
Suppose EUR/USD breaks above a local high and the one-minute candles begin expanding upward.
The move is bullish.
But if the price has already traveled a large distance from the pullback zone, entering immediately may create poor trade economics.
A better approach is to ask whether momentum is developing near a useful structural location.
A bullish structure shift after a pullback is different from a bullish candle appearing after five consecutive large candles.
The first may offer a defined entry and invalidation point.
The second may offer little more than the temptation to chase.
This is why a useful micro trend filter should include a rule for excessive extension.
You might measure the distance from price to a short-term moving average or compare the current movement with ATR.
The exact threshold should be tested on your instrument and timeframe.
The objective is to avoid confusing strong movement with a good entry.
Step 7: Add a Volatility Filter
Volatility affects how a micro trend behaves.
During a quiet session, a 10-pip movement may represent a significant expansion in activity.
During a high-volatility session, the same 10-pip movement may be ordinary noise.
A filter that ignores volatility can therefore become inconsistent.
Average True Range can help you compare current price movement with recent conditions.
For example, you can observe whether the one-minute ATR is expanding or contracting relative to its recent baseline.
If volatility is contracting and the moving averages are flat, the market may be entering a period of compression.
A trend-following micro filter may need to become more selective.
If volatility expands after a range breakout and price establishes a new directional structure, the environment may be more suitable for a continuation setup.
But increasing volatility does not necessarily mean the trend is healthy.
In the event of a reversal, a news shock or a liquidity-driven price spike, there may also be a sudden volatility jump.
So the filter should be a combination of volatility and structure, not just ATR directional indicator.
Step 8: Define the Micro Trend State
At this point, you have several pieces of information.
The higher-timeframe direction.
The market regime.
The microstructure.
The moving-average relationship.
Momentum.
Volatility.
The next step is to combine them into a simple state classification.
A practical framework uses three states.
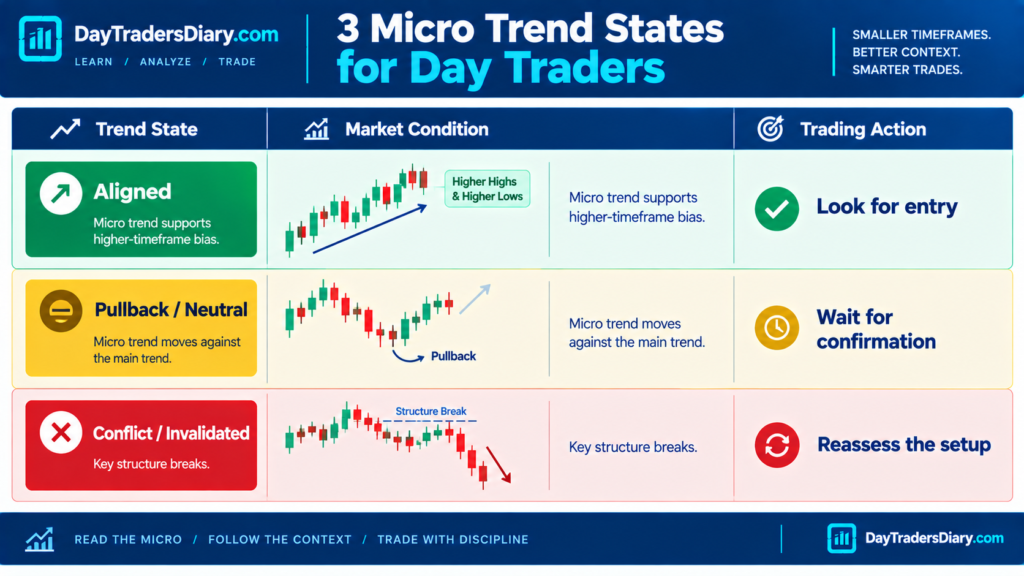
State One: Aligned
The higher timeframe has a clear directional bias.
The microstructure is moving in the same direction.
The moving averages support the direction.
Price is not excessively extended.
The market is not showing obvious signs of a range-bound environment.
This is the state in which a continuation setup can become eligible.
State Two: Pullback or Neutral
The higher timeframe still has a directional bias, but the micro timeframe is moving against it or has become structurally unclear.
For example, the 15-minute chart remains bullish while the one-minute chart is making lower highs and lower lows.
This does not automatically mean the larger trend has reversed.
It may simply be a pullback.
In this state, the trader waits for the microstructure to stabilize or shift back in the direction of the broader bias.
State Three: Conflict or Invalidated
The micro timeframe has broken a level that was essential to the original setup, or the higher timeframe has lost its directional structure.
The original trade idea is no longer eligible under the existing rules.
The trader should reassess rather than continue looking for confirmation of the previous bias.
This three-state model is useful because it replaces constant directional switching with a defined process.
The chart can be bullish, neutral, or invalidated.
You do not need to force a trade out of every condition.
Step 9: Build a Specific Entry Trigger
A trend filter is not an entry strategy by itself.
It tells you which conditions are suitable for a trade.
You still need a specific trigger.
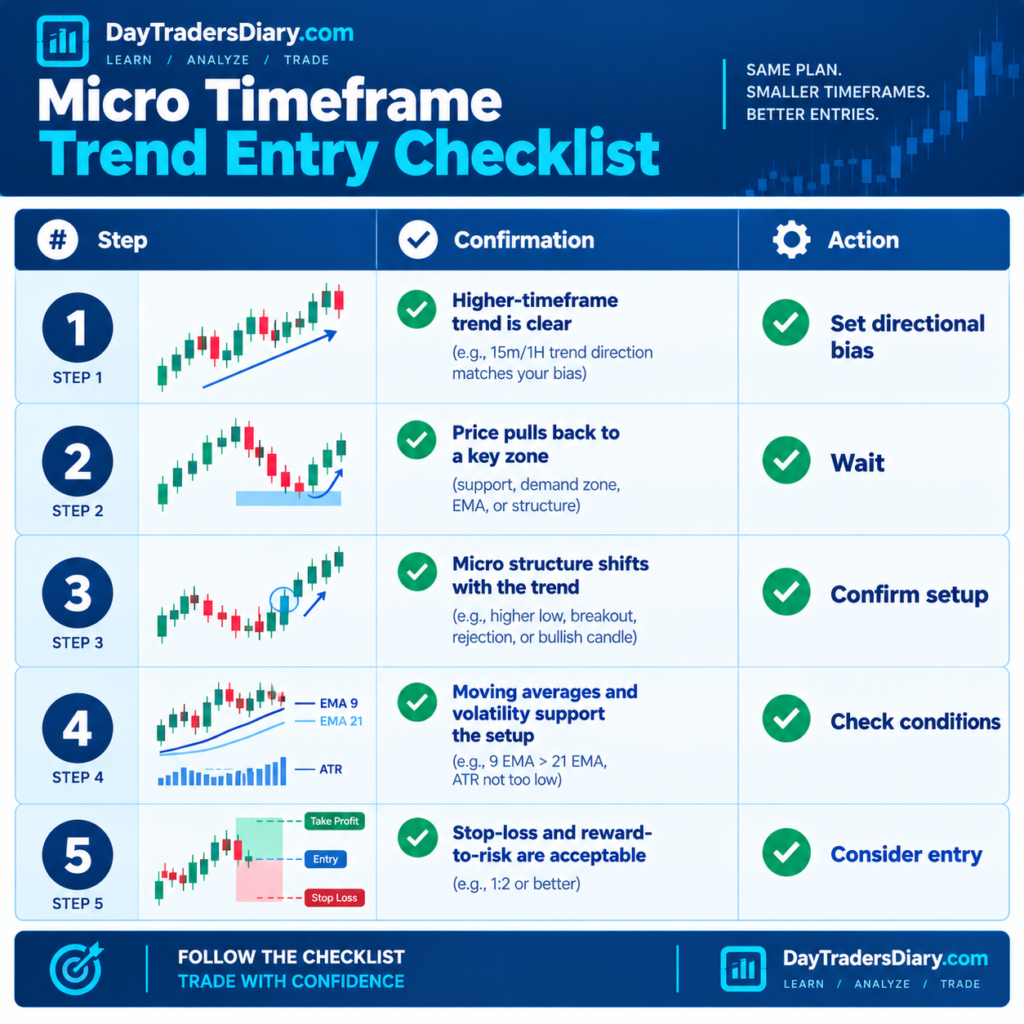
Consider a bullish continuation setup.
The 15-minute chart is bullish.
The five-minute chart shows a pullback into a previous breakout area.
The one-minute chart initially moves lower.
Instead of buying immediately, you wait for the microstructure to change.
Price forms a local low.
It then breaks above the most recent meaningful lower high.
The pullback has shown signs of weakening.
The micro trend is beginning to realign with the broader bullish bias.
You now have a potential entry trigger.
The trade still needs a logical stop, a target, and enough remaining reward to justify the risk.
The important distinction is that the trigger is based on a change in microstructure, not simply on the appearance of a bullish candle.
Step 10: Define Invalidation Before Entry
A trend filter becomes much more useful when you know what would make the setup invalid.
For a bullish continuation trade, the invalidation may be a break below the swing low that supports the entry thesis.
For a bearish continuation trade, it may be a break above the relevant swing high.
The exact level depends on the setup.
What matters is that the stop is tied to the structure that justifies the trade.
Do not choose a stop simply because it fits a preferred lot size.
If the logical stop is too far away, reduce the position size or reject the trade.
If the market has already broken the structure that supported the entry, do not keep the trade alive by moving the stop farther away.
A micro timeframe filter should make invalidation clearer, not provide an excuse to keep adjusting the rules after entry.
A Worked Example: EUR/USD Bullish Continuation
Imagine EUR/USD is trading around 1.0860.
The 15-minute chart shows a bullish structure.
Price has broken above a previous swing high and is holding above the breakout area.
The five-minute chart begins pulling back.
Price moves from 1.0875 to 1.0862.
On the one-minute chart, the fast EMA crosses below the slow EMA.
A trader who relies on the micro crossover alone might interpret this as a bearish trend change.
But the broader context remains bullish.
The five-minute pullback has not broken the key higher-timeframe support.
The micro chart is showing short-term weakness, not necessarily a broader reversal.
Now the price stabilizes around 1.0862.
A local low forms at 1.0867.
Price then breaks above 1.0867 and begins holding above the level.
The fast EMA turns upward.
The microstructure begins aligning with the broader bullish bias.
This is a potential continuation setup.
Assume the trader enters at 1.0869,
Logical stop is at 1.0860, below relevant micro swing low.
Risk is 9 pips.
If the target intended is 1.0887, the possible profit is 18 pips, a 2R setup before costs.
The trader has not entered because the one-minute chart became bullish in isolation.
The entry developed because the higher-timeframe direction, pullback location, and micro structure began aligning.
Now, imagine the price instead breaks below 1.0860 before the entry trigger develops.
The original continuation idea is no longer valid under this setup.
The trader does not keep searching for a bullish entry simply because the 15-minute chart still looks positive.
The microstructure has failed at the level that supported the trade.
That is the purpose of the filter.
It distinguishes a normal pullback from a pullback that has damaged the original setup.
The Pullback-Realignment Framework
A useful way to organize micro trend entries is to think in three phases.
The first phase is directional movement.
The higher timeframe establishes the trend, and the price makes progress in that direction.
The second phase is the pullback.
The micro chart moves against the broader bias, creating a potential entry location.
The third phase is realignment.
The microstructure begins moving back in the direction of the broader trend.
The trader waits for this third phase rather than trying to predict the exact end of the pullback.
This can prevent premature entries.
It also provides straightforward criteria in order for the deal to be eligible.
But there’s a price to be paid for the method.
Realignment takes time, and waiting for it can mean a delayed entry, a smaller remaining payout, or a missed transaction when the price moves fast.
That is why the entry trigger must be tested against the strategy’s actual holding period and target structure.
A filter that improves the win rate but destroys average reward may not improve the strategy’s expectancy.
How to Avoid Overfiltering
One of the biggest mistakes when building a micro timeframe trend filter is adding too many conditions.
The trader begins with a simple structure rule.
Then adds two moving averages.
Then RSI.
Then MACD.
Then a volatility filter.
Then a volume condition.
Eventually, a trade is allowed only when almost every indicator agrees.
The strategy may look cleaner.
But it may also become so restrictive that it misses a large portion of the opportunities it was designed to capture.
More conditions do not automatically mean more useful information.
Some indicators measure closely related aspects of price movement.
If several filters are effectively describing the same momentum shift, they may create the appearance of independent confirmation without adding much new information.
A more practical design is to assign each filter a distinct job.
Market structure defines directional progress and invalidation.
The higher timeframe defines the broader bias.
Moving averages provide a simple momentum check.
ATR describes the volatility environment.
The entry trigger identifies the point at which the setup becomes eligible.
If two filters are doing the same job, test whether both are actually needed.
The Role of Liquidity and Trading Sessions
A micro trend filter should account for the time of day.
The same one-minute structure can behave differently during quiet trading hours and periods of heavy market participation.
For example, a narrow range during a quieter session may remain intact for a long time.
A similar range near a major market opening may break sharply as activity increases.
But greater activity does not guarantee a sustained trend.
The opening move may reverse.
A liquidity sweep may occur before the actual directional move develops.
A scheduled economic release may create a temporary expansion followed by a sharp retracement.
That is why a micro trend filter should not treat every breakout as equivalent.
If your strategy depends on a specific trading session, record the session as part of your setup definition.
You may discover that your filter performs differently during the London session, the New York session, or quieter periods.
That information can help you determine whether the issue lies in the filter itself or in the market environment where you are applying it.
News and the Micro Trend Filter
News creates a particularly difficult environment for micro timeframe trading.
A one-minute chart can produce several apparent structure shifts within a very short period after a major announcement.
The initial move may be driven by the surprise in the data.
The next move may reflect a reassessment of that reaction.
Price may then establish a more sustained direction, or it may return to the pre-news range.
A micro trend filter that normally works during stable conditions may become unreliable during these transitions.
This is why a news-aware filter should distinguish between ordinary price movement and a market reacting to new information.
If the strategy has not been tested around major announcements, a sensible starting point is to avoid treating the initial post-news structure as equivalent to a normal continuation setup.
A useful related topic is How To Judge Entry Delay Risk From News, which explores how waiting for confirmation can improve information while also worsening entry price and reward-to-risk.
The two concepts fit together.
A micro trend filter may help identify when post-news structure has begun to stabilize.
An entry-delay framework helps determine whether the resulting setup still offers acceptable trade economics.
Risk Management: The Filter Does Not Replace Position Sizing
A well-designed trend filter can improve trade selection.
It cannot remove the need for proper risk management.
Suppose your micro setup produces a logical stop of 8 pips on one trade and 18 pips on another.
If you trade the same lot size in both cases, the second trade carries more than double the risk in terms of price distance.
That may be appropriate in some techniques, but it shouldn’t happen by accident.
Position size should reflect actual stop distance, account risk, and instrument parameters.
This is where most traders miscalculate risk. A Position Size Calculator helps translate the planned entry, stop distance, and intended account risk into a position size instead of relying on a fixed lot size across different market conditions.
The calculation should be based on the actual entry and logical invalidation level.
If the microstructure requires a wider stop, the position size should account for it.
If the stop is so wide that the remaining reward becomes unattractive, the correct decision may be to skip the trade.
The filter determines whether the setup is eligible.
Risk management determines whether the trade is economically acceptable.
Do Not Confuse a Better Filter With a Better Trade
This is an important distinction.
A filter can reduce the number of losing trades while also removing profitable opportunities.
Suppose your original micro trend system takes 100 trades.
After adding a higher-timeframe alignment rule, it takes only 45 trades.
The win rate increases.
That looks encouraging.
But what happened to the average winner?
What happened to the average R?
How much profit did the strategy capture from the strongest trend days?
Did the filter eliminate some of the trades that produced the largest gains?
A higher win rate does not automatically mean higher expectancy.
You need to measure the complete distribution of results.
A filter should be judged by how it changes the strategy’s overall performance after costs, not simply by how many losing trades it removes.
Build a Micro Trend Journal
If you want to improve the filter, your journal needs to record more than entry, stop, target, and result.
You need to record the market condition that existed when the trade was taken.
Start with the higher-timeframe bias.
Record whether the market was trending, ranging, or transitioning.
Record the microstructure at the time of entry.
Record whether the moving averages were aligned, flat, or crossing repeatedly.
Record the volatility condition.
Record whether the setup developed during a pullback, a breakout, or a reversal attempt.
Then record the actual result in R.
The most useful additional field is the filter state at entry.
Was the trade fully aligned?
Was it taken during a pullback?
Was there a conflict between the higher and lower timeframes?
Was the market transitioning?
This classification allows you to compare like with like.
A bullish continuation trade should not automatically be grouped with a countertrend reversal simply because both happened to use the same EMA combination.
A downloadable Trade Journal Template can help you keep these fields consistent and make the review process more useful.
Measure the Right Performance Metrics
Win rate is only one part of the picture.
For a micro timeframe trend filter, you should pay particular attention to average R, average winner, average loser, expectancy, profit factor, maximum drawdown, and the number of trades taken in each market regime.
Maximum Favorable Excursion can help you understand how far the price moved in your favor before the trade ended.
Maximum Adverse Excursion can help you understand how far the price moved against the trade before the outcome was determined.
These metrics can reveal whether the filter is improving entry quality or simply changing how trades are managed.
For example, suppose filtered trades have a higher average MFE, but the same average realized R.
That may indicate that the entry selection has improved, but the exit process is failing to capture the available movement.
On the other hand, if filtered trades have a higher win rate but significantly smaller average winners, the filter may be selecting easier but less profitable moves.
You need to know which part of the process is changing.
The 30-Trade Filter Test
A practical starting point is to collect a sample of 30 trades using one clearly defined version of the filter.
That sample is useful for identifying obvious execution problems, but it is not enough to establish that the strategy has a durable statistical edge.
For each trade, record the higher-timeframe bias, micro structure, volatility condition, entry trigger, stop distance, result in R, and whether the original rules were followed.
After the sample, review the trades by condition.
Compare aligned continuation trades with trades taken during pullbacks.
Compare trending conditions with the ranging conditions.
Compare trades where the moving averages were clearly directional with trades where the averages were compressed.
You may discover that the filter works well in one environment and poorly in another.
That is more useful than changing every indicator setting after a short losing streak.
Once you have identified a promising pattern, test it on a separate sample or use a properly designed out-of-sample process.
The objective is to find a repeatable relationship rather than a rule that merely fits the trades you already observed.
The Problem With Optimizing Every Parameter
Micro timeframe strategies are particularly vulnerable to overfitting.
A trader can test dozens of EMA combinations, structure thresholds, ATR settings, and confirmation rules.
Eventually, one combination will look excellent on historical data.
But the result may be partly due to chance.
This is especially dangerous on a one-minute chart, where small changes in spread, execution, candle construction, and session conditions can materially affect the outcome.
A more robust approach is to begin with a simple filter and change one major variable at a time.
For example, test whether higher-timeframe alignment improves the existing system.
Then test whether a volatility filter adds value.
Then test whether a structure-based trigger improves the entry.
Keep a record of every meaningful change.
Do not assume that the version with the most impressive historical return is the most reliable one.
A filter that behaves reasonably across several market conditions may be more useful than one that performs exceptionally well in a narrow historical sample.
Scaling and Capital Growth
A micro timeframe trend filter becomes more valuable when it improves consistency without creating excessive trading activity.
That is particularly relevant for traders who want to scale a strategy beyond a small personal account.
But the distinction between a tested edge and an attractive backtest matters.
A trader who frequently changes the filter, overtrades during ranges, or ignores the original stop rules may struggle even with access to larger capital.
Evaluation-based proprietary trading programs can provide a structured route for traders who have a tested strategy but limited personal capital.
The5ers is one option traders may research alongside firms such as FTMO and FundingPips.
The key is to treat an evaluation as a professional process rather than a shortcut.
Before choosing a program, review the current drawdown rules, daily loss limits, permitted trading strategies, news restrictions, holding rules, and payout conditions.
This is important information for traders on the micro timeframes since the frequency of trading, costs of execution and short-term volatility might impact the results with tight loss limits.
A strategy that seems successful on a chart may behave differently when you add spreads, commissions, slippage and account limits.
If your micro timeframe filter has demonstrated consistency across different market conditions, consider researching a The5ers evaluation account as one possible step toward accessing more trading capital.
The decision should come after validating the process, not before.
Capital can expand the scale of a proven method.
It cannot turn an untested filter into a reliable strategy.
Common Mistakes When Building a Micro Timeframe Trend Filter
One of the most common mistakes is allowing the micro timeframe to override the higher-timeframe bias every time price makes a small structural move.
That creates constant directional switching.
Another mistake is treating moving-average alignment as proof of a trend. The averages may be aligned while the price remains trapped inside a range.
A third mistake is entering after an extended micro move simply because the filter finally turns bullish or bearish.
The signal may be valid, but the entry may no longer offer enough remaining reward.
Another problem is using the same stop distance and lot size in every market condition. Micro timeframe volatility changes, and position sizing must reflect the actual stop distance.
Finally, traders often change the filter after a small number of losses without identifying what actually failed.
Is the market range trading?
Was the entry tardy?
But was the tilt to the greater time frame wrong?
Did the structure kill the trade?
Were the execution costs the edge that was expected?
They are two different problems.
A useful filter helps you identify which one occurred.
A Simple Daily Routine for Micro Trend Filtering
Before the trading session, identify the broader market structure and mark the most important support and resistance levels.
Decide which market conditions your strategy is designed to trade.
Then define the higher-timeframe directional bias.
When a potential setup appears, move to the intermediate chart and identify whether the price is developing a pullback, breakout, or continuation structure.
Use the micro chart to wait for the specific entry trigger.
Before entering, check whether the microstructure supports the broader bias, whether the price is excessively extended, whether volatility is suitable, and whether the logical stop leaves enough room for the trade to work.
Calculate position size from the actual stop distance.
Once the trade is active, follow the predefined invalidation and exit rules.
After the session, review whether the filter correctly classified the market and whether the entry followed the process.
This routine may sound simple.
Its value comes from applying the same decision sequence consistently rather than improvising a new interpretation for every candle.
Frequently Asked Questions
What is a micro timeframe trend filter in day trading?
A micro timeframe trend filter is a collection of rules that assist you in determining if the price action in a very short-term time frame is supporting a trade, in contradiction with the larger market trend, or is simply not structured enough to justify an entry. It often uses charts of one to five minutes and a larger time frame bias.
Which timeframe is best for a micro trend filter?
There is no single best time frame for all. A one-minute chart will provide you with more comprehensive information on where to get in, but it also creates more noise. Three-minute and five-minute charts smooth away some of that motion. The correct decision depends on instrument, trading session, strategy, and anticipated holding period.
How do I combine higher and lower timeframes?
A realistic way to do this is by employing the higher timeframe for directional bias, the intermediate timeframe to develop a setup, and the micro period to confirm entry. A trader may utilize the 15-minute chart for direction, the 5-minute chart for the setup, and the 1-minute chart for the execution, for example.
Which indicators are useful for a micro timeframe trend filter?
Moving average, ATR and momentum indicators can be used to describe direction and volatility. The price structure, however, should be the central filter. You get more from indicators when they tell you different things than when they tell you the same thing.
How do I avoid false micro trend signals?
Look for a significant structural change. Make sure the larger trend is confirming the direction. Consider volatility and placement. Don’t consider every small movement as a reversal of the trend. The erroneous signals are more common if the filter is checked across trending, ranging, and transitioning conditions.
Should I trade against the higher-timeframe trend?
Countertrend trades can be valid if they belong to a separately tested strategy. However, they should not be treated as equivalent to trend-aligned continuation trades. A countertrend setup generally requires its own entry logic, invalidation rules, and performance analysis.
Can I use moving averages alone to identify micro trends?
You can build a moving-average-based system, but moving averages alone do not describe every relevant market condition. A crossover may occur during a range or after the price has already traveled a substantial distance. Structure, volatility, and location can help put the signal into context.
How many trades should I test before changing the filter?
A sample of 30 trades may be useful to spot obvious problems, but it is not adequate to develop a sustainable edge. Keep testing for varied market situations and out-of-sample data if possible before you make major changes.
Does a micro trend filter improve win rate?
It may improve win rate in some conditions, but that does not guarantee better overall performance. You should also evaluate average R, average winner, average loser, expectancy, drawdown, and transaction costs.
How does a micro trend filter help with risk management?
It can help detect when a trade is in line with the general market, when a setup is incorrect, and when market conditions are not favorable. Position size and stop placement should still be based on actual entry, logical invalidation, and planned account risk.
The Real Edge Is Separating Noise From Structure
A micro timeframe trend filter is not designed to predict every short-term move.
It is designed to stop you from treating every short-term move as equally important.
The higher timeframe provides context.
The intermediate timeframe identifies the opportunity.
The micro timeframe helps you decide whether the entry conditions have developed.
When those roles remain separate, the chart becomes easier to interpret.
A bearish 1-minute decline no longer automatically invalidates a bullish 15-minute trend.
A bullish EMA crossover doesn’t automatically mean buy anymore.
A short-term structural break is an indication to pay attention, not a reason to change direction abruptly.
That is the real purpose of the filter.
For your next 30 trades, record the market regime and micro trend state at entry. Separate aligned continuation trades from pullback and conflict conditions, then compare the results in R.
Do not begin by searching for a more complicated indicator.
Begin by finding out which market conditions your current process actually handles well.
Once you understand that, you can build a filter around evidence rather than intuition.
For your next read, explore How To Spot Fake Crossover Signals next to find out why moving-average relationships often fail during sideways markets, and how price structure can assist tell a genuine trend shift from a transitory variation.