
One of the easiest ways to lose money with moving averages is to treat the crossover itself as the trade.
A fast EMA crosses above a slow EMA.
You buy.
Twenty minutes later, the averages cross back.
You sell.
Another thirty minutes pass.
They cross again.
You buy again.
By the end of the session, the market has gone almost nowhere, but your account has absorbed several small losses, spreads, and commissions.
The frustrating part is that the indicator was not necessarily broken.
The crossover happened exactly as designed.
The problem was that the trader assumed every crossover represented a meaningful change in market structure.
It does not.
A moving-average crossover tells you that one smoothed measure of price has moved through another. It does not tell you whether the move has enough momentum to develop into a trend.
That distinction becomes particularly important for day traders.
On a trending day, a crossover can help identify a sustained directional move. On a sideways day, the same crossover can become a machine for producing false entries.
The real skill is therefore not finding the “best” moving-average crossover.
It is learning how to recognize when the market environment is hostile to crossover signals.
That requires looking beyond the two lines.
What Is a Fake Crossover Signal?
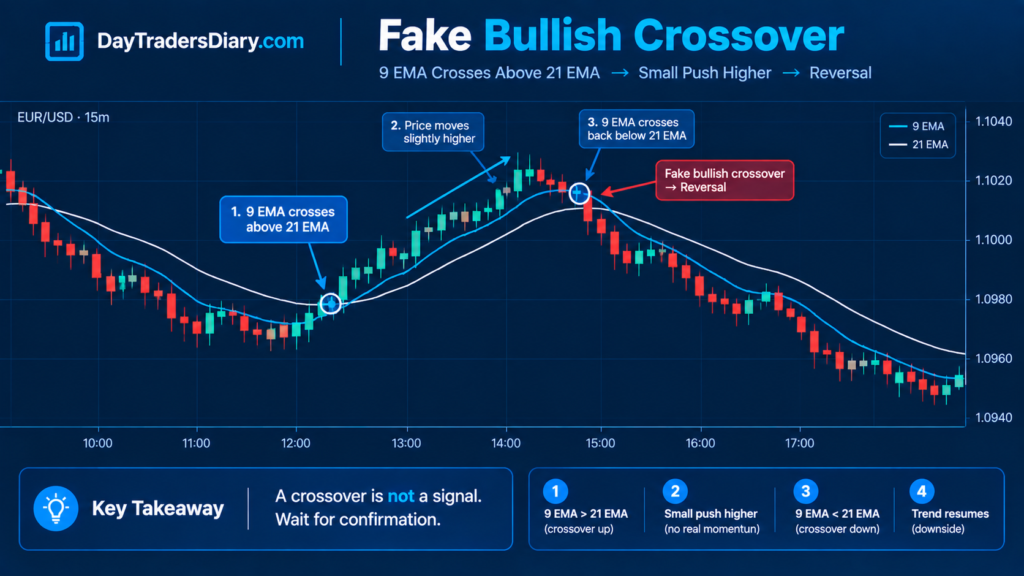
A fake crossover signal occurs when a fast-moving average crosses a slower-moving average, suggesting a directional shift. Still, the price movement fails to develop into the expected trend.
In a bullish example, a 9 EMA crosses above a 21 EMA.
The trader interprets the crossover as bullish.
Price moves slightly higher.
Then momentum disappears.
The fast average turns sideways or rolls over.
Price falls back below the averages.
The original bullish crossover is effectively invalidated.
This is commonly called a whipsaw.
The important point is that the crossover was not necessarily “wrong” mathematically.
The averages really did cross.
The interpretation was wrong because the trader attributed more information to the crossover than it actually contained.
That is one of the most important lessons when learning how to spot fake crossover signals in forex.
Why Moving-Average Crossovers Produce False Signals
Moving averages are smoothers.
They average prior prices to smooth out short term disturbance.
That is precisely what makes them useful.
That is also why they might be deadly if not used in context.
A moving average does not react to the market’s future.
It reacts to the market’s recent history.
When the price suddenly changes direction, the fast average reacts first.
The slower average reacts later.
The crossover occurs somewhere between those two responses.
In a strong trend, this lag can be useful because the crossover confirms that directional pressure has persisted.
In a range, however, price can repeatedly move from one side of the averages to the other.
The averages then follow the price back and forth.
You get crossover after crossover.
This is why crossover systems tend to struggle in low-directional environments.
CME Group’s technical analysis material describes moving-average crossovers as signals that can indicate shifts in price direction. It explains how traders commonly use shorter and longer averages together to interpret trend conditions.
The keyword is “can.”
A crossover can indicate a shift.
It does not guarantee one.
The Research Problem With Treating Crossovers as Magic Signals
There is a deeper issue here.
Technical rules can appear powerful when tested without properly accounting for the statistical and trading environment in which they operate.
Research published in the Journal of Econometrics examined statistical problems that can arise when technical trading rules based on moving-average differences are used in forecasting models. The paper showed that apparently significant relationships can emerge even when the underlying predictive relationship does not actually exist.
For a day trader, the practical lesson is not that moving averages are useless.
A crossover requires a defined trading process.
Which market?
Which timeframe?
Which volatility regime?
What constitutes confirmation?
Where is the invalidation?
How much does the spread cost?
How many crossover trades occur during a range?
Without these definitions, “the crossover works” is not a meaningful trading statement.
A more recent study on trend-following with transaction costs also found theoretical support for moving-average crossover rules under particular assumptions and historical simulations. That is useful because it reinforces a more balanced conclusion: crossover rules can have a legitimate role, but their usefulness depends on the strategy’s structure and trading costs.
That is exactly how a professional trader should approach the indicator.
Not as a magic trigger.
As one component of a defined system.
The First Sign of a Fake Crossover: Price Is Going Nowhere
One of the most reliable clues is surprisingly simple.
Look at the price before looking at the crossover.
If the price has been moving sideways for the last 20, 30, or 50 candles, you should immediately become suspicious of a fresh crossover.
Suppose EUR/USD has been trapped between 1.0840 and 1.0870 for several hours.
The 9 EMA crosses above the 21 EMA.
A beginner sees:
“Buy signal.”
An experienced trader sees:
“Where is the market actually going?”
If the price remains within the same range, the crossover may reflect movement within that range.
The averages are reacting to price oscillation.
They are not necessarily identifying a new trend.
This is one of the easiest ways to reduce false crossover trades.
Before asking whether the averages crossed, ask whether the price has actually escaped a meaningful area.
The Range Test
A simple filter is to identify the recent trading range before acting on a crossover.
If the price is still inside the range, demand additional evidence.
If the price has broken the range and is holding outside it, the crossover becomes more interesting.
Consider two scenarios.
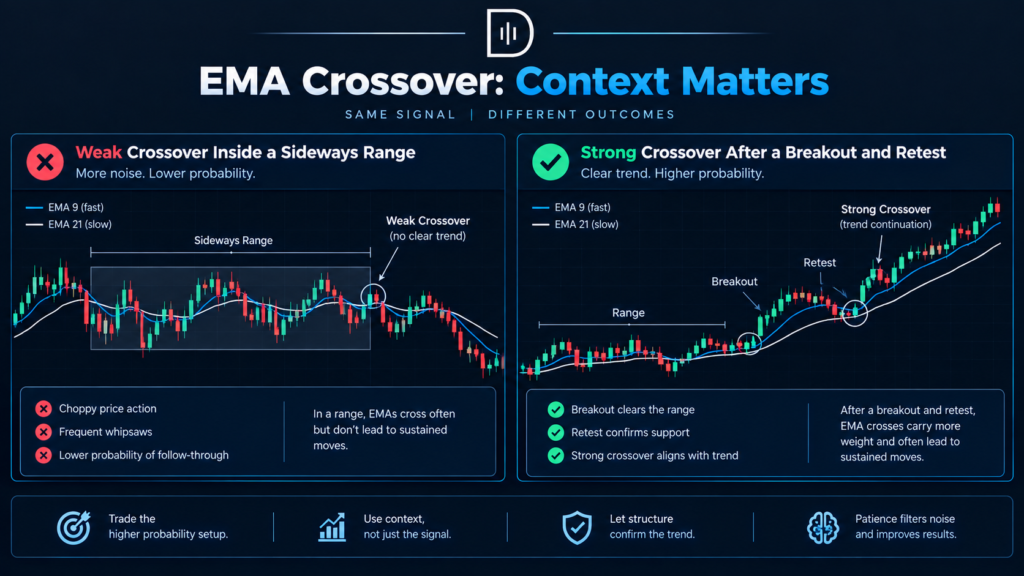
In the first scenario, the 9 EMA crosses above the 21 EMA, while the price remains below yesterday’s high and within the morning range.
In the second scenario, the same crossover occurs immediately after price breaks the morning high, closes above it, and successfully retests the breakout area.
The indicator is identical.
The context is not.
That is why experienced traders often appear to use the same indicator differently.
They are not necessarily changing the indicator.
They are changing the conditions under which they allow the indicator to influence a decision.
The Second Sign: The Averages Are Flat
A crossover is more suspicious when both averages are nearly horizontal.
This is a subtle but powerful filter.
Imagine the 9 EMA and 21 EMA moving sideways around each other.
Price crosses above them.
The fast EMA crosses the slow EMA.
Technically, you have a bullish crossover.
But what is the slope telling you?
Almost nothing.
The averages are not separating.
They are simply changing the order.
Compare that with a crossover in which the 9 EMA is rising sharply and the 21 EMA is rising, but more slowly.
Now the crossover is accompanied by directional movement.
That does not guarantee continuation.
It does, however, provide additional information.
A useful mental model is:
Crossover = relationship.
Slope = direction.
Separation = persistence.
You want to know all three.
The Third Sign: The Crossover Happens Too Close to the Opposite Side of the Range
This is where many traders get trapped.
Suppose the price has been ranging between support and resistance.
A bullish crossover occurs near resistance.
The trader buys because the moving averages are bullish.
Price has only a small amount of room before reaching the range ceiling.
Then sellers appear.
The crossover may have been technically valid, but the location was poor.
This is why a crossover should never be evaluated in isolation from nearby support and resistance.
A bullish crossover directly underneath major resistance is not equivalent to a bullish crossover after the price has broken resistance and held above it.
The same indicator event can have completely different trade economics.
The Fourth Sign: The Crossover Is Already Extended
This is one of the most common traps in fast markets.
Price moves strongly.
The fast-moving average eventually crosses the slow-moving average.
The trader enters because the crossover has finally occurred.
But the market has already traveled a large distance.
The crossover is technically confirming what price has already done.
You are not buying the beginning of the move.
You may be buying the middle or the end of it.
This is especially common with short-period EMAs on lower timeframes.
A 5/20 crossover on a one-minute chart can happen repeatedly after relatively small price movements.
If you wait for the crossover instead of understanding the underlying price structure, you can repeatedly enter after the useful part of the move has already happened.
The Distance From Price Test
A useful filter is to compare the current price with the slower-moving average.
If the price is extremely extended from the slow average, be careful about treating a fresh crossover as a low-risk entry.
The exact threshold should be tested rather than guessed.
For example, you could measure the distance between price and the 21 EMA in ATR units.
A crossover that occurs when the price is only 0.3 ATR away from the average is structurally different from one that occurs 1.8 ATR away.
The second may have more momentum.
It may also have much greater mean-reversion risk.
This is where context matters more than a fixed rule.
You are not trying to identify the perfect distance.
You are trying to determine whether your crossover entries become less effective when the price becomes excessively extended.
The Fifth Sign: The Crossover Candle Has a Weak Close
This is an underrated filter.
A crossover may occur intrabar.
Price pushes through the moving averages.
The lines cross.
The trader enters.
Then the candle closes back inside the previous range.
That is very different from a crossover supported by a strong close near the candle’s extreme.
For example, suppose the 9 EMA crosses above the 21 EMA during a bullish candle.
But the candle finishes near its midpoint and leaves a long upper wick.
The market technically produced the crossover.
But the candle is telling you that buyers did not maintain control into the close.
You do not have to reject the trade automatically.
You have to recognize that the crossover has weaker confirmation.
This is where price action becomes more useful than the indicator alone.
The Sixth Sign: No Structure Break
This may be the most useful filter for active day traders.
A moving-average crossover without a meaningful break of market structure is often less informative than traders assume.
Suppose price forms:
Lower High
Lower Low
Lower High
Lower Low
Then a bullish crossover appears.
But price has not broken the most recent meaningful lower high.
The averages are bullish.
The structure is still bearish.
There’s a scuffle.
Now let’s look at another set-up.
Price makes a higher low, breaks the previous swing high, stays above that swing high and the fast EMA crosses over the slow EMA during the move.
Now the crossover coincides with a structural change.
The difference is significant.
You are no longer asking the moving averages to predict a change in trend.
You are using them to confirm a change already visible in price.
That is a much stronger role for an indicator.
The Fake Crossover Checklist
Instead of asking:
“Did the moving averages cross?”
Ask:
“Did the market change?”
That question creates a much better decision process.
Look for a meaningful shift in swing structure.
Look for a break from a defined range.
Look for slope.
Look for separation.
Look for a strong close.
Look at nearby support and resistance.
Look at volatility.
Look at whether the move is already extended.
The more of these factors disagree with the crossover, the more suspicious you should become.
You do not need every factor to agree.
You need enough independent information to justify the risk.
The Two-Candle Confirmation Trap
Many traders handle crossover concerns by applying a simple rule:
I’ll wait for two candles.
That’s determined.
It can go wrong.
In a ranging market, two candles can go back and forth within the same range.
You have delayed the entry without improving the quality of information.
This is an important distinction.
Time confirmation is not automatically information confirmation.
Waiting for two candles only makes sense if those candles prove something meaningful.
For example:
The crossover occurs.
The next candle breaks the recent swing high.
The following candle holds above the breakout.
Now the waiting period has produced information.
If the next two candles remain between support and resistance, you have probably gained little.
The Retest Test
One of the strongest ways to filter a crossover is to wait for a retest of a meaningful level.
Imagine GBP/USD breaks above resistance.
The 9 EMA crosses above the 21 EMA.
Instead of immediately buying, you wait.
Price pulls back approaching the broken resistance line.
The level stays.
Price starts to rise higher again.
The crossover now has support for:
A breakout of the range.
A structural change.
Re-tested.
One more try.
This does not eliminate false signals.
Nothing does.
But it changes the type of information you are using.
The moving average is no longer carrying the entire trade thesis.
It is part of a larger sequence.
The Most Dangerous Fake Crossover Is the One That Looks Profitable
Here is a psychological trap that experienced traders still encounter.
A fake crossover does not always lose immediately.
Sometimes, the price moves in your direction for a few candles.
You come in.
You see +0.5R.
And then momentum is gone.
Price is back to your entry.
Then it backfires.
You recall it as a good signal that failed’ because it was temporarily beneficial in the trade.
That can cause you to make the wrong adjustment.
You may tighten the stop.
You may take profits faster.
You may add another confirmation indicator.
But the real problem may have been that the market was in a range.
Your trade was never designed for that environment.
The correct solution is not necessarily a better exit.
It may be an environment filter.
Fake Crossover Versus Late Crossover
These two are often confused.
A fake crossover occurs when the signal develops but fails to produce sustained directional movement.
A late crossover occurs when the directional move has already happened before the crossover.
They can look similar on the chart.
The solution is different.
For a fake crossover, you need better context or filtering.
For a late crossover, you need better entry timing.
This distinction becomes important when reviewing your journal.
If most losses happen because price reverses shortly after entry, your problem may be false signals.
If most trades move in your direction but never reach your planned target because you entered too late, your problem may be signal latency.
Those are different execution problems.
Use ATR to Measure the Market Environment
Average True Range can help you assess whether the current market has sufficient volatility to support your crossover strategy.
Imagine your crossover system normally works well when the 15-minute ATR is expanding.
And then you see most losing crossover transactions occur when ATR is decreasing.
Now you have a working filter.
The filter is not:
Don’t trade low ATR.
It’s
In the past my crossover system has tended to do different things when the volatility is contracting.
That is a much more useful observation.
The same principle applies to expanding volatility.
A high-volatility environment may produce stronger trends.
It can also produce violent reversals and larger stops.
The objective is not to label volatility as good or bad.
It is to understand how your specific crossover strategy behaves under different volatility conditions.
The Crossover Angle Matters
Another underused concept is the angle or slope of the crossover.
You do not need mathematical geometry.
Look at the direction of both averages.
A fast EMA crossing above a slow EMA while both are rising is different from a fast EMA crossing above a flat slow EMA.
Likewise, a bullish crossover while the slow average is still falling can represent a countertrend reaction rather than a genuine trend reversal.
This is particularly useful on lower timeframes.
A 5-minute bullish crossover inside a bearish 1-hour trend should be interpreted differently from a 5-minute bullish crossover aligned with the higher-timeframe direction.
This is where multi-timeframe context becomes valuable.
The Higher-Timeframe Filter
Suppose you trade a 5-minute crossover system.
Before taking a bullish crossover, check the 1-hour chart.
If the 1-hour structure is forming higher highs and higher lows, the bullish 5-minute crossover aligns with the broader direction.
If the 1-hour structure is making lower highs and lower lows, the same bullish crossover may be a temporary retracement.
Neither trade is automatically invalid.
But they represent different probabilities and different expectations.
A countertrend crossover should normally require stronger evidence than a trend-aligned crossover.
That is a useful rule because it creates an asymmetric standard.
You do not need to reject every countertrend signal.
You refuse to treat it as equivalent to a trend continuation signal.
The Failed Separation Test
A genuine trend often creates an increasing distance between the fast and slow averages.
A fake crossover frequently produces immediate compression.
For instance:
9 EMA crosses 21 EMA upwards
The trader arrives.
Rather than split, the two averages stay firmly squeezed.
The price is jumping between them.
This is a warning.
The crossover didn’t result in a continuous separation in direction.
You can track this systematically.
Measure the difference between the fast and slow averages after the crossover.
Then compare it with ATR.
For example:
MA Separation Ratio = Absolute Fast MA – Slow MA Difference ÷ ATR
You can then study whether your profitable crossovers tend to produce stronger separation than losing crossovers.
Again, the purpose is not to invent a magic number.
The purpose is to convert visual intuition into something you can test.
Why Adding More Indicators Often Makes the Problem Worse
Fake crossovers fool a trader.
They add in RSI.
Another bogus indication comes up.
They add the MACD.
Here’s another.
They add random.
Then the volume.
Then Bollinger Bands.
Eventually, the chart contains six indicators confirming one another.
But if all six indicators are derived from the same price data, they may not provide six independent pieces of information.
They may describe the same movement in different ways.
This creates the illusion of confirmation.
The better approach is to combine different types of information.
For example:
Moving-average relationship.
Market structure.
Volatility.
Location.
Liquidity.
That gives you a more diverse set of information than stacking multiple momentum indicators.
The Location Filter
A crossover has meaning partly because of where it occurs.
A bullish crossover near major demand can behave differently from one directly underneath resistance.
A bearish crossover near major supply can behave differently from one directly above support.
This is why the phrase “best fake crossover signal forex” is slightly misleading.
There is no single crossover setting that can identify every false signal.
The quality of the signal depends on the market regime and location.
The better question is:
“Under what conditions does my crossover have the highest probability of producing the movement I am trying to capture?”
That is a question you can actually test.
A Practical Fake Crossover Framework
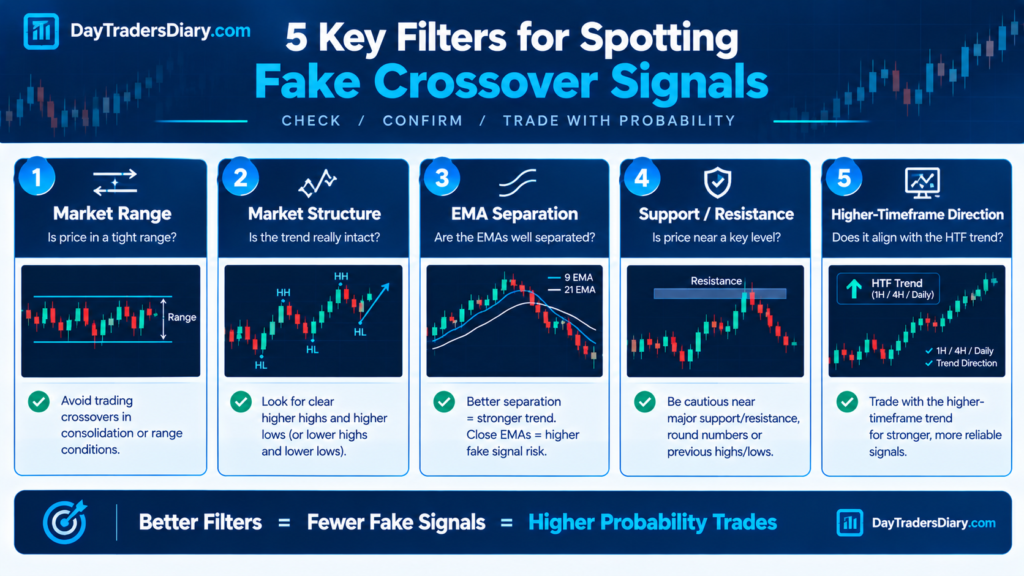
Before taking a crossover, run through five questions.
Question one: Is price trending or ranging?
If the market is clearly ranging, expect more crossover noise.
Question two: Did the price breach the relevant structure?
If not, consider the crossover provisional and not final.
Question three: Are the means separable?
If they quickly cross and compress, watch out.
Question four: Is there enough room for the next major level?
A signal directly into resistance may have poor trade economics.
Question five: Does the higher timeframe support the direction?
Alignment can improve the quality of a lower-timeframe signal, while conflict should demand stronger confirmation.
You do not need all five to be perfect.
But when four or five are working against you, taking the crossover simply because two lines crossed is usually a weak process.
A EUR/USD Example
Imagine EUR/USD has been ranging between 1.0820 and 1.0855.
The 9 EMA and 21 EMA have crossed three times during the session.
The latest bullish crossover occurs at 1.0847.
A trader buys.
Price reaches 1.0852.
Then reverses.
The trade loses.
The trader concludes:
9/21 crossover is unreliable.
But look a bit closer at the arrangement.
Market never left the range.
Averages flat.
The crossover occurred just below resistance.
There was no major structural break.
There was no strong separation.
The indicator did exactly what it normally does in a range.
The mistake was not the moving average.
The mistake was asking a trend-following signal to solve a range-bound market.
Now imagine a different day.
EUR/USD breaks above 1.0855 with a strong candle.
The 9 EMA crosses above the 21 EMA.
The averages begin to separate.
Price retests 1.0855.
The retest holds.
A higher low forms.
Price starts pushing toward the next resistance.
Now the crossover is part of a larger sequence.
That is the type of environment where a crossover becomes much more useful.
Risk Management Still Comes First
Even a filtered crossover will produce losing trades.
That is not the problem.
The problem is allowing a suspected false signal to become an oversized loss.
This is where position sizing matters.
Suppose your logical stop is 15 pips away.
You decide that you are willing to risk $100.
Your position size should be calculated from those numbers.
If volatility increases and your logical stop becomes 25 pips, the position size needs to change.
Do not keep the same lot size simply because the indicator setup looks identical.
The chart pattern may be similar.
The risk is not.
This is where most traders miscalculate risk. Using a position size calculator removes much of the guesswork and forces you to calculate size from the actual stop distance and intended account risk.
The important phrase is the actual stop distance.
Not the stop distance you wish you had.
Do Not Move the Stop Because the Crossover Looks Wrong
Another common error happens after entry.
The trader buys a bullish crossover.
Price starts to move against the position.
The trader increases the stop instead of admitting the setup failed.
The logic seems reasonable:
The trend just needs a little more room.
But the crossing had already failed on the initial trade plan.
Moving the stop does not make the signal more legal.
It changes the odds.
Better to define invalidation on entrance.
For instance:
The thesis is faulty if price closes down below the breakout level and if the fast EMA loses the slow EMA with bearish structure.
Now the exit is based on market information rather than discomfort.
Fake Crossovers and Position Size
A useful advanced technique is to reduce risk when the signal quality is lower rather than forcing every crossover into a full-size position.
Suppose your normal trend-aligned crossover qualifies for your standard risk.
A countertrend crossover against the higher timeframe might qualify for half risk.
A crossover inside a range might qualify for no trade.
This sets up a hierarchy.
You are not processing all signals as binary anymore.
You are matching exposure to level of evidence.
The exact percentages should be derived from your testing .
It’s the principle that counts.
Journal the Crossover Before You Journal the Result
Many traders record whether a trade won or lost.
That is not enough.
For crossover trades, record what the market looked like when the signal occurred.
Record whether the price was trending or ranging.
Record the higher-timeframe direction.
Record the slope of the fast and slow averages.
Record the distance between them.
Record whether there was a structure break.
Record the distance to the next major support or resistance level.
Record ATR.
Record the outcome in R.
Then record whether the averages are separated after entry.
This last field is especially useful.
You may discover that your best crossover trades are not simply the ones with the highest initial slope.
They may be the ones where separation expands quickly after entry.
Use Your Trade Journal to Find Your Personal False-Signal Pattern
Do not assume every trader gets the same false crossover signals.
One trader may lose mostly during the Asian session range.
Another may struggle around the New York Open.
Another may get trapped during the news.
Another may have excellent trend-day performance but repeatedly give back profits when the market transitions into consolidation.
Your Trade Journal Template can help isolate these patterns.
After 30 to 50 crossover trades, divide them by market condition.
Trend.
Range.
Breakout.
Post-news.
High volatility.
Low volatility.
Then compare the average R.
You may find that the strategy is not universally bad.
It may simply have a single environment in which its expectancy collapses.
That is an enormous difference.
You do not need to throw away a profitable system because it has one bad regime.
You need to identify the regime.
The Five-Trade Review Is Not Enough
Five losing crossover trades can feel like proof that your system is broken.
It is not.
Likewise, five winning trades do not prove that a new filter works.
You need a meaningful sample.
A practical review process is to analyze at least 30 trades after introducing a filter, then continue collecting data before making major conclusions.
Compare:
Raw crossover.
Crossover plus structure.
Crossover plus structure and higher-timeframe alignment.
Crossover plus structure, alignment, and volatility filter.
But be careful.
Adding too many filters can make historical results look excellent simply because you have overfit the past.
A filter should have a logical market explanation, not merely a beautiful backtest.
The Cost of Filtering Too Much
There is another side to this problem.
You can become so afraid of fake crossover signals that you filter out almost every trade.
Let’s say your original system has 100 signals.
Your new regulations cut this down to 12.
The win rate goes up.
You feel wiser.
But you may have also killed a lot of solid trades.
Your overall expectations may not improve.
This is why the goal is not maximum signal purity.
The goal is maximum useful expectancy after costs and execution.
A strategy can tolerate some false signals if the winners are large enough.
Trend-following systems often work this way.
You take your tiny losses and noise times. And the time to make up for that is with the rare sustained move.
Trying to eliminate all the false crossovers can ruin the fundamental asymmetry that makes the method work.
The Real Purpose of a Moving Average
A moving average is often most useful when it answers a question.
Is the price trading above or below its recent average?
Is short-term momentum stronger than longer-term momentum?
Is the trend accelerating or losing momentum?
Is the market transitioning from compression into directional movement?
Those are useful questions.
“Did the lines cross?” is a much weaker question.
The crossover should therefore be treated as an event inside the market, not the market itself.
A Professional Crossover Entry Model
A robust day-trading crossover process can be built in stages.
Start with the higher timeframe.
Determine whether the market is trending, ranging, or transitioning.
Move to the execution timeframe.
Wait for the fast and slow averages to stabilize before establishing the relationship you are looking for.
Then inspect the price structure.
Has the price broken a meaningful swing?
Has it escaped a range?
Is the breakout occurring into nearby resistance or support?
Then inspect volatility.
Is the market expanding, contracting, or unstable?
Then inspect the averages.
Are they sloping?
Are they separating?
Is the price excessively extended?
Only after those questions should the crossover become an entry trigger.
This sounds slower than simply buying when two lines cross.
It is.
That is the point.
You are exchanging some signal frequency for better information.
When You Should Ignore a Crossover
There are times when doing nothing is the correct course of action.
Ignore a bullish crossover when the price remains trapped inside a well-defined range, and the averages are flat.
Ignore a bearish crossover when the price is sitting directly above major support with little room to the downside.
Ignore a crossover when the move is already severely extended, and the remaining reward is poor.
Ignore it when the higher timeframe strongly contradicts the setup unless you have a specific countertrend model.
Ignore it when the signal appears immediately before a major scheduled event that can radically change market structure.
And ignore it when you cannot explain what would disprove the trade.
That final point is critical.
If you cannot define invalidation, you are not really trading a signal.
You are reacting to it.
Scaling and Capital Growth
A trader who can identify false crossovers consistently gains something more valuable than a higher win rate.
They gain control over unnecessary exposure.
That becomes increasingly important when trading larger capital.
A small amount of wasted risk is easy to overlook on a small account.
Repeated across hundreds of trades, it becomes a significant performance drag.
This is one reason evaluation-based proprietary trading programs can make sense for traders who already have a tested process but are constrained by personal capital.
The purpose should not be to use a funded account to compensate for weak strategy design.
The purpose is to bring a proven process into a larger capital framework while respecting the firm’s risk rules.
The5ers is one example of this model. Its current High Stakes program uses a two-step evaluation, with published limits including a 5% maximum daily loss and 10% maximum loss, alongside a 10% first-step target and a 5% second-step target. The firm also currently states that its High Stakes program allows positions to remain open over high-impact news but restricts new order execution around high-impact releases.
That matters to crossover traders because some false signals appear precisely during periods when execution conditions change.
If your strategy relies on opening positions immediately around major announcements, the account rules become part of your strategy design.
Other firms have different structures, drawdown rules, news policies, platforms, and evaluation conditions.
So the professional approach is not to ask which firm sounds most attractive.
Ask whether the firm’s rules are compatible with the strategy you have actually tested.
If you already have evidence that your crossover process survives different market regimes, an evaluation such as The5ers can be considered as a pathway to greater trading capital. But the evaluation should be viewed as an execution test, not a shortcut.
Capital does not fix a weak signal.
It magnifies whatever process you already have.
The Most Important Test for a Fake Crossover
There is one test I would encourage every crossover trader to add to their review.
After the trade is finished, remove the moving averages from the chart.
Then look at the price structure alone.
Ask:
“Would this have looked like a trend change without the crossover?”
If the answer is no, investigate the trade.
You may discover that you have been allowing the indicator to create the narrative rather than using the indicator to confirm the narrative.
Now do the opposite.
Look at the same trade with the moving averages visible, but hide the entry marker.
Ask:
Am I still thinking this is an extension of a trend?
This basic exercise reveals indication reliance remarkably rapidly.
The Crossover Failure Sequence
Fake crossovers often follow a recognizable sequence.
The price varies.
The quick average passes the sluggish average.
Price moves toward the crossing temporarily.
The averages start to converge.
The price back through the averages.
The crossover works the other way.
A second crossover appears.
The process repeats.
Once you recognize this sequence, the chart starts looking different.
Instead of seeing every crossover as a new opportunity, you start seeing the market’s inability to establish separation.
That is information.
Sometimes the most valuable signal from a moving-average system is not the crossover.
It is the repeated failure of crossovers.
Repeated failure tells you the market may not currently be suitable for a trend-following approach.
That can be more useful than another entry signal.
Frequently Asked Questions
What is a fake crossover signal in forex?
A fake crossover signal occurs when a fast-moving average crosses a slower-moving average, but the expected directional move fails to develop. Price often returns through the averages, producing a whipsaw.
How can I identify a fake moving-average crossover?
Don’t look at the crossing. Determine if the price is trending or range, if the market structure has altered, if the averages are sloping and separating, if there is room to the next support or resistance level, and if the higher timeframe corresponds with the direction.
What is the best fake crossover signal forex strategy?
There is no universal “best” filter. A practical approach is to combine the crossover with market structure, volatility, location, and higher-timeframe context, then test the combination on the specific market and timeframe you trade.
Should I wait for confirmation after a moving-average crossover?
Confirmation avoids some false signals, but also delays admission. Confirmation shouldn’t just be a certain amount of candles, but should actually affirm something, like a structure break or a successful retest.
Are EMA crossovers better than SMA crossovers?
Neither is automatically better for every strategy. EMAs react more swiftly to recent price fluctuations and SMAs smooth prices differently. More responsive may improve timing but may also increase the amount of short-term signals. Testing should provide you with the right choice.
Why do moving-average crossovers fail in sideways markets?
The price is bobbing up and down above and below the averages without any consistent directional shift. Then the averages keep switching places, causing whipsaws.
Can a moving-average crossover be used for day trading?
Yes. But the crossover should be part of a defined trading process that accounts for market regime, volatility, structure, transaction costs, entry timing, stop placement, and position size.
How many moving averages should I use?
There is no required number. Two averages can be enough to define a crossover relationship. Adding more averages does not automatically improve the signal and can make the chart harder to interpret.
Should I avoid every crossover against the higher timeframe?
Not necessarily. Countertrend trades can be valid when they belong to a specific tested strategy. They should not simply be treated as equivalent to trend-aligned setups.
How do I know whether my crossover strategy actually works?
Create a relevant sample of deals and split them by regime. Keep track of average R, win rate, average winner, average loser, drawdown, maximum favorable excursion, transaction costs, and the factors surrounding each crossing. Then compare performance for trending, ranging, high-volatility, and low-volatility conditions.
The Edge Is Not the Crossover
The biggest mistake is believing that the moving-average crossover creates the opportunity.
It does not.
The market creates the opportunity.
The crossover describes one aspect of what price is doing.
A strong crossover occurs when the market is already showing evidence of directional intent.
A weak crossover occurs when the indicator is trying to make sense of noise.
That is why the most useful question is not:
“Is this a bullish or bearish cross?”
It’s:
What evidence do we have that this crossover reflects a change in market behavior, and not just a momentary change in price location?
That question alters the way you read the chart.
You seek for structure first, then you look for indicators.
You can now measure volatility instead of guessing.
You don’t handle every crossing the same way now.
You learn to discern a new trend from a range movement.
And you become much less dependent on the indicator to tell you what the market is doing.
For your next 30 crossover trades, record one extra field in your journal: market regime at the moment of the signal.
Mark each trade as trending, ranging, transitioning, high-volatility, or low-volatility.
Then compare the results.
You may discover that your biggest problem is not finding better crossover settings.
It may be knowing when not to use the crossover at all.
To learn more, pair this paradigm with How To Avoid Head-Fake Breakouts to see that unsuccessful breakouts and false crossover signals typically indicate the same problem: price has yet to create enough structural commitment to support the trade.