
You spot a bullish trend on EUR/USD. Price is making higher highs and higher lows. You wait for a pullback, hoping to enter near the next support area.
Then the market drops sharply.
A small swing low forms.
Price bounces.
You buy.
A few candles later, the market breaks that swing low below and continues falling. Your stop is hit, and the trend you thought was intact suddenly looks much less convincing.
The frustrating part is that the swing low was real. Price did turn there.
What you missed was the difference between a temporary turning point and a pivot that actually matters to the current trend.
This is where fractal pivots become useful.
A fractal pivot can help you identify local swing highs and lows using a consistent price-based rule. But its real value is not the arrow that appears on your chart. Its value comes from how you interpret the pivot in relation to the surrounding trend, the strength of the pullback, and the price level that would invalidate your trade idea.
For an intraday trader, that difference can be the difference in how you get into a trend, where you put a stop and if a breakout catches your eye.
This tutorial presents a practical framework of exploiting fractal pivots in intraday trends, with emphasis on market structure, execution, risk management and performance review.
What Are Fractal Pivots in Trading?
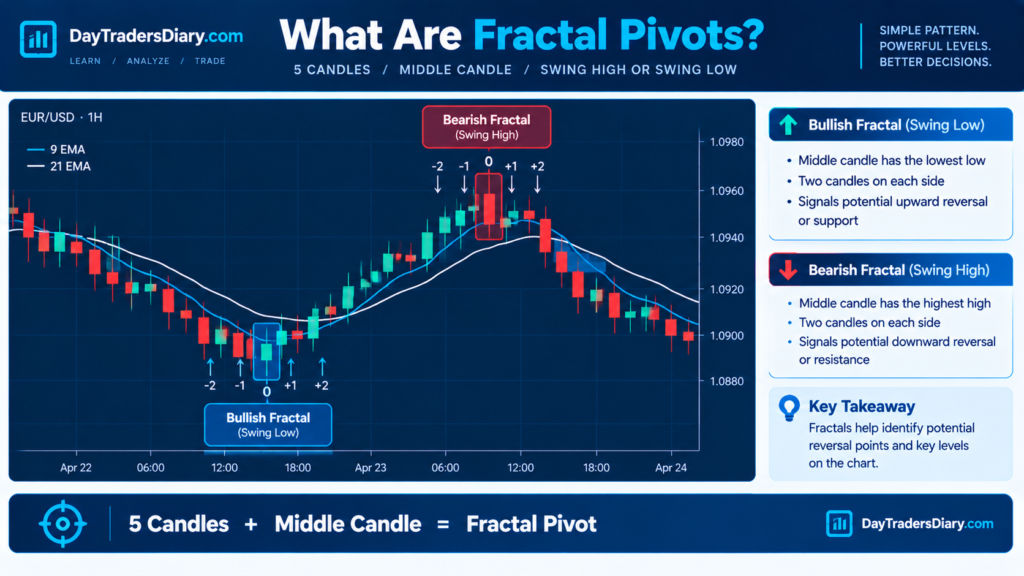
Fractal pivots are local price turning points identified through a fixed pattern of surrounding candles.
The most widely used version is the Williams Fractal, developed by trader and author Bill Williams.
A standard Williams Fractal uses five candles.
A bearish fractal, which marks a potential swing high, forms when the middle candle has a higher high than the two candles immediately before it and the two candles immediately after it.
A bullish fractal, which marks a potential swing low, forms when the middle candle has a lower low than the two candles immediately before it and the two candles immediately after it.
These patterns identify local extremes in price.
The important limitation is that a fractal is not confirmed until the two candles to the right of the central candle have formed. That means the indicator confirms a pivot with a delay.
This is not a defect. It is part of the definition.
The delay is the price you pay for identifying a turning point through a completed pattern rather than guessing where a swing might form.
For intraday traders, this makes fractals particularly useful for organizing market structure after a pivot has been confirmed.
They can help answer questions such as:
Where did the latest pullback stop?
Which swing high would the price need to break to establish a higher high?
Where is the latest confirmed lower low?
Has the market formed a new structural level, or is the price simply moving inside the previous range?
Those are more useful questions than asking whether a fractal arrow means buy or sell.
Fractal Pivots vs. Traditional Pivot Points
The terms can be confusing because traders use the word “pivot” in different ways.
Traditional pivot points are computed from the high, low and close of the previous session or period and create reference levels such as the central pivot, support and resistance.
Fractal pivots are different.
They are based on the shape of price movement around a local high or low.
Traditional pivot points provide calculated reference levels.
Fractal pivots identify completed local swing points.
For intraday trend trading, fractal pivots are particularly useful when you want to follow the sequence of higher highs, higher lows, lower highs, and lower lows as the session develops.
You can also use traditional pivot levels alongside fractal structure, but they answer different questions.
Why Fractal Pivots Matter in Intraday Trends
A trend is not simply a sequence of candles moving in one direction.
It is a sequence of price movements that creates a recognizable structure.
In an uptrend, buyers repeatedly manage to push prices to new highs, while pullbacks tend to stop above previous meaningful swing lows.
In a downtrend, sellers repeatedly push prices to new lows, while recoveries tend to fail below previous meaningful swing highs.
Fractal pivots help you identify those turning points without having to rely entirely on subjective visual judgment.
Consider an intraday uptrend.
Price moves from 1.0800 to 1.0840.
It pulls back to 1.0820.
Then it rises to 1.0860.
Another pullback forms near 1.0845.
The market then pushes to 1.0880.
A trader using fractal pivots can map the swing sequence and compare the latest confirmed low with the previous one.
The key question is not whether every low is a buying opportunity.
It is whether the structure of the trend remains intact.
That distinction helps prevent one of the most common intraday mistakes: buying every dip simply because the higher timeframe looks bullish.
The Research Behind Fractal Pivots
Fractal indicators are built on a mechanical method of locating local price extremes. According to the official MetaTrader documentation, the Williams Fractal is a pattern of five bars where the highest high or lowest low is in the middle of the pattern relative to the candles to its left and right.
That definition matters because it makes the pivot rule repeatable. Two traders using the same candle data and the same five-bar definition should identify the same completed fractal.
TradingView’s Williams Fractal documentation also highlights the confirmation delay. The two candles to the right of the central candle must form before the pivot is confirmed. This means a fractal indicator should not be treated as an instantaneous turning-point detector.
For active day traders, the practical implication is important: a confirmed pivot is evidence of a completed local price pattern, not proof that the market has reversed or that a trend will continue.
The broader concept of fractal market behavior is also associated with Benoit Mandelbrot’s work on financial-market scaling and the irregular nature of price movements. That research provides a wider perspective on why market movements can exhibit patterns across different scales. Still, it does not establish that a particular Williams Fractal trading strategy will be profitable.
The useful conclusion is to treat fractal pivots as a market-structure tool and test any entry or exit rules built around them.
The First Rule: Do Not Trade Every Fractal
This is where many traders misuse fractal indicators.
They see an upward-pointing arrow beneath a candle and immediately consider buying.
They see a downward-pointing arrow above a candle and consider selling.
That approach ignores the market environment.
A swing low inside a strong uptrend may represent a useful pullback.
A swing low inside a sideways range may be nothing more than a temporary fluctuation.
A swing low during a strong downtrend may be a pause before another leg lower.
The same fractal pattern can have very different implications depending on where it forms.
Instead of treating the fractal as an entry signal, use it as a reference point in a larger decision process.
First, identify the trend.
Then identify the relevant pivot.
Then assess whether the price is showing evidence of continuation, reversal, or consolidation.
Only after that should you consider an entry.
How to Identify an Intraday Trend Using Fractal Pivots
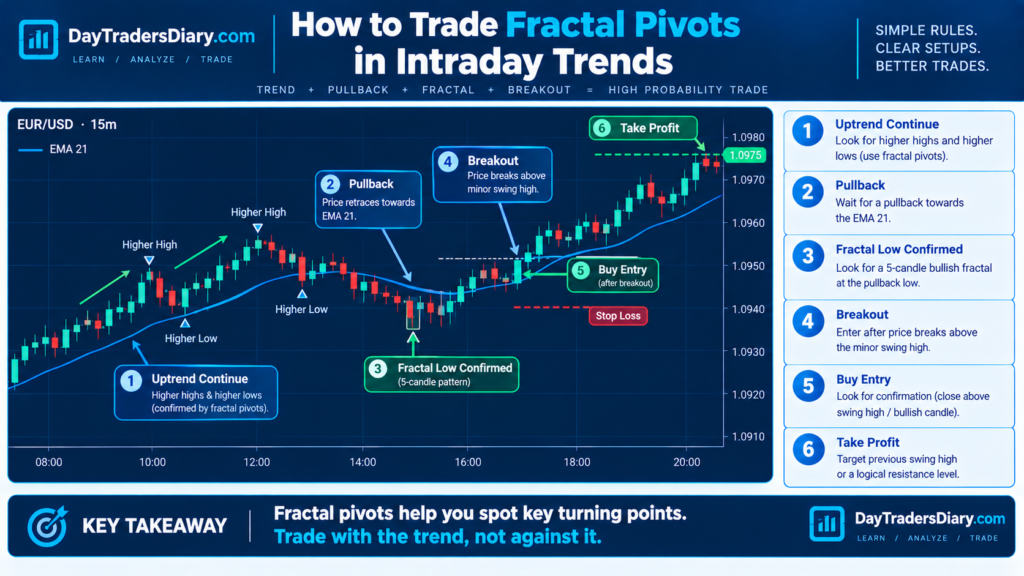
A practical way to read an intraday trend is to map the latest confirmed swing highs and swing lows.
For a bullish trend, look for a sequence in which meaningful swing highs rise, and meaningful swing lows also rise.
For a bearish trend, look for lower swing highs and lower swing lows.
The word “meaningful” matters.
Not every tiny fluctuation should redefine the trend.
A one-minute chart may generate many small pivots during a single five-minute candle. If you treat every one of them as equally important, your structure map becomes cluttered, and your decisions become inconsistent.
A better approach is to define which timeframe establishes the trend and which timeframe you use for execution.
For example, you might use the 15-minute chart to identify the broader intraday structure and the 3-minute or 5-minute chart to identify a pullback entry.
The higher timeframe provides the context.
The lower timeframe provides the timing.
This does not mean the higher timeframe is always correct. It means you have a clear hierarchy instead of allowing every small pivot to change your bias.
The Difference Between a Major Pivot and a Minor Pivot
One of the most valuable skills in fractal trading is separating major structural pivots from minor fluctuations.
Imagine a strong bullish move.
Price rises from 1.1000 to 1.1060.
It pulls back to 1.1030.
Then it rises to 1.1100.
During that move, the five-minute chart may produce several small fractals.
Some represent brief pauses.
Others represent the more important pullback that defines the structure of the trend.
If you treat every small low as the critical support level, you may exit too early or misinterpret normal volatility as a trend reversal.
A useful distinction is to classify pivots according to their role.
A major structural pivot is a swing that helps define the larger trend or the level that, if failed, would materially impact your market interpretation.
The minor execution pivot is a little swing that aids you in timing an entry, managing a position or refining a stop in relation to the broader structure.
This distinction gives you two levels of information.
The major pivot tells you whether the trend remains structurally intact.
The minor pivot helps you manage the trade.
A Step-by-Step Fractal Pivot Trading Framework
Step 1: Establish the Intraday Direction
Start with a time frame that reflects the structure of the session.
If you are trading EUR/USD on a 5-minute chart, looking at the 15 or 30-minute chart is a good first step.
Look at the latest confirmed swing highs and lows.
If the market is producing higher highs and higher lows, classify the structure as bullish.
If it is producing lower highs and lower lows, classify it as bearish.
If the swing sequence is overlapping and repeatedly breaking down, classify it as ranging or transitioning.
Do not force a directional bias when the structure does not support one.
This first step prevents you from using every newly confirmed fractal as a reason to change direction.
Step 2: Mark the Latest Meaningful Pivot
Once you have identified the pattern, mark the final important swing point that verifies the trend.
This is typically the last higher low known in an upswing.
It’s usually the last confirmed lower high in a downtrend.
This pivot becomes a reference for assessing whether the current movement is a normal pullback or a potential structural failure.
Do not automatically place an order at the pivot.
The pivot is a reference level, not a guarantee that the price will react there again.
Step 3: Wait for Price to Pull Back
In a bull trend, let the price retrace to a relevant support point.
That zone is the last swing high, previous breakout zone, demand zone or moving average that your method is already using.
In a bearish trend, look for a recovery toward resistance or a former breakdown level.
The purpose is not to predict the exact turning point.
It is to avoid chasing price after an extended move.
A pullback gives you a chance to assess whether the trend is still attracting buyers or sellers at a reasonable location.
Step 4: Watch for a New Fractal Pivot
As the pullback develops, a new fractal may form.
In a bullish setup, you may see a confirmed swing low.
In a bearish setup, you may see a confirmed swing high.
But do not enter simply because the fractal appears.
Ask whether the new pivot makes sense within the larger structure.
In a bullish trend, does the new low remain above the previous meaningful low?
In a bearish trend, does the new high remain below the previous meaningful high?
If so, the trend structure may still be intact.
Otherwise, the market could be changing.
Step 5: Require Evidence of Continuation
After the pullback pivot forms, look for evidence that the price is attempting to resume the original direction.
For a bullish trade, that might mean the price breaks a nearby lower-timeframe swing high.
For a bearish trade, it might mean the price breaks a nearby swing low.
This creates a sequence:
Trend established.
Pullback develops.
Fractal pivot confirms a local turning point.
Price breaks a relevant execution-level swing.
Entry becomes eligible.
This is different from buying at the first fractal low.
You are waiting for the market to demonstrate that the pullback may be ending.
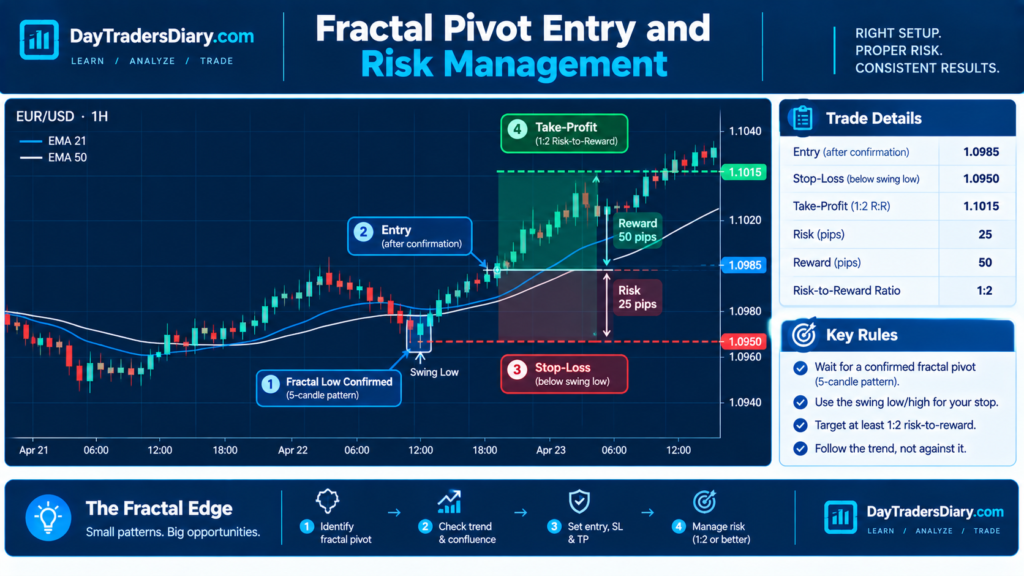
Step 6: Define Invalidation Before Entry
Before entering, identify the level that would invalidate the configuration.
For a positive pullback trade below the new swing low, or below the broader structural bottom, depending on the method.
For a bearish pullback trade, it may be above the newly formed swing high or above the larger structural high.
The correct stop depends on the trade thesis.
A stop that sits below a tiny execution pivot may be too tight for a trade that depends on the broader structure.
A stop placed beyond a major structural pivot may create too much risk for a small intraday target.
The stop must fit the setup you are actually trading.
Step 7: Calculate Whether the Trade Is Worth Taking
Once the entry, stop, and target are defined, calculate the reward-to-risk ratio.
A structurally attractive setup can still be a poor trade if the next major resistance level is too close.
For example, a bullish fractal forms after a pullback, and the price breaks the latest minor swing high.
But a major session high is only a few pips away.
The trade may have little room to develop.
This is where fractal structure and trade economics must work together.
The pivot tells you where the market turned.
It does not tell you whether the remaining opportunity is worth the risk.
A Fractal Pivot Intraday Example: EUR/USD Bullish Trend
Consider EUR/USD trading on a five-minute chart.
The market begins the session near 1.0800.
Price rises to 1.0840, pulls back to 1.0820, and then moves higher to 1.0860.
A confirmed fractal low forms near 1.0820.
The sequence of higher highs and higher lows suggests a bullish intraday structure.
Price then pulls back from 1.0860 toward 1.0845.
A new confirmed fractal low forms around 1.0845.
The trader now has a potential higher low.
But rather than buying immediately at 1.0845, the trader waits for the price to break the latest minor swing high near 1.0855.
Price pushes above that level.
The trader considers a long entry around 1.0857.
The stop is placed below the new pullback low at 1.0842, assuming that level is the logical invalidation point for the setup.
The first risk is 15 pips.
The next substantial resistance is seen near 1.0890 for some 33 pips of possible reward.
That yields a possible reward: risk ratio of about 2.2:1 before trading charges.
The trade is not guaranteed to work.
But it has a definite framework.
The higher timeframe set the bullish context.
The fractal highlighted the low in the pullback.
The minor swing break was indicative of continuation.
The stop came because of the setup invalidation.
The target was based on the remaining price opportunity.
That is a more complete process than buying whenever a bullish fractal appears.
A Bearish Example: GBP/USD Lower-High Continuation
Now consider GBP/USD in a bearish intraday trend.
Price falls from 1.2750 to 1.2700.
It then recovers to 1.2725.
A confirmed fractal high forms near 1.2725.
Price declines again, breaking below 1.2700 and extending to 1.2675.
The market then begins another recovery.
Instead of selling immediately, the trader watches whether the recovery forms a lower high.
A new confirmed fractal high develops near 1.2695.
The trader now has a potential lower high.
Price then breaks a nearby minor swing low around 1.2685.
That break provides evidence that sellers may be regaining control.
The trader considers a short entry, with the stop placed above the relevant pullback high and the target based on the next support area.
The important point is that the fractal high is not the sell signal by itself.
The lower-high structure and subsequent downside break create the trade idea.
How to Use Fractal Pivots for Breakout Confirmation
Fractal pivots are also useful when the price breaks out of a range.
Suppose EUR/USD has been trading between 1.0900 and 1.0930.
A bullish breakout pushes the price above 1.0930.
The initial move may look convincing, but the trader does not know whether the market will hold above the range.
Price pulls back toward 1.0930.
A confirmed fractal low forms just above the former resistance.
Price then pushes higher and breaks a nearby minor swing high.
That sequence provides evidence that the former resistance may be acting as support.
The fractal pivot helps you identify where the retest stopped.
The subsequent price action helps you judge whether the breakout is being accepted.
This can be especially useful when studying how to avoid head-fake breakouts.
A breakout that immediately falls back into the range is different from one that holds above the boundary and forms a higher low.
The fractal does not predict which outcome will occur.
It helps you organize the evidence as the market develops.
The Fractal Pivot Retest Strategy
A retest strategy can be built around a confirmed fractal pivot.
In a bullish trend, the price breaks above a meaningful swing high.
You wait for a pullback.
A fractal low forms near the breakout level.
You then wait for the price to reclaim a minor swing high.
The entry is considered only after the continuation condition is met.
The bearish version works in reverse.
Price breaks below a meaningful swing low.
A recovery develops.
A fractal hill forms near the broken level.
Price then breaks a minor swing low.
The entry becomes eligible.
The main advantage of this method is that it separates three decisions that traders often combine.
The breakout identifies the structural event.
The fractal identifies the pullback’s local extreme.
The subsequent break provides a potential continuation trigger.
The main disadvantage is the delay.
By the time the fractal is confirmed and the continuation trigger occurs, the price may have moved significantly.
That is why you should calculate the remaining reward before entering.
The Hidden Problem: Fractal Confirmation Lag
A Williams Fractal requires two candles after the central candle to confirm the pivot.
On a five-minute chart, that means the pivot is confirmed only after two additional five-minute candles have completed.
The actual time between the pivot’s formation and confirmation may vary depending on when the central candle occurred.
This delay matters.
Imagine a strong bullish move that produces a pullback low.
The market immediately rebounds.
By the time the fractal confirms, the price may already be several pips above the low.
If you enter immediately after confirmation, you may be buying after a meaningful portion of the rebound has already occurred.
This is not a reason to abandon fractals.
It is a reason to distinguish between pivot identification and entry timing.
A confirmed pivot tells you where the local extreme occurred.
It does not tell you that the current price is still attractive.
This is closely related to the broader problem of entry delay risk.
If confirmation pushes your actual entry too far from the logical stop, the setup may no longer offer the same reward-to-risk profile.
How to Avoid Late Entries With Fractal Pivots
A common mistake is waiting for a confirmed fractal, then entering the market without reassessing the trade.
The trader remembers the attractive price near the swing low.
But the actual entry is much higher.
The stop remains below the original pivot.
The risk has increased.
The remaining target has shrunk.
The trader is now trading a different setup from the one originally imagined.
A better approach is to calculate the trade only after the confirmation condition occurs.
Ask whether the actual entry still provides an acceptable reward relative to the logical stop.
If it does, the trade may remain valid.
If it does not, wait for a new pullback or skip the trade.
This is where your understanding of how to measure entry delay risk in forex becomes useful.
Fractal confirmation can improve structure clarity, but it can also create execution delay.
You need to account for both.
Fractal Pivots and Market Structure Breaks
A market structure break occurs when the price moves beyond a meaningful prior swing level.
Fractal pivots can help identify the swing levels used in that analysis.
For example, in a bullish trend, the latest confirmed fractal high may serve as a reference for a potential higher-high break.
If the price moves above that high, it may indicate continuation.
But not every fractal high is structurally important.
A tiny swing high inside a narrow consolidation may have little significance.
This is why the trader must distinguish between local price movement and meaningful structural change.
A break of a minor fractal can be useful for execution.
A break of a major fractal may be more relevant to the broader trend.
The two should not be confused.
Fractal Pivots and Liquidity
Fractal highs and lows can also help traders map areas where stop orders may cluster.
A clearly visible swing high may attract buy-stop orders above it.
A clearly visible swing low may attract sell-stop orders below it.
When price approaches these levels, traders often watch for either a breakout or a failed break.
But a fractal pivot is not actually showing the order book, or actually proving there is liquidity at that price.
It just gives a visual point of reference for market participants to watch for.
This distinction matters because traders sometimes treat every fractal high as a guaranteed liquidity target.
That is too simplistic.
A better approach is to observe how the price behaves around the level.
Does it break and hold?
Does it sweep the level and quickly reverse?
Does it consolidate below the resistance?
Does it form a new swing after the breakout?
The reaction provides more information than the level alone.
Using Fractal Pivots With Moving Averages
Fractal pivots can complement moving averages because the two tools describe different aspects of price behavior.
The moving average is a summary of recent prices.
A fractal is a local extremum of a swing.
Assuming the 20 EMA is going up.
Price retraces to the average.
Above the last important swing low, a fractal low is verified.
Price breaks the small swing high.
This combination could provide a trend-continuation setup.
But the moving average should not overrule the structure.
If the 20 EMA is increasing but the price is breaking major swing lows frequently, the market might be in transition.
Likewise, a fractal pivot that forms directly against a strong trend does not automatically justify a reversal trade.
The best use of these tools is complementary.
Use the moving average to understand the broader directional environment.
Use fractal pivots to identify local structure.
Use price action to decide whether the setup has actually developed.
Using Fractal Pivots With RSI or MACD
Momentum indicators can provide additional context, but they should not become a substitute for structure.
For example, a bullish fractal low forms during a pullback.
RSI begins recovering from a lower reading.
Price then breaks a nearby swing high.
This may suggest that momentum is recovering alongside the structural setup.
However, RSI can remain elevated during a strong uptrend and depressed during a strong downtrend.
MACD can also lag because it is derived from moving averages.
Adding either indicator does not eliminate the possibility of a failed pivot.
The key question is whether the additional tool provides information that is genuinely different from what the fractal and price structure already show.
If it merely repeats the same message, it may add complexity without improving the decision.
Fractal Pivots During High-Volatility Sessions
Fractal pivots can respond differently when the intraday volatility expands.
In a massive news release or fast-starting session, candles can become larger, and swing points can form quickly.
A pivot that appears meaningful on a quiet session may be insignificant during a volatile session.
This is why fixed pip-based stop distances can become unreliable across different market conditions.
A more adaptable approach is to compare the distance between the entry and the invalidation level with current volatility.
For example, a 10-pip stop may be reasonable in a quiet EUR/USD session but too tight during a high-volatility release.
The fractal still identifies the local swing.
The market’s volatility determines how much room that swing may require.
This is also why traders should be careful when comparing fractal strategies across different currency pairs and timeframes.
A setup that works on EUR/USD during a relatively calm London session may behave differently on GBP/JPY during a volatile U.S. session.
Risk Management: Let the Pivot Define the Trade, Not the Position Size
One of the most common execution mistakes is choosing a position size first and then forcing the stop to fit.
With fractal trading, the stop should be based on the structure that invalidates the setup.
For a bullish continuation trade, that may be below the relevant pullback low.
For a bearish continuation trade, it may be above the relevant pullback high.
Once the stop is defined, calculate the position size based on the amount of account risk you are willing to accept.
Suppose your account risk budget is $100.
Your logical stop is 20 pips away.
Your position size should be calculated using the actual stop distance, instrument value, and account currency.
If the next setup has a 35-pip stop, the position size should change accordingly.
This is where a Position Size Calculator becomes useful.
It helps convert the structural stop into a position size that matches your risk budget.
But remember that a calculator cannot make a poor setup attractive.
If the fractal entry occurs too far from the logical stop or too close to the next major level, the trade may not qualify regardless of how small the position becomes.
Stop Placement: Major Pivot or Minor Pivot?
This is a decision that deserves more attention than it usually receives.
A trader may identify a bullish continuation setup using a 15-minute trend and a five-minute fractal pivot.
Should the stop go below the five-minute pivot or below the larger 15-minute swing low?
There is no universal answer.
If the trade depends on the five-minute continuation pattern, a stop below the local pullback low may be consistent with the setup.
If the trade depends on the broader trend structure, the larger swing low may be the relevant invalidation point.
The problem occurs when the trader uses a small stop but expects the trade to survive a much larger structural pullback.
That creates a mismatch between the trade thesis and the stop.
Before entering, identify which level actually invalidates the idea you are trading.
Then size the position accordingly.
How to Journal Fractal Pivot Trades
A fractal strategy should be evaluated by more than its win rate.
A trader may have a high win rate because they take profits quickly, while their losing trades extend far beyond the average winner.
Another trader may have a lower win rate but capture larger trend movements.
The performance difference becomes visible only when you record the right information.
For each fractal trade, record the instrument, session, execution timeframe, higher-timeframe direction, type of pivot, entry price, stop distance, target, and final result in R.
Also, record whether the pivot was a major structural swing or a minor execution swing.
That field is particularly useful.
You may discover that major structural pivots produce fewer but more meaningful setups, while minor pivots produce more signals but greater exposure to noise.
You should also record whether the entry occurred immediately after fractal confirmation or after a subsequent structure break.
This helps you determine whether waiting for continuation confirmation improves trade quality enough to justify the additional entry delay.
A Trade Journal Template can help you capture these fields consistently instead of relying on memory after the session.
Measure the Performance of Each Fractal Setup Type
Do not combine every fractal trade into one performance category.
Separate bullish pullback continuations from bearish pullback continuations.
Separate breakout retests from countertrend reversal attempts.
Separate major pivots from minor pivots.
Then compare the results.
Look at average R, average winner, average loser, maximum favorable excursion, maximum adverse excursion, and drawdown.
A useful question is whether the best-performing trades share a particular structural condition.
Perhaps bullish trades perform better when the pullback holds above a previous swing high.
Perhaps bearish trades perform better after a lower-high formation and a fresh downside break.
Perhaps countertrend fractals perform poorly unless a major structural level has been broken.
Those findings can help you refine the strategy without adding unnecessary indicators.
Avoid Overfitting Your Fractal Settings
Many trading platforms allow traders to modify fractal sensitivity or use custom pivot indicators.
It can be tempting to adjust the settings until the historical chart looks perfect.
But a setting that identifies every small swing may produce too many signals.
A setting that requires larger swings may confirm pivots so late that the entry becomes unattractive.
The correct setting depends on the purpose of the tool.
If you use fractals to map broader intraday structure, a slower or higher-timeframe approach may be appropriate.
If you use them for precise execution, a faster timeframe may be more useful.
But you should test the trade-off between signal frequency, confirmation delay, stop distance, and average R.
A more sensitive indicator is not automatically better.
A slower indicator is not automatically more reliable.
The question is whether the resulting trade process performs consistently under the market conditions you actually trade.
Scaling and Capital Growth
Once a trader has a tested intraday process, capital becomes a separate consideration.
The amount of personal capital available may constrain a strategy that performs consistently on a small account.
Evaluation-based proprietary trading programs can provide one possible route to accessing a larger nominal trading account, but they introduce their own rules and constraints.
That makes execution discipline particularly important for a fractal-based strategy.
A trader who repeatedly enters after the pivot has already moved too far, uses inconsistent stop placement, or risks too much on minor swings may struggle to maintain a stable process under a firm’s drawdown limits.
The5ers is one example of an evaluation-based funding provider. Its High Stakes program currently uses a two-step evaluation, with published maximum daily loss and overall loss limits, and restrictions on opening orders around high-impact news. Other firms, including FTMO and FundingPips, use their own evaluation structures and trading rules.
The proper choice relies on what the strategy requires to execute, what instruments are allowed, what the drawdown rules are, and whether the trader can stick to those limits.
If a trader has a fractal method that has shown consistent success throughout many sessions and market regimes, then a The5ers evaluation account could be a logical next step to gain access to larger trading cash.
The important point is that capital should follow a proven process.
An evaluation account will not fix a weak entry model, and larger nominal capital does not automatically translate into higher personal income.
Before choosing any program, review the firm’s current terms and confirm that your strategy is compatible with its rules.
When Fractal Pivots Work Best
Fractal pivots are most useful when the market is producing recognizable swing structure.
They can aid in structuring pullbacks in a well-established trend, in identifying local turning points surrounding breakout retests, and in defining structural reference levels for risk management.
They are less instructive when the price is moving laterally with frequent overlapping swings.
They can also become difficult to use during rapid volatility expansion, when the market forms large candles and the confirmation delay becomes costly.
The objective is not to find a market condition where fractals never fail.
It is to identify the conditions in which their information is useful enough to justify a trade.
Common Fractal Pivot Trading Mistakes
One mistake is treating every confirmed fractal as a buy or sell signal.
Another is to mistake a small movement for a large structural shift.
A third is entering right after confirmation and without recalculating the remaining reward-to-risk ratio.
Some traders additionally set stops at arbitrary distances rather than at the level that invalidates the setup.
Others use too many timeframes and allow every new pivot to change their directional bias.
The common problem behind these mistakes is the same: the trader is treating the indicator as a complete trading system.
The fractal pivot is merely one component of the choice.
But the trend, market structure, entry timing, invalidation level and possible reward remain important.
Frequently Asked Questions
What is a fractal pivot in intraday trading?
A fractal pivot is a local swing high or low, defined by a pattern of bars on either side. The conventional Williams Fractal employs five candles, where the middle candle is the highest high or lowest low of the two candles on either side.
How do you use fractal pivots in an intraday trend?
Find a bigger trend. Find the latest noteworthy swing. Wait for a pullback. Use a proven fractal to determine the local turning point. Then seek indicators of continuation, such as a nearby swing level break, before considering an entry.
Are fractal pivots good for scalping?
They can be utilized in scalping; however, the lag time to confirmation can be severe on extremely short time frames. The trader needs to consider the spread, execution costs, volatility and distance between the pivot and the real entry point.
What is the difference between a fractal pivot and a traditional pivot point?
A fractal pivot is a local high or low point, relative to the surrounding candles. A classic pivot point is computed using the preceding period’s price data and is utilized as a reference level for potential support and resistance.
Do fractal pivots repaint?
The typical Williams Fractal requires 2 candles to the right of the middle candle to confirm. That temporary pivot may not qualify until those candlesticks form. If a regular fractal is proven, the whole historical pivot should be fixed. Custom indicators might have alternative rules.
Can fractal pivots identify trend reversals?
They can help identify local turning points to incorporate into a reversal structure. But a fractal doesn’t mean a trend reversal. Further evidence is a major break in structure & follow through.
Which timeframe is best for fractal pivots?
There’s no best time window. A larger time frame can allow you to see the bigger structural swings, and a lower time frame can provide you with more exact points of execution. The instrument, session, and plan determine the correct blend.
Where should you place a stop-loss when trading fractal pivots?
The stop should be placed beyond the level that invalidates the specific setup. For a bullish pullback, that may be below the relevant swing low. For a bearish pullback, it may be above the relevant swing high. The position size should then be calculated from the actual stop distance.
Can fractal pivots be combined with moving averages?
Yes. Moving averages can help depict the overall directional environment, while fractal pivots help highlight local swing structure. The combination should be examined to see if it performs better after transaction expenses.
What is a fractal market geometry indicator?
The term can also be applied to methods based on the use of fractal ideas to detect repeating pricing patterns or local turning points. The Williams Fractal is a common example of a fractal-based indicator, but do not confuse it with a promise that market values would recur in a predictable geometric form.
The Real Edge Is in the Structure Behind the Pivot
A fractal arrow can tell you where a local price extreme has formed.
It cannot tell you whether that extreme is important to the current trend.
That judgment comes from understanding the surrounding structure.
Is the market making higher highs and higher lows?
Did the prior meaningful swing hold the pullback?
Has the price broken a threshold that would support continuation?
Is the real entry still attractive after confirmation?
And where would the trade idea become invalid?
Those are the questions that turn fractal pivots from chart decorations into useful trading references.
For your next 30 intraday trades, record whether each fractal was a major structural pivot or a minor execution pivot. Then compare the average R and drawdown of each group.
You may discover that your edge does not come from finding more fractals.
It comes from learning which pivots deserve your attention.
For your next read, connect this framework with How To Avoid Head-Fake Breakouts and study how a failed break of a fractal swing can reveal the difference between genuine trend continuation and a temporary price move.