
A lot of day traders have the right setup but the wrong candle.
The level is good. The market structure is clean. The liquidity sweep looks obvious. The higher-timeframe bias makes sense. Then the trader enters on a candle that barely has enough participation to support the trade.
Price moves a few ticks in the expected direction, stalls, spreads widen, and the next push takes the stop.
Later, the same setup appears again during a genuinely active period. This time price moves immediately.
The difference was not always the setup.
It was the quality of the trading environment when the entry was triggered.
This is why I have become increasingly interested in a simple question when reviewing intraday trades:
Was there enough real market participation behind the candle I used for entry?
That question is more useful than simply asking whether a candle was large, green, bearish, engulfing, or accompanied by a volume spike.
A high-volume candle is not automatically a high-liquidity candle.
A large candle can actually appear because liquidity disappeared.
And that distinction matters.
If your strategy depends on liquidity sweeps, breakout confirmations, displacement candles, market structure shifts, order blocks or short-term momentum, the candle you use for execution can determine whether the setup behaves as expected.
The objective of a high liquidity candle entry strategy is therefore not to trade only large candles.
It is to filter entries so that you participate when the market has enough activity, depth and immediacy for your particular setup to have a reasonable chance of developing.
This article explains how to build that filter, how to test it, where it fails, and how to turn the idea into something you can actually use in a trading plan.
What Does “High Liquidity Candle” Actually Mean?
There is an important terminology problem here.
A candle itself is not a market.
Liquidity exists in the underlying market and changes over time.
A candle is simply the visual record of transactions that occurred during a particular interval.
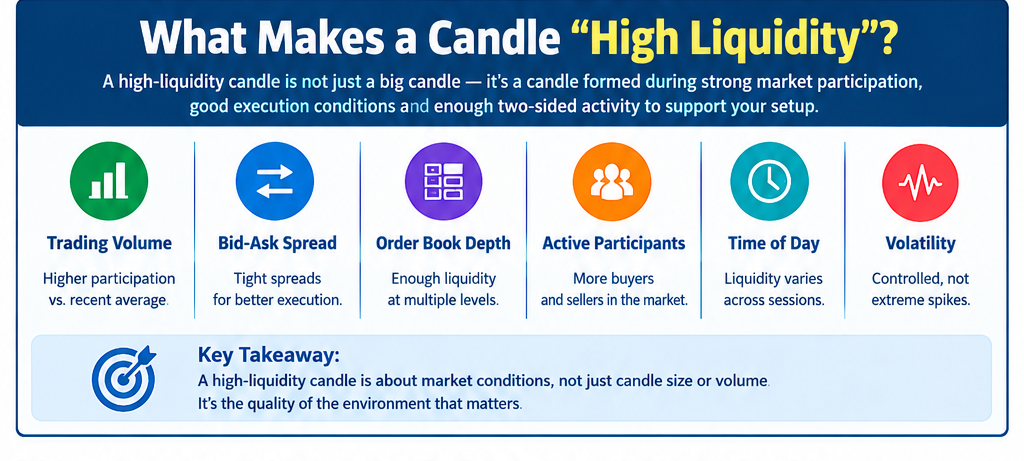
So when traders say, “I want to enter only on high-liquidity candles,” they usually mean they want entries to occur during periods when the market is showing stronger participation, better execution conditions and enough two-sided activity to support their strategy.
That can involve several variables.
Trading volume is one.
Bid-ask spread is another.
Order-book depth can matter.
The number of active participants matters.
Time of day matters.
Volatility matters.
The relationship between volume and price movement matters.
This is why a candle with 50,000 contracts traded cannot automatically be classified as more liquid than another candle with 30,000 contracts.
The first candle may have experienced an enormous burst of volatility while liquidity was temporarily being consumed.
The second may have developed inside a deeper, more orderly market.
CME Group’s liquidity research specifically separates concepts such as bid-ask spread, book depth and cost to trade when evaluating market liquidity. Its liquidity tools allow traders to examine these measures across different products and trading periods.
For the day trader, that leads to a much more useful definition:
A high-liquidity candle is a candle occurring during a market condition where participation and execution quality are sufficiently strong for your strategy and position size.
That definition gives you something you can actually test.
Why High Volume and High Liquidity Are Not the Same Thing
This is probably the most important concept in the entire article.
Imagine gold is trading normally.
You see a 15-minute candle with moderate volume and a relatively narrow range.
Now imagine a major economic announcement hits.
Gold suddenly moves $20 in a few seconds.
The resulting candle has enormous volume.
It also has enormous range.
Many traders will look at the volume and say:
“Liquidity is extremely high.”
That conclusion may be wrong.
The market can have a tremendous amount of trading activity while execution becomes more difficult.
Spreads can change.
Slippage can increase.
Orders can be consumed rapidly.
Price can jump between levels.
The visible volume tells you that transactions occurred.
It does not tell you that you could have entered and exited at the price you expected.
CME describes liquidity through factors such as tight bid-offer spreads, available market depth and the ability to transact at reasonable prices. It also notes that liquidity is connected to both the supply and demand for immediacy.
This difference affects my building of the entrance filter.
Why not state:
You have to be loud to get in.
I would say:
Is participation enough, and is the price indication that the market can absorb my order with no more than excess execution friction?
That is a much stronger filter.
The Three Layers of a High-Liquidity Entry Filter
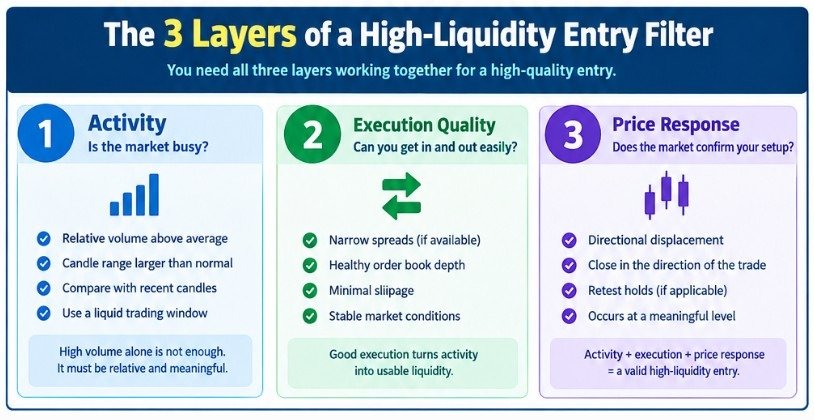
A useful framework is to divide liquidity into three layers.
The first layer is activity.
The second is execution quality.
The third is price response.
Activity tells you whether the market is busy.
Execution quality tells you whether that activity is translating into usable trading conditions.
Price response tells you whether the activity is actually supporting your setup.
You need all three of them.
A volume spike without good execution can be disastrous.
A tight spread and not enough directional involvement might create a dead market.
A large displacement candle without follow-through can be a sign of tiredness, not strength.
The best entries occur when these variables align.
Layer One: Measure Activity Relative to Normal
Relative volume is the simplest place to start.
Absolute volume is sometimes a misnomer, as different instruments and different times of the day will naturally create varied levels of volume.
Instead, compare the current candle with candles from a comparable period.
For example, if you trade a 5-minute chart, you might compare the current 5-minute volume with the average volume of the previous 20 candles.
A basic relative volume measurement is
Relative Volume = Current Candle Volume / Average Volume
Evidence of elevated involvement is there if the current candle trades 2.0x the recent average.
But do not immediately turn that into an entry signal.
Relative volume is a filter.
It is not a direction indicator.
A 2.0 relative-volume candle can be the beginning of a trend.
It can also be the final burst before reversal.
The next question is what price did with that activity.
The Candle’s Range Matters Too
Volume without range can tell a very different story from volume with substantial range.
Suppose two candles each trade twice the recent average volume.
Candle A moves only 0.15%.
Candle B moves 0.70%.
The market is behaving differently in each case.
Candle A may indicate absorption, two-sided activity or heavy trading inside a narrow range.
Candle B indicates that a larger amount of price movement occurred while participation was elevated.
Neither is automatically bullish or bearish.
But they represent different environments.
One useful metric is volume relative to candle range.
You can think of this as asking:
How much price movement did the market produce for the amount of activity occurring?
When volume rises sharply but price barely moves, you may be looking at absorption or competition.
When volume rises with controlled directional expansion, the market may be transitioning into a more directional state.
When volume explodes and the candle becomes abnormally large, you need to consider whether the market has entered an unstable volatility regime.
This is where blindly requiring “big volume” becomes dangerous.
Layer Two: Look at Execution Quality
For traders using liquid futures, the actual order book can provide more direct information.
CME’s Liquidity Tool measures bid-ask spreads, book depth and cost to trade across products and time zones. Its methodology uses order-book information including bid and ask prices, order quantities and multiple levels of depth.
That matters because the same volume can occur under very different execution conditions.
If the spread is narrow and depth is healthy, a market order may have relatively low friction.
If the spread suddenly widens and depth disappears, your chart may still show a beautiful setup, but the actual trading environment has deteriorated.
This is one reason professional execution analysis cannot be reduced to candle patterns.
The chart tells you what happened.
The order book can help explain how easy or difficult it was to transact while it happened.
Retail traders often do not have the same level of market-depth information across every instrument.
That is fine.
You can still construct a useful proxy.
Watch spread behavior where available.
Track slippage.
Day time tracker.
Normal v. volume track.
Track your actual fills and see how they deviate materially from your projected entries.
Your own execution data can be a practical indicator of liquidity.
Layer Three: Let Price Confirm the Activity
This is where the strategy becomes interesting.
You do not want to buy a candle simply because it is liquid.
You want to enter because the market is liquid and your setup is occurring inside that active environment.
Imagine EUR/USD has been trading below a morning high.
Price sweeps the high.
It immediately rejects.
Then a bearish displacement candle forms with above-average activity.
That candle is interesting.
Now imagine the same liquidity sweep occurs during a period of extremely low activity.
The rejection candle is tiny.
Price barely moves.
There is no meaningful displacement.
The setup may still work, but you have less evidence.
The difference is not that one candle is green and another is red.
It is that one event produced meaningful price response while participation was elevated.
That combination is much more informative.
How to Build a High Liquidity Candle Entry Rule
Here is a practical framework you can test.
Start with your existing setup.
Do not change the strategy yet.
Suppose your setup is a liquidity sweep followed by a market structure shift.
Normally, you might enter when the structure shift occurs.
Now add the liquidity filter.
The entry is valid only when the structure-shift candle meets your predefined activity threshold.
For example:
The candle’s volume must be above its 20-candle average.
Its range must be at least a certain percentage of recent average range.
The candle must close in the direction of the intended trade.
The move must occur during your predefined liquid trading window.
And your execution conditions must remain normal.
Notice what this does.
It does not predict the market.
It removes certain environments from your strategy.
That is a much easier problem to test.
Example: Liquidity Sweep on a 5-Minute Chart
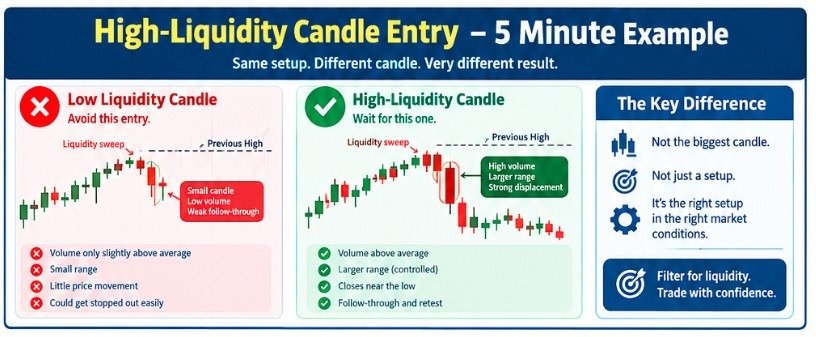
Imagine NASDAQ futures are approaching the previous session high.
Price trades above that high.
Stops trigger.
Price quickly returns below the level.
You are watching for a short.
The first bearish candle after the sweep is small.
Volume is only slightly above average.
You do nothing.
Five minutes later, another bearish candle appears.
This candle has significantly above-average volume, a larger-than-normal range and closes near its low.
The market then retests the broken level from underneath.
That is a very different entry environment.
You are not shorting because the candle is big.
You are shorting because the liquidity event, rejection, displacement and confirmation are occurring together.
The high-liquidity candle has become an execution filter.
That is the key distinction.
Do Not Confuse the Sweep With the Entry
This is where many liquidity-sweep strategies become unnecessarily aggressive.
A trader sees price sweep a previous high.
They immediately enter short.
But the sweep is often only the first event.
The market has taken liquidity.
That does not tell you what it will do next.
A sweep can produce reversal.
It can produce continuation.
It can produce consolidation.
It can produce another sweep.
The sweep becomes much more useful when followed by evidence that the market is rejecting the liquidity area.
Your high-liquidity candle filter can therefore sit after the sweep.
The sequence is:
Liquidity gets sucked out.
Price responds.
More participation.
And in comes the displacement.
Architecture.
Entry comes into effect.
That is significantly stronger than seeing any wick above a previous high as a reversal indication.
The Best Liquidity Candle Is Not Always the Largest Candle
This is another mistake worth eliminating.
If your filter simply selects the largest candle of the last 20 bars, you may accidentally select an exhaustion candle.
Let’s say a stock has been moving higher for 45 minutes.
The last candle of the breakout is 3 times the average range.
The volume is large.
The candle closes close to the high.
It looks mighty.
You purchase.
Five minutes later, pricing makes a sudden turn.
Why?
Because the candle may represent the final acceleration of an already crowded move.
The market had plenty of activity.
But that activity did not necessarily create a favorable entry.
This is why I prefer the phrase high-quality liquidity candle rather than simply high-liquidity candle.
The candle must be active, but its location matters.
Location Comes Before Liquidity
A high-volume candle in the middle of nowhere is not necessarily useful.
A high-volume candle at a meaningful level can be extremely informative.
Consider two candles.
One occurs in the middle of a 30-minute range.
The other occurs immediately after price sweeps the previous day’s high.
Both have 2.5 times average volume.
The second candle provides more contextual information because something important happened at the same time.
This gives you a simple hierarchy:
Location first. Liquidity second. Reaction third. Execution fourth.
Do not reverse that order.
Otherwise, you will start chasing every volume spike on the chart.
Use Time-of-Day Filters
Liquidity is not evenly distributed throughout the trading day.
The market can transition between quiet periods and highly active periods as different participants enter.
This is especially obvious around major session opens, important economic releases and periods when large markets overlap.
CME’s liquidity research allows traders to compare bid-ask spreads, depth and cost-to-trade characteristics across different global trading periods, reinforcing the idea that liquidity should be treated as time-dependent rather than constant.
For a day trader, the practical approach is to build a session map.
Do not assume every hour deserves the same entry rules.
Track your setups during the opening period.
Track them during the middle of the session.
Track them around major market transitions.
Track them during the final active period.
You may find that your strategy has an edge only during certain windows.
If that happens, there is no reason to force the same setup throughout the day.
High Liquidity Does Not Mean High Volatility
This deserves a section of its own.
High volatility means the price is fluctuating a lot.
High liquidity means the market can usually absorb transactions with little disturbance to prices.
They often move together.
They do not always.
A market can become extremely volatile while liquidity deteriorates.
CME research published during periods of market stress has shown that order-book depth can change materially during volatility events, demonstrating why volatility should not automatically be treated as synonymous with liquidity.
This is especially relevant around news.
A candle can become enormous precisely because normal liquidity has disappeared.
So if your rule says:
“Trade only high-liquidity candles.”
Do not define that as:
“Trade only the biggest candles.”
That would accidentally turn your liquidity filter into a volatility-chasing strategy.
A Better Candle Classification System
For research purposes, I recommend classifying candles into four broad environments.
The first is low activity and low range.
The second is normal activity and normal range.
The third is elevated activity with controlled directional range.
The fourth is extreme activity with abnormal range.
Your entry filter will probably prefer the third category.
The first category may lack enough participation.
The second may provide normal opportunities but not enough confirmation for your particular setup.
The third can provide a useful combination of participation and controlled expansion.
The fourth requires caution because extreme volatility can create poor execution and unstable structure.
This classification is much more useful than simply labeling candles bullish or bearish.
Build a Relative Liquidity Score
If you want to take the concept further, create a simple internal score.
Do not try to make it mathematically perfect.
You want consistency.
For every potential entry, record the candle’s relative volume, relative range, time of day, spread condition if available, distance from a meaningful level and price response.
You can then assign a simple score.
For example, a candle might receive positive points for above-average volume, controlled range expansion and normal spread conditions.
It might receive negative points for extremely abnormal range, news proximity, poor spread conditions or being located far from meaningful structure.
The score should not tell you whether to buy or sell.
It should tell you whether the execution environment is worth considering.
That distinction prevents the filter from becoming another prediction indicator.
How to Use Relative Volume Without Overfitting
There is a temptation to search for the perfect threshold.
1.7 times average volume.
2.0 times.
2.3 times.
2.5 times.
Then traders backtest enough variations until one produces an attractive historical result.
That is risky.
A threshold that works brilliantly in one market time may simply be fitting noise.
Try ranges instead.
Compare normal-volume entries to elevated-volume entries.
Then compare moderate volume spikes to high volume spikes.
You may discover that the best results occur somewhere in the middle.
That is actually a valuable finding.
It means your edge may depend on sufficient participation without extreme dislocation.
That is a more realistic market hypothesis than “volume above 2.14 times the average equals an entry.”
The Liquidity Sweep Plus Displacement Model
For traders who use smart-money concepts, price-action structure or liquidity concepts, this is one of the cleanest applications.
Start with a known liquidity pool.
That could be an equal high, equal low, previous session high, previous session low, opening range extreme or obvious intraday swing.
Wait for the sweep.
Do not enter simply because the sweep occurred.
Watch the response.
If the market begins displacing away from the swept level and the displacement candle occurs under elevated participation, you now have stronger evidence.
The next question is whether the market can maintain that displacement.
Immediately reverse; cancel the thesis.
If it holds and retests well, the entry becomes more tempting.
The sequence is significant because it separates liquidity gathering from path confirmation.
That is one of the biggest practical improvements a liquidity-sweep trader can make.
What Happens When the High-Liquidity Candle Appears Too Late?
This is where discipline becomes important.
Suppose your setup begins at 9:35.
The liquidity sweep happens.
But the high-liquidity confirmation does not appear until 9:48.
By then, price has already traveled 1.5R.
The filter has technically triggered.
Should you enter?
Not necessarily.
The filter tells you that the environment has improved.
It does not tell you that the trade still offers an attractive entry.
This is why every entry filter needs a second filter:
distance from invalidation.
If the confirmation arrives after the expected reward-to-risk has already deteriorated, you skip the trade.
You should never allow a good confirmation filter to force you into a bad price.
High Liquidity Can Make You More Vulnerable to Slippage
There is a strange contradiction here.
Traders want liquidity because it can improve execution.
But the most active candles can also move so quickly that market orders experience slippage.
The answer is not to avoid active candles.
It is to understand the relationship between speed and depth.
A candle that moves rapidly through several price levels can be very active but difficult to enter precisely.
That is why your journal should include expected entry versus actual fill.
If you repeatedly discover that your strategy performs well on paper but actual fills are significantly worse during the most aggressive candles, you have found a genuine execution problem.
That is not a strategy failure.
It is an implementation failure.
And implementation can often be improved.
Position Size Should Respond to the Candle, Not Just the Stop
Suppose your normal stop is 10 points.
You lose $100.
And volatility goes up.
Now your structural stop needs to be 18 points.
If you keep the same position size your risk is going up exponentially.
This is where a lot of traders fuck up their calculations.
They focus on the setup and ignore that the high liquidity candle may have modified the distance needed to invalidate the trade.
The correct sequence is:
Identify the structural stop.
Measure the distance.
Determine the maximum dollar risk.
Calculate the position size.
A Position Size Calculator is useful here because it removes unnecessary arithmetic from the execution process and helps keep risk stable when candle size and stop distance change.
The goal is not to force every trade into the same number of points.
The goal is to keep the amount at risk consistent with the strategy.
Your Entry Filter Should Sometimes Tell You to Do Nothing
This sounds obvious, but it is one of the hardest parts of using a liquidity filter.
Let’s assume you have a 3-fold configuration.
The first happens amid weak activity.
The second is when volatility is excessive.
The third happens in controlled, high participation.
The first can be eliminated by filtration.
Your volatility filter might filter the 2nd one.
Only the third is qualified.
This means your technique may generate less deals.
That’s not always a bad thing.
If the filter increases expectations, then fewer trades can be exactly what you want.
The mistake is measuring the filter by how often it gives you entries.
Measure it by what happens to the trades it allows through.
The Psychological Benefit of a Liquidity Filter
There is a psychological advantage that is easy to overlook.
Clearly established liquidity filters prevent impulsive entries.
Every building can be marketable continually.
A trader sees a sweep.
Then a candle.
A slight shift follows.
The brain creates a story.
“Buyers are coming in.”
“The trend is changing.”
“This could be the move.”
A liquidity filter creates a pause.
You have another question to answer before acting.
Is participation actually elevated?
If not, wait.
That small delay can prevent a surprising number of low-quality trades.
The filter becomes a psychological speed limiter.
Avoid Moving the Filter After a Losing Trade
This is critical.
You use a high-liquidity filter.
The first three trades lose.
You start thinking:
“Maybe I should remove the volume requirement.”
Then the next setup works without the filter.
Now you conclude the filter is useless.
That is not research.
That is emotional adaptation to a tiny sample.
A filter should be evaluated over a statistically meaningful number of observations.
You need enough trades to determine whether the filter changes your expectancy.
The correct question is:
“How does my strategy perform with the filter compared with the same strategy without it?”
Not:
“Did the last trade work?”
Track the Filter as a Separate Variable
Your trading journal should contain a specific field for liquidity conditions.
For each trade, record the setup type, timeframe, time of day, relative volume, candle range relative to ATR, liquidity-sweep presence, confirmation type, expected entry, actual fill, stop distance, result in R and maximum favorable excursion.
This allows you to isolate the effect of the filter.
Suppose after 100 trades you discover that:
Your normal-volume setups win 43% of the time.
Your elevated-volume setups win 51%.
Your extreme-volume setups win 39%.
That would be a very interesting outcome.
This would mean the link is not as simple as:
Bigger volume is preferable.
It might be rather:
“It is better to have moderate participation and controlled price growth.
A downloadable Trade Journal Template can help you structure this information from the beginning rather than trying to reconstruct it from screenshots and memory months later.
Measure Maximum Favorable Excursion
One of the most useful measurements for this strategy is maximum favorable excursion, or MFE.
Suppose you enter a liquidity-sweep reversal after a high-liquidity confirmation candle.
You risk 1R.
The trade reaches 2.8R before returning to your entry.
You exit at breakeven.
The trade technically records zero.
But the market gave you 2.8R of favorable movement.
That information matters.
Maybe your target is too aggressive.
Maybe your trailing stop is poorly designed.
Maybe the high-liquidity candle produces fast initial movement but weaker continuation.
MFE can reveal the actual behavior of your setup.
Likewise, maximum adverse excursion can tell you how much heat the trade normally experiences before working.
That can help you determine whether your stop is too tight.
Build Your Filter Around Your Instrument
There is no universal definition of a high-liquidity candle.
A five-minute candle in EUR/USD behaves differently from one in crude oil.
A candle in the S&P 500 futures market behaves differently from a small-cap stock.
Crypto trades around the clock and has a different market structure from centralized futures markets.
Therefore, do not copy another trader’s volume threshold.
Build your own baseline.
Start with the instrument.
Then the timeframe.
Then the session.
Then the setup.
Then the liquidity measurement.
The same 2x volume threshold can mean very different things in different markets.
The Best Filter May Be Relative, Not Absolute
This is one of the biggest practical takeaways.
Instead of saying:
“Only trade candles with 1 million shares.”
Use:
“Only trade candles with volume materially above the normal volume for this time and instrument.”
Instead:
“Don’t trade until ATR is above 10.”
How to use:
“Only trade when the current range and volatility are in the regime where this has worked well historically.
Relative measurements are changed suit the environment.
When a High-Liquidity Filter Fails
Every filter has failure modes.
One is news.
A news event can create huge volume and terrible execution simultaneously.
Another is exhaustion.
The highest-volume candle can occur at the end of a move.
Another is late entry.
The confirmation may arrive after the favorable reward-to-risk opportunity has disappeared.
Another is false precision.
You may create a complicated scoring system that looks scientific but has no genuine predictive value outside your sample.
Another is low-quality volume.
Depending on the market and data source, reported volume may not represent the complete market.
This matters particularly when comparing centralized exchange data with fragmented markets.
A filter should therefore be designed around the data you actually have access to.
What Serious Testing Looks Like
If I were testing this strategy from scratch, I would not start with dozens of rules.
I would create two versions of the same setup.
Version A takes every valid structural entry.
Version B takes the entry only when the candle meets the high-liquidity criteria.
Then I would compare them.
Win rate.
Average R.
Expectancy.
Profit factor.
Maximum drawdown.
MFE.
MAE.
Number of trades.
Average holding time.
Slippage.
Performance by session.
Performance around news.
After that, I would divide the data into different market regimes.
Trending days.
Range days.
High-volatility days.
Low-volatility days.
That is where the real information appears.
Maybe the liquidity filter does almost nothing during strong trend days but dramatically improves performance during range-bound sessions.
That would change how you use it.
You would not throw the filter away.
You would make it conditional.
The Difference Between a Filter and a Trigger
This distinction should be written directly into your trading plan.
A trigger tells you when to enter.
A filter tells you when the trigger is allowed to operate.
Your liquidity condition should usually be a filter.
For example:
“Liquidity sweep plus market structure shift” can be the trigger.
“Relative volume above baseline during approved session and acceptable execution conditions” can be the filter.
That architecture is powerful because it prevents your liquidity measurement from becoming another directional indicator.
You are not saying:
“High volume means buy.”
You are saying:
“If my setup occurs, I only want to execute it when the market environment meets these conditions.”
That is a much cleaner trading model.
How This Changes a Day Trader’s Routine
Before the session begins, identify the periods where your instrument historically provides sufficient participation.
Mark the important liquidity levels.
Know the scheduled economic events.
Define the maximum spread or execution condition you are willing to accept.
During the session, wait for price to reach your area.
When the setup appears, do not immediately enter.
Check whether the candle satisfies your activity criteria.
Then check whether price response supports your thesis.
Then calculate the stop.
Then calculate position size.
Then execute.
This routine may take only a few seconds once practiced.
But those few seconds can separate a planned trade from an impulsive trade.
Scaling the Strategy Beyond Your Own Capital
Once a strategy has a measurable edge, another problem appears.
Your trading process may be better than the amount of capital available to you.
The temptation is to solve that problem by increasing leverage or risking more per trade.
That is usually the wrong direction.
A more professional approach is to separate strategy quality from capital allocation.
If your edge has been tested and your execution is consistent, evaluation programs can provide another route to accessing larger notional capital under predefined rules.
The important point is that an evaluation account is not a substitute for an edge.
If your high-liquidity entry strategy is not profitable on a small account, increasing the account size will not repair it.
But if you have already developed a repeatable process, an evaluation can become a way of testing that process under a different capital structure.
The5ers, for example, currently offers its High Stakes program as a two-step evaluation with defined profit targets, daily-loss and maximum-loss parameters, and scaling provisions. Its current published rules also specify restrictions around order execution during a short window around high-impact news.
That news rule is particularly relevant to this strategy.
A trader whose system relies heavily on high-volume candles needs to distinguish between healthy liquidity expansion and news-driven volatility.
Those are not necessarily the same thing.
Other firms use different evaluation structures, drawdown rules, consistency requirements and restrictions, so serious traders should compare the actual rules against their strategy rather than choosing a program solely because of the advertised account size.
The logic is simple.
First prove that the strategy works.
Then prove that you can execute it consistently.
Then select a capital structure that does not force you to change the risk model that created the edge.
If your research supports the approach and the program rules fit your execution style, you can explore the [The5ers High Stakes evaluation program] as one possible route for scaling.
Why Evaluation Rules Matter for a Liquidity-Based Strategy
Suppose your strategy works best during active market periods.
You should check whether the evaluation program permits your normal execution around those periods.
Suppose your strategy relies heavily on economic releases.
You need to understand the firm’s news rules.
Suppose your strategy uses very short-duration trades.
You need to check whether the firm’s rules restrict high-frequency or extremely short-duration trading.
These details matter.
The5ers’ current terms, for example, explicitly address prohibited practices and state restrictions around certain news and high-frequency trading behavior.
That means the correct evaluation program is not simply the one with the largest account.
It is the one whose rules allow your legitimate trading process to operate without forcing you into behavior that destroys your edge.
Frequently Asked Questions
What is a high liquidity candle entry strategy?
A high liquidity candle entry strategy uses market activity and execution conditions as a filter for otherwise valid trade setups. Instead of entering every time a technical trigger appears, the trader waits for the trigger to occur during a period of sufficiently strong participation and acceptable execution conditions.
How do I identify a high-liquidity candle?
Begin with relative volume, not absolute volume. Compare the present candle activity to a recent baseline for the same instrument and timeframe. Add that information to the candle range, time of day, spread conditions if available and the price reaction at a meaningful market level.
Is a high-volume candle always a high-liquidity candle?
Nope. High volume suggests there was a lot of trading. Liquidity also has to do with things like spread, market depth and the capacity to trade without a significant price impact. News-driven volume increase can happen as execution conditions get worse.
Can I use high-liquidity candles with liquidity sweeps?
Yes. One useful application is to wait for a liquidity sweep and then use elevated participation and directional displacement as confirmation. The sweep identifies the event, while the high-liquidity candle can help confirm that the market is actually responding to it.
What volume indicator should I use?
There is no universally best indicator. Relative volume is a useful starting point because it compares current activity with a recent baseline. The more important issue is whether the measurement has been tested on your instrument, timeframe and trading session.
Should I trade only during the most active market hours?
Not necessarily. The right trading window depends on the instrument and technique you use. Evaluate your setup across several sessions and compare expectation, quality of execution, volatility and drawdown before determining which periods to focus on.
Can high liquidity make a breakout safer?
Not always. Higher activity can enhance execution conditions but a particularly aggressive volume and volatility spike can also be a sign of weariness, news repricing, or momentary instability. Liquidity must be considered together with location, structure, and price reaction.
How does a liquidity sweep differ from a high-liquidity candle?
A liquidity sweep describes a price event in which a known high or low is taken and price reacts around that area. A high-liquidity candle describes the trading environment and activity surrounding a candle. They can be used together, but they are different concepts.
How should I backtest a high-liquidity entry filter?
Compare your original strategy with the same strategy plus the liquidity filter. Track expectancy, win rate, average R, drawdown, MFE, MAE, trade frequency and execution quality. Then segment the results by time of day, volatility regime and market condition.
Does the largest volume candle provide the best entry?
Not always so. The largest candles can be a sign of tiredness, or of news-driven volatility. It’s not the large candle you are looking for. It’s to identify a candle where participation, price reaction, location and execution conditions are aligned with your existing setup.
Final Takeaway
One of the biggest mistakes traders make with liquidity is to think of it as a synonym for volume.
It isn’t.
Volume tells you there was action.
Liquidity gives you a greater sense of the market’s ability to trade around present pricing.
That distinction changes how you build an entry strategy.
You do not need to chase every large candle.
You do not need to buy every displacement candle.
You do not need to trade every liquidity sweep.
Instead, build a gate around your existing strategy.
Let the setup identify the opportunity.
Let the liquidity filter determine whether the market environment is suitable for execution.
Then let risk management determine whether the trade is worth taking.
For the next 50 trades, make one change to your journal.
Add a column for liquidity condition at entry.
Record relative volume.
Record candle range relative to ATR.
Record time of day.
Record whether a liquidity sweep occurred.
Record whether the candle produced meaningful displacement.
Record expected versus actual fill.
Then compare the results.
Do not ask which candle looked the best.
Ask which market conditions produced the best trades.
That is the difference between building a collection of entry signals and building an actual trading process.
Your next read should be your existing DayTradersDiary article on how to measure entry delay risk in Forex, because once you restrict entries to higher-quality liquidity conditions, the next question becomes equally important: how much does waiting for that confirmation actually cost you in price, risk and reward-to-risk?
The goal is not to trade more active candles.
It is to become selective about which active candles deserve your risk.