
The most expensive breakout is generally the one that appears to be ideal.
Price breaks resistance. The breakout candle closes forcefully. Volume spikes. Momentum traders come in. You buy the move, put your stop below the breakout level, and anticipate continuation.
Then the next candle reverses.
Price falls back below resistance, triggers your stop, and sometimes runs straight through the range in the opposite direction.
A few minutes later, you are watching the market move exactly where you originally thought it would go, except your position is gone.
This is the classic head-fake breakout.
The mistake is usually not that the trader identified the wrong level. The level may have been completely valid. The problem is treating the first move through that level as proof that the market has accepted the new price.
A breakout is not confirmed by the price trading beyond a previous high or low.
For active day traders, the more appropriate question is:
Was the market really taking out prices above that level, or was it only traveling there long enough to trigger orders?
That distinction alters the way you read breakouts, the way you place stops, the way you interpret volume, and most crucially when you decide not to trade.
This tutorial builds a practical framework to avoid head-fake breakouts by combining market structure, liquidity, volatility, volume, candle behavior, retests and execution discipline.
What Is a Head-Fake Breakout?
A head fake breakout is when price breaks above or below a key support or resistance level, drawing in traders who are betting on a continuation of the move, only to reverse course and swiftly return back inside the prior trading range.
The defining feature is not simply that the breakout fails.
A normal failed breakout can develop gradually.
A head fake is usually more deceptive. The initial move often looks convincing enough to pull traders into the market before the reversal begins.
Consider a stock trading between $100 and $105 for most of the morning.
At 10:32, the price pushes through $105, reaching $105.60.
A trader sees the range high break and enters long at $105.55.
The next candle trades at $105.70, making the trade appear correct.
Then aggressive selling appears.
Price falls to $104.90.
The breakout has failed.
But there is another layer to the situation.
The traders who bought above $105 are now underwater. Their protective stops may sit below $104.80 or $104.70. Short sellers who were waiting for a failed breakout may now enter.
The failed breakout can therefore serve as fuel for a move in the opposite direction.
That is why head fakes can move so quickly.
The breakout did not simply fail.
It created a positioning imbalance.
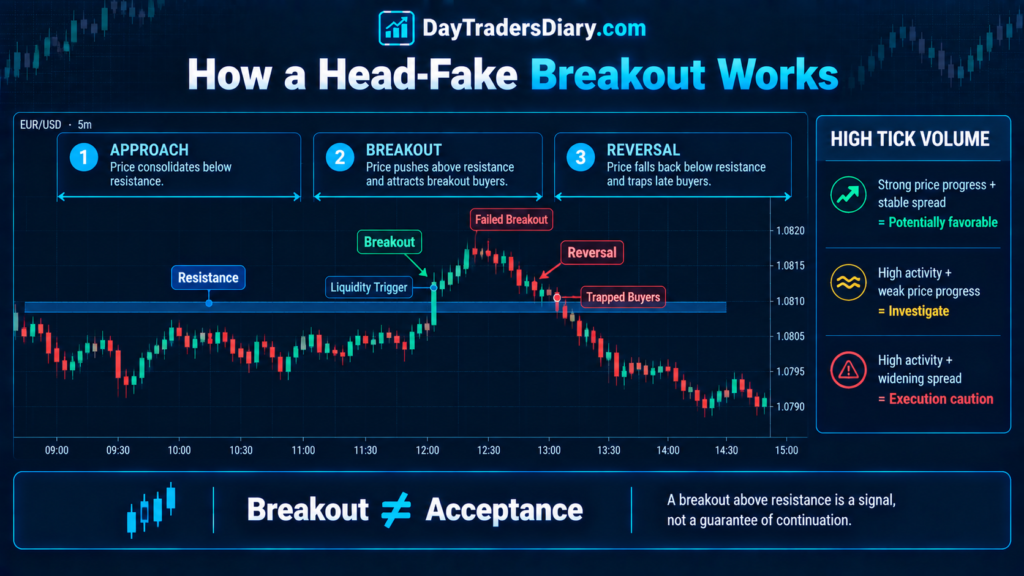
Why Traders Keep Falling for Head Fakes
Most traders think about breakouts from a price perspective.
They see resistance.
Then they see the price move above resistance.
Then they assume buyers have won.
The market does not work that cleanly.
Every breakout contains two questions.
The first is whether the price can trade beyond the level.
The second is whether enough participants are willing to transact at those new prices to sustain them.
Those are different things.
A market can briefly trade above resistance because liquidity is available there. Stops from short sellers may be triggered. Breakout orders may activate. Market orders may hit the offer.
But if sustained demand does not materialize after those transactions, the price can fall back through the level.
This is one reason I prefer to think of a breakout as an acceptance test, not a line-crossing event.
The level is only the location.
The reaction after the level is the information.
The Three-Stage Anatomy of a Head Fake
A useful way to study false breakouts is to divide them into three stages.
The first stage is the approach.
Price moves toward a well-defined level.
The second stage is the liquidity event.
Price trades through the level, triggering resting orders, stops, and breakout entries.
The third stage is the acceptance or rejection.
This is where the market tells you whether the breakout has real continuation potential.
Most inexperienced traders concentrate almost entirely on stage two.
Experienced traders spend more time watching stage three.
Imagine EUR/USD approaches 1.0850 after several failed attempts to break higher.
Price finally trades at 1.0858.
That tells you almost nothing by itself.
Now suppose price closes above 1.0850, retests 1.0852, holds, and then produces another expansion candle toward 1.0870.
That is different information.
The market has demonstrated an ability to remain above the previous ceiling.
Now imagine price trades to 1.0858, then immediately falls back to 1.0846, closing inside the previous range.
That is a very different event.
The breakout occurred.
The acceptance did not.
The First Rule: Stop Treating Every Breakout Candle as Confirmation
One of the most useful changes you can make is to stop asking:
“Price broke resistance?”
Instead ask:
What happened to the price after it breached the resistance?
This sounds simple, but it changes the way you perform.
The breakout candle can be enormous due to real directional participation.
It can also be large because liquidity temporarily disappeared.
It can be large because stops were triggered.
It can be large because of the news.
It can be large because the market was thin.
The candle itself does not tell you which explanation is correct.
This is where volume becomes useful, but only if you interpret it properly.
CME Group explains that volume is the number of contracts traded. Still, volume alone cannot tell you whether traders are opening or closing positions or whether the activity represents buying or selling pressure.
That distinction matters enormously.
A huge volume spike at a breakout does not automatically mean “strong buyers.”
It means many transactions occurred.
Your job is to determine what price was used for those transactions.
Read Volume Through Price Reaction
Suppose resistance is at 500.
Volume increases drastically as price breaks to 503.
The popular interpretation is:
“Volume validates the breakout.
I would make the interpretation conditional.
If price breaks 500 on high volume and continues holding above 500, the increased activity can support the continuation thesis.
If price breaks 500 on high volume, reaches 503, and then collapses back below 500, the same volume spike becomes evidence of a failed auction.
The volume did not change.
The meaning changed because price behavior changed.
This is an important distinction for day traders.
Volume should be interpreted alongside location and the subsequent price response.
CME also notes that traders use volume, open interest, bid-ask spreads, and market depth as different ways of evaluating market activity and liquidity.
That gives you a better framework than simply labeling a volume spike as bullish or bearish.
The Liquidity Trap Behind Many Head Fakes
A head fake often makes sense when you stop looking at the chart as a collection of candles and start looking at it as a collection of orders.
Consider a well-defined range.
The range high is visible to everyone.
Short sellers often place stops above it.
Breakout traders place buy orders around it.
Momentum traders wait for the move through it.
The market, therefore, contains a concentration of potential transactions around the same area.
Price moving through that level can activate many orders at once.
But the existence of those orders does not guarantee continuation.
Once those orders have been triggered, the market still needs fresh demand to keep pushing higher.
If that demand is absent, the price can reverse.
This is why a breakout can look strongest immediately before it fails.
The market has created the appearance of participation because many orders were activated, but the underlying directional commitment may not be strong enough to sustain the move.
The Bank for International Settlements defines liquidity as the bid-ask spreads, market depth and price effect. It highlights the fact that liquidity is not a single measure, but a dynamic one.
For a day trader, the practical lesson is straightforward:
A fast price move is not necessarily a strong price move.
Speed and strength are not the same thing.
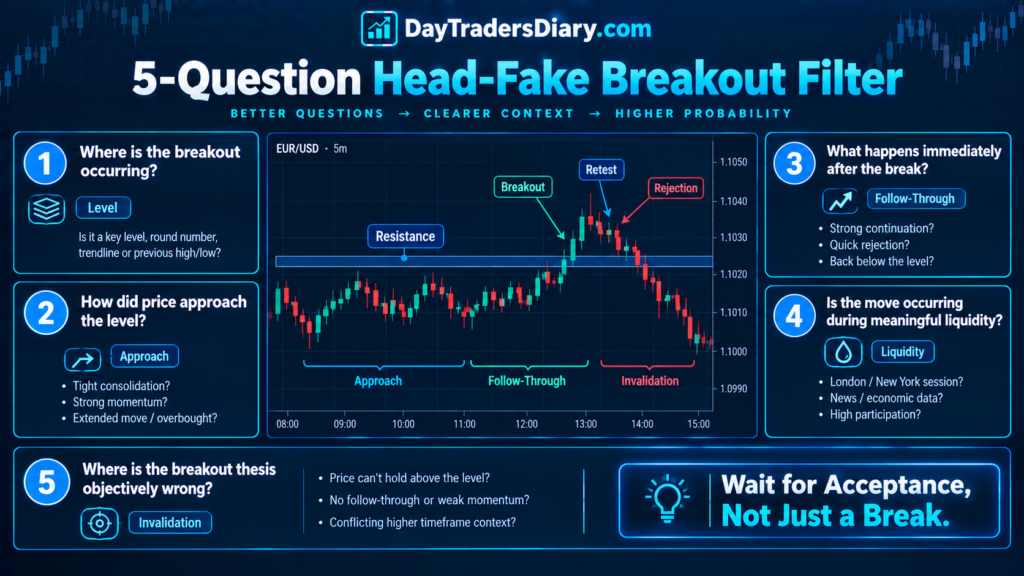
The 5-Question Head-Fake Filter
Before entering a breakout trade, run five questions through your head.
1. Where is the breakout occurring?
A breakout from the middle of a noisy range is very different from a breakout through a major session high, previous-day high, weekly level, or well-tested structural boundary.
The more obvious the level, the more likely it is to contain concentrated orders.
That does not mean you should automatically fade obvious levels.
It means you should expect more two-sided activity around them.
2. How did price approach the level?
A breakout after clean compression can behave differently from one after a vertical rally.
Suppose the price rises aggressively over ten candles, then hits resistance.
There may be less room for new buyers to enter because many participants are already long.
Now compare that with a controlled consolidation beneath resistance.
Price repeatedly tests the area while volatility contracts.
A subsequent expansion may have a different character because the market has spent time building pressure beneath the level.
The setup is not inherently better; the context is different.
3. What happens immediately after the break?
This is the question I would prioritize.
Does price hold beyond the level?
Does the next candle continue?
Does the breakout candle close near its extreme?
Does price immediately return inside the range?
Is the retest valid?
Does the market spend time above the level or reject it right away?
Any breakout that doesn’t stay out of the old range is suspect.
4. Is the move occurring during meaningful liquidity?
Time of day matters.
A breakout during an active market period can have very different execution characteristics from a breakout during a quiet period.
CME notes that traders generally prefer higher-volume periods because liquidity tends to improve, spreads narrow, and orders can be filled more efficiently.
This is particularly important for day traders because a thin market can produce dramatic-looking price movement without the same quality of participation.
A breakout during a major session transition may deserve attention.
A breakout during a dead period deserves a higher burden of proof.
5. Where would the breakout thesis be objectively wrong?
This question saves you from converting a failed breakout into a stubborn trade.
If price breaks resistance and your thesis depends on that resistance becoming support, then a clean move back below the level is meaningful information.
Do not move your invalidation point simply because the market has become uncomfortable.
Your stop should exist because the trade thesis has failed, not because you selected a convenient dollar amount.
The Retest Is Not Always Confirmation
Many traders learn a simple rule:
“Wait for the breakout and retest.”
That is better than unthinkingly buying the first breakout candle, but it is still incomplete.
A retest can produce either confirmation or failure.
Imagine resistance at 100.
Price breaks to 102.
It pulls back to 100.20.
Trader sees a retest and buys.
But see the reaction today.
If price immediately sells down from 100 and makes higher lows, that is positive.
If price tests the 100 level and struggles to break above it and closes below it again, it shows weakness on the retest.
The difference is not the retest’s existence.
It is the quality of the response from the retest.
I often think of the retest as a negotiation.
The market is asking:
“Are buyers actually willing to defend this new price area?”
If the answer appears to be no, there is little reason to assume the breakout is healthy.
Use Time as a Confirmation Tool
One of the most underused filters for head fakes is time.
Traders tend to focus on price because charts display price visually.
But time spent above or below a level can provide important information.
Suppose resistance is 4,500.
Price spikes to 4,515 and immediately falls back.
That is a fast rejection.
Now suppose price breaks 4,500 and spends several minutes trading between 4,502 and 4,508 without collapsing.
That behavior may indicate a developing area of acceptance.
Neither scenario guarantees continuation.
But they are not equivalent.
A market that cannot spend meaningful time beyond a breakout level deserves more skepticism than one that establishes a new short-term balance above it.
This is particularly useful for traders who repeatedly get stopped on the first breakout candle.
Instead of demanding a fixed number of seconds or minutes, define your confirmation in terms of market behavior.
For example:
I do not chase if the price breaks resistance but fails to stay above it for the next important sequence of candles.
There is no universal guideline for perfect timing; it will be dictated by your instrument, your timeframe, and your volatility.
The Failed Breakout Becomes a New Setup
Here is one of the most important psychological shifts in avoiding head fakes.
You do not have to predict the failure.
You can wait for the market to prove it.
Suppose the NASDAQ breaks a morning high.
You don’t short since the move looks stretched.
And then you watch.
Price breaks the high.
Momentum is losing.
The following candle closes under the breakout level.
A retest from below fails.
The failed breakout is information now.
You can potentially trade the reversal because the market has provided a sequence of evidence:
Break.
Failure.
Reclaim of the old range.
Retest.
Rejection.
That is much different from guessing that a breakout will fail simply because it looks too obvious.
This is one reason failed breakouts can become powerful reversal structures.
The traders who entered the original breakout are now trapped.
Their exits can become fuel for the opposite move.
A Practical Decision Tree for Breakout Entries
Think about your breakout process as a decision tree rather than a single signal.
Price approaches resistance.
If the approach is messy and volatility is already high, take it easy.
Watch for price compression below the resistance.
If the price breaks resistance, don’t just jump in.
The price is over the level.
If it does, look for the next breakout or retest.
The breakout is shaky if it snaps back into the old range rapidly.
If the retest holds and price prints a higher bottom, the continuation thesis gets stronger.
If the retest fails, cancel the long thesis.
If the price then breaks back through the range in the opposite direction, consider whether a failed-breakout setup is developing.
This approach sounds slower than buying the first breakout.
That is intentional.
The goal is not to catch every breakout.
The goal is to improve the quality of the breakouts you choose to participate in.
Do Not Use Too Many Confirmation Indicators
There is another trap here.
Once traders experience several false breakouts, they often respond by adding indicators.
Volume.
RSI.
MACD.
Stochastic.
Moving averages.
ADX.
VWAP.
Bollinger Bands.
Then the chart becomes a negotiation between ten different signals.
That usually does not solve the underlying problem.
A better approach is to use different information sources for different questions.
Price structure tells you where the market is testing.
Volume tells you about activity, with important limitations.
Volatility tells you how much movement is normal.
Time tells you how quickly acceptance or rejection is developing.
Execution data tells you what the move actually costs you.
You do not need six indicators saying “breakout.”
You need a small number of independent observations answering different questions.
Volatility Changes What a Head Fake Looks Like
A fixed breakout rule can behave badly across different volatility regimes.
Suppose EUR/USD normally moves 40 pips during your trading window.
A 5-pip move beyond resistance might be meaningful.
Now imagine a news-driven session where EUR/USD moves 100 pips in a short period.
The same 5-pip extension means very little.
This is why volatility-adjusted thinking can be more useful than fixed thresholds.
ATR can provide a basic reference.
You might define a breakout extension relative to recent ATR rather than saying:
“Price must move at least 10 pips beyond resistance.”
For example, if the average true range on your chosen timeframe is 20 pips, a 2-pip breakout is a very different event from a 10-pip breakout.
This does not mean larger breakouts are automatically better.
Sometimes, a very large breakout is exactly what creates the head fake because the price has traveled too far too quickly.
The point is to interpret the move relative to its environment.
Beware of the News-Driven Head Fake
News creates a special problem.
During major economic releases, prices can move through several technical levels almost instantly.
A trader may see a breakout, enter, get stopped, and then see the price reverse again.
The problem is that normal technical confirmation can temporarily lose reliability.
The market is repricing information.
Spreads can widen.
Liquidity can change.
Execution can deteriorate.
The level that looked technically important five minutes earlier may be almost irrelevant once new information enters the market.
This is why your breakout strategy should have a clear news filter.
You do not necessarily have to avoid every news event.
But you should know when your normal assumptions about spread, execution, and price behavior are no longer valid.
The Difference Between a Fast Breakout and a Healthy Breakout
A healthy breakout does not have to move slowly.
Some of the best breakouts are extremely fast.
The important distinction is what happens after the initial expansion.
Think two marketplaces.
Market A breaches resistance and pushes up 1 ATR promptly with little or no pullback.
Market B breaches resistance and moves up 0.4 ATR before pausing, retesting the breakout level and holding before expanding.
Market A may be stronger.
But Market B may be easier to execute because the market has provided an opportunity to observe acceptance.
This is why waiting for confirmation should not mean waiting until the move is already complete.
You are looking for information, not certainty.
There is no perfect confirmation.
You are simply trying to avoid paying the highest price for the least information.
The Psychology of Chasing a Breakout
Head fakes become especially dangerous after you miss the first move.
Price breaks resistance.
You hesitate.
It moves another 0.3%.
Now you feel late.
You enter.
Price reverses.
This is not a technical problem.
It is an emotional sequence.
The brain interprets the missed move as a loss, even though you never had a position.
That creates urgency.
Urgency lowers your entry standards.
This is one of the reasons experienced traders often say that missing a trade is cheaper than forcing one.
The market does not care whether you participated in the first move.
Your job is not to prove that you were right about the direction.
Your job is to enter when the expected reward relative to risk is still attractive.
A trader who waits for acceptance may enter the market later than a breakout trader.
That is acceptable if the trade quality improves.
Use a Two-Stage Entry Model
One practical way to reduce head-fake exposure is to separate observation from commitment.
Stage one is the warning.
Price hits the breakthrough level.
You get interested.
Stage two is confirmation.
Price behaves in a way that supports the argument.
And only then do you take real risk.
This prevents the first tick above resistance from becoming a trade by default.
For some strategies, this may mean entering a small starter position and adding after confirmation.
For others, it may mean taking no position until the retest.
There is no universally superior method.
The key is that your initial risk should correspond to your level of information.
Low information should not receive maximum risk.
Risk Management: Your Stop Should Respect the Structure
A head-fake strategy can fail even when your analysis is good if your stop is badly positioned.
The common mistake is placing the stop exactly at the obvious breakout level.
Suppose resistance is 100.
You buy at 100.20.
Your stop is at 99.95.
That stop may be sitting directly inside the area where normal retesting occurs.
You have effectively placed your stop at the level where the market is most likely to test liquidity.
The solution is not simply to use a much wider stop.
The stop should sit at a level that invalidates the actual trade idea.
Then, the position size should be adjusted to keep the monetary risk constant.
This is where many traders miscalculate risk.
They choose the lot size first, then the stop.
Reverse the process.
Determine the invalidation point.
Calculate the stop distance.
Then calculate the position size based on your predetermined risk amount.
Using a Position Size Calculator can remove much of the guesswork and prevent the common mistake of increasing risk simply because the setup requires a wider structural stop.
The goal is not to make every trade survive.
The goal is to ensure that normal market fluctuations do not accidentally turn into a full-risk loss, while a genuine invalidation should.
Risk Should Be Smaller When Information Is Worse
This is a useful extension of normal position sizing.
Suppose two breakouts have identical stop distances.
The first occurs after clean compression, during active market hours, with strong follow-through and a successful retest.
The second occurs during thin liquidity, immediately before a major news event, or after a huge vertical move.
Technically, the distance to the stop might be identical.
But the quality of information is not.
You can therefore think about position size as a function of both distance and setup quality.
Higher uncertainty does not necessarily mean you must stop trading.
It can mean you reduce exposure.
This is a more sophisticated way to manage head-fake risk than simply adding another indicator.
Build a Head-Fake Journal
If you want to improve at avoiding false breakouts, do not simply record whether the trade won or lost.
Record the sequence.
When you review each breakout, record the breakout time, the level being tested, the distance beyond the level, the candle structure, relative volume, volatility conditions, time of day, whether the breakout held, whether a retest occured, and what happened subsequently.
Most importantly, record whether you entered immediately or waited.
After 50 or 100 examples, patterns often appear.
You may discover that your worst head fakes occur during the first five minutes of a session.
Or during low-volume midday periods.
Or when the breakout candle is unusually large relative to ATR.
Or after three consecutive tests of the same level.
Or when price breaks a level but closes back inside the previous range.
That is much more valuable than reading another generic breakout strategy.
Your own trade history becomes the dataset.
A downloadable Trade Journal Template can make this process easier by allowing you to structure your observations rather than relying on memory after the session.
Create a Head-Fake Score
You can also turn the process into a simple scoring model.
Do not try to predict the market with mathematical precision.
Use the score to force yourself to evaluate the same variables consistently.
Positive weight to clean compression, favorable liquidity conditions, controlled breakout expansion, acceptance above the level, successful retest.
Negative weight to severe extension, immediate rejection, limited liquidity, proximity to important news, and a breakout that closes back inside the range.
The exact scoring system should be developed from your own data.
The important part is consistency.
You are trying to prevent your brain from changing the rules because the current breakout looks exciting.
The Real Edge Is Often the Trade You Reject
There is a subtle shift that occurs as traders mature.
Beginners ask:
“How do I catch more breakouts?”
Experienced traders eventually ask:
“Which breakouts should I refuse to trade?”
That is a much better question.
Every breakout has an opportunity cost.
If the entry requires chasing a large candle, placing a poor stop, entering during thin liquidity, and accepting a weak reward-to-risk ratio, the fact that the price technically broke resistance does not make it a good trade.
A setup can be directionally correct and still be a bad trade.
That distinction is critical.
You can correctly predict that EUR/USD will rise and still lose money because you bought too late.
You can correctly identify that gold will break resistance and still lose because you entered directly into an exhaustion move.
Directional accuracy is not the same as trading edge.
What If the Breakout Runs Without You?
This is where traders often sabotage their own discipline.
You wait for confirmation.
Price breaks.
You wait.
Price continues higher.
Now you feel that your filter costs you money.
Do not make that conclusion too quickly.
Your filter should be evaluated on a large sample, not on a single missed move.
A confirmation rule will reject some trades that would have worked.
That is unavoidable.
The question is whether it rejects enough bad trades to improve your overall expectancy.
Suppose an immediate-entry strategy wins 42% of the time with an average winner of 1.5R.
Suppose your confirmation strategy wins 52% with an average winner of 1.3R but takes fewer trades.
The second strategy is probably better, although you will miss some big breakthroughs.
The question is not right:
“Did I miss a winner?
It’s:
“Did my process make the distribution of outcomes better?”
That’s the attitude shift that takes trading from prediction to process improvement.
A Simple Head-Fake Protocol
Before every breakout entry, I would reduce the entire framework to one sequence.
First, identify the actual level.
Second, explain why the level is important.
Third, look at how the pricing approaches it.
Fourth, wait for the break.
Fifth, look at what is immediately above the level.
Sixth, decide if the market is accepting or rejecting those pricing.
Seventh, verify whether the volatility, liquidity and news conditions make the move trustworthy.
Eighth, What is the definition of structural invalidity?
Ninth, Determine the right position size.
Tenth, do it without changing the rules because the candle seems intriguing.
That process will not eliminate false breakouts.
Nothing will.
But it can stop you from repeatedly making the same mistake.
How To Tell a Head Fake From a Normal Pullback
This is one of the most common questions traders ask.
A pullback on a breakout is not a failed breakout per se.
The final point is where the price is and what it does there.
If the price breaks resistance and then retraces a little, but then stays above the level and creates renewed demand, the retracement could be regular profit-taking.
If price breaks resistance, then returns deeply into the previous range, fails to reclaim the breakout level, and begins making lower highs, the probability of a failed breakout increases.
Think in terms of market structure rather than candle color.
A single red candle after a breakout doesn’t kill the trade.
It is a structural failure.
How Volume Can Mislead Breakout Traders
Another recurring question is, does large volume confirm a breakout?
Not in itself.
High volume confirms activity.
It does not automatically identify the direction of that activity or guarantee continuation.
CME explicitly points out that volume alone cannot tell you whether traders are opening or closing positions or whether the underlying interpretation is bullish or bearish.
That is why the strongest volume analysis combines volume with location and response.
High volume at resistance, followed by acceptance above resistance, is one situation.
High volume at resistance, followed by a collapse back into the range, is another.
Same volume.
Different information.
Can You Completely Avoid Head-Fake Breakouts?
No.
And that should not be the objective.
Markets are probabilistic.
Some breakouts will fail even when every visible confirmation appears favorable.
A professional approach is therefore not about finding a perfect filter.
It is about making sure that false breakouts are inexpensive and genuine breakouts are allowed enough room to pay for them.
That requires three things:
Good selection.
Controlled risk.
Consistent execution.
The trader who loses 0.5R on a failed breakout and makes 2R when the breakout works can survive a substantial number of failures.
The trader who repeatedly loses 2R by chasing extended moves has a much harder problem.
Scaling Your Edge Beyond Small Capital
There is another issue that becomes important once your breakout process begins to produce consistent results.
You may have an edge, but your trading capital can still limit the financial impact of that edge.
This is where professional traders begin thinking differently about capital.
The objective is not to take larger risks simply because more capital is available.
It is to preserve the same process while gaining access to a larger capital base.
Evaluation programs can be one pathway for traders who already have a documented strategy, controlled drawdown, and consistent execution.
The important distinction is that an evaluation should not be viewed as a shortcut to becoming profitable.
It should be viewed as another performance environment in which your existing process has to survive defined risk constraints.
For example, The5ers High Stakes program currently describes a two-step evaluation with defined profit targets, daily loss limits, and maximum-loss parameters. In contrast, its rules and program specifications can change over time.
That structure can be useful for a trader who already understands risk because it forces the trader to operate within explicit limits.
Other proprietary trading firms take different approaches to evaluations, drawdown models, consistency rules, and payouts.
The important thing is not choosing a firm because of the largest advertised account.
The important question is whether the firm’s rules fit your actual strategy.
A breakout trader who needs flexibility around news, for example, should examine the firm’s news-trading rules rather than assuming every evaluation works the same way.
The5ers currently states different rules across its programs, including specific restrictions around high-impact news execution in some programs, while its futures offerings have separate parameters.
That is why serious traders read the rules before paying for an evaluation.
The capital comes after the process.
Not before it.
What To Measure After 100 Breakouts
After collecting enough trades, calculate more than the win rate.
Measure your immediate-entry win rate.
Measure your confirmation-entry win rate.
Measure the average maximum favorable excursion.
Measure the average maximum adverse excursion.
Measure how often the price breaks the level and returns inside the range.
Measure how often a failed breakout produces a meaningful reversal.
Measure performance by session.
Measure performance by volatility regime.
Measure performance by breakout size relative to ATR.
Then compare the expectancy.
You may discover something surprising.
Perhaps your best trades are not the strongest-looking breakouts.
Maybe your edge comes from moderate breakouts followed by shallow retests.
Maybe your best trades occur after long compression.
The first breakout of the session is excellent, but the fourth breakout is poor.
Maybe your strategy performs well on index futures but poorly on individual stocks because their liquidity characteristics differ.
This is where trading research becomes useful.
A recent SSRN study examining breakout strategies found that breakout performance can depend heavily on the surrounding regime and that volatility and liquidity-related filters can materially affect results. The authors also emphasize the importance of out-of-sample validation rather than assuming a calibrated rule will remain effective everywhere.
The practical lesson is more important than the study itself:
A breakout strategy is not a universal machine. It is a conditional process operating inside a specific market environment.
Your Head-Fake Checklist Should Eventually Become Automatic
After enough repetition, you should not need to ask every question consciously.
You should see the setup and immediately notice:
The level.
The approach.
The liquidity context.
The volatility.
The breakout candle.
The response.
The retest.
The invalidation.
The risk.
That is what a mature trading process looks like.
No more predictions.
Faster recognition of information that matters.
Frequently Asked Questions
What is the best way to avoid head-fake breakouts?
There is no single signal that is the most reliable method. Consider liquidity and volatility and put your invalidation before you get in. Look for acceptance above the breakout level, check the retest. The aim is to minimize exposure to weak breakouts, not to eliminate all bad trades.
Should I wait for a retest before entering a breakout?
A retest can improve information quality, but it is not mandatory for every strategy. Some strong breakouts do not provide clean retests. The important question is whether your entry gives you enough information relative to the risk you are taking.
Does high volume confirm a breakout?
No. High volume confirms more trading activity but not necessarily a continuation in direction. Volume is more informative when read in conjunction with price location, market structure, and what happens following the breakout.
Why do breakout trades fail so quickly?
Breakouts can trigger stop orders and breakout entries above or below a clear level. If there isn’t enough follow-through, price can come back to the prior range. Breakout traders can be trapped, and their departures might give more momentum to the reversal.
Is a failed breakout a good reversal setup?
It can be, but you have to prove it will fail, not forecast it will fail. A break, rejection, return to the old range and unsuccessful retest can provide for a far stronger reversal structure than merely fading an obvious level.
Should I avoid trading breakouts during news?
It is contingent upon your plan, instrument, and execution ability. News can influence the volatility, spreads, liquidity, and dependability of technical levels. If your strategy was designed during regular market conditions you should separately examine how it responds around large releases.
How much confirmation is enough?
The amount is not set in stone. Too little confirmation makes you open to head fakes. If you confirm too much, you’ll enter late and damage the reward-to-risk ratio. The optimum quantity is the least evidence that appreciably enhances your historical expectancy.
How can I improve my breakout strategy?
Make good notes of your break out transactions – separating immediate entries from confirmation based inputs. After a meaningful sample compare results by time of day, volatility, breakout size, retest behavior and market regime. Your trade data will inform you what filters are worth keeping.
Final Takeaway
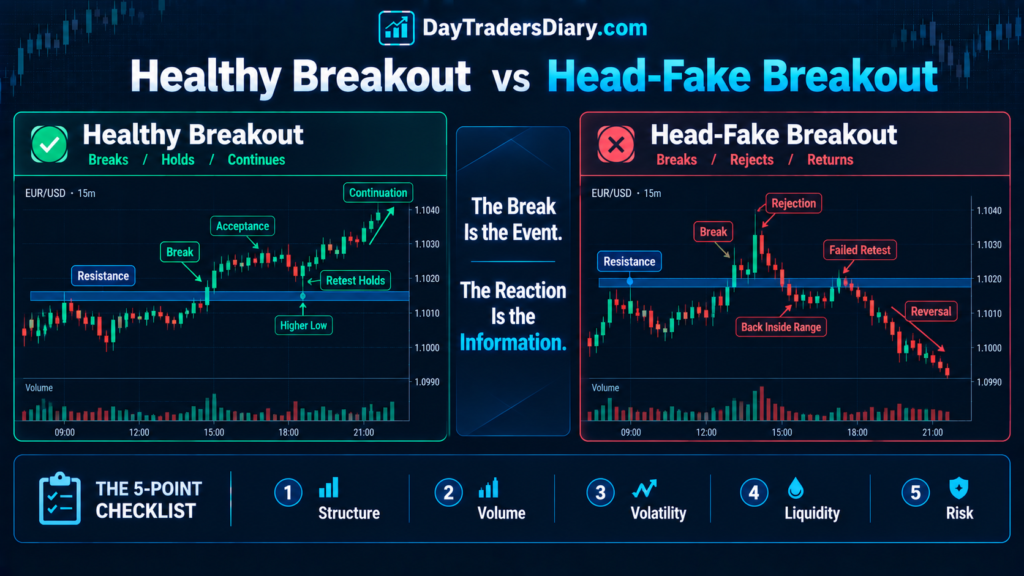
The biggest mistake with breakout trading is thinking the breakout itself is the signal.
It is not.
The breakout is an event.
What matters is what the market does in response to that event.
Price can trade over a resistance level without adopting it It can cause stops without creating continuation. It can print a large volume bar without creating directional control. It can move fast, without actually being strong.
The traders who consistently avoid head fakes are not necessarily better at predicting reversals.
They are better at waiting for information.
That is the real edge.
For your next 20 breakout setups, try one experiment.
Do not change your strategy.
Do not add five indicators.
Record what happened after the breakout.
Did the price accept the new level?
Did it immediately return to the range?
Did the retest hold?
Did the breakout candle become an exhaustion candle?
Did the failed breakout create a reversal?
Then compare those observations with your actual entries and results.
You may discover that the best improvement to your breakout strategy is not finding a better entry signal.
It is learning when the market has failed to prove your original idea.
And once you can consistently recognize that, the next step is to study your breakout exhaustion and failed-breakout patterns in greater detail before putting more capital behind the strategy.