
A trade can be technically profitable on your chart and still lose money because the trade you planned was not the trade you actually executed.
That difference is often dismissed as “a few pips of slippage.” But for an active day trader, a few pips repeated across entries, stop losses, partial exits, and news events can quietly change the expectancy of an entire strategy.
The problem becomes even more serious when traders measure slippage incorrectly.
They compare their requested entry with the fill price and stop there. That misses half the picture. Real slippage cost can occur at entry, at exit, on stop losses, during spread expansion, and through the interaction between execution delay and position size.
In this article I will show you a practical way to estimate true slippage cost in forex using your own trading data. The point isn’t to bitch about every terrible fill. The purpose is to see whether your strategy needs to change.
What Is Real Slippage Cost?
Slippage is the difference between the price you expected to receive and the price you actually received.
For a long position, suppose you intend to buy EUR/USD at 1.10000, but your order is filled at 1.10006. The entry slippage is 0.6 pips against you.
For a short position, suppose you intend to sell at 1.10000 but are filled at 1.09994. Again, the execution is 0.6 pips worse than planned.
The first important point is that slippage should be measured directionally.
A fill is not harmful since the price at which it was accomplished is different than the price requested. Sometimes you get positive slippage from traders. Thus, your analysis should discriminate between favorable and unfavorable execution rather than treating all differences as costs.
The second important point is that entry slippage alone does not tell you the real trading cost.
A more useful framework is:
Real execution cost = entry slippage cost + exit slippage cost + spread-related execution cost + commissions and other direct transaction costs
Depending on your broker, order type, and analysis method, you may already account for spread or commissions elsewhere. The key is to avoid counting the same cost twice.
For active traders, the more useful question is not, “How much did this trade slip?”
It is:
How much of my planned trade expectancy disappeared because actual execution differed from planned execution?
That is the number worth tracking.
Why Slippage Matters More Than Most Traders Realize
Let’s take a technique where we plan to stop at 10 pips and take profit at 20 pips.
The paper exchange is 1R for a shot at 2R.
Ok, now tell me you get in 1 pip worse than you wanted and your stop loss is hit 2 pips worse on a quick move.
Your actual loss is not 10 pips.
It is effectively 13 pips from the original decision point.
That is a 30 percent increase in execution-adjusted loss.
One trade does not necessarily matter. But imagine that this pattern repeats frequently. A strategy designed around small stops can be much more vulnerable to execution friction than a strategy with wider stops.
This is why traders should not evaluate slippage only in pips.
They should also evaluate it as a percentage of planned risk:
Slippage-to-Risk Ratio = Total Adverse Slippage ÷ Planned Initial Risk
If your planned risk is 20 pips and total adverse slippage averages 1 pip, your ratio is 0.05.
If your planned risk is 5 pips and the same 1 pip of slippage occurs, your ratio is 0.20.
The pip cost is identical.
The damage to the trade is completely different.
That distinction becomes essential when comparing strategies, timeframes, or trading sessions.
What Research and Market Structure Tell Us About Execution
Foreign exchange is a decentralized market in which trading activity occurs between dealers, electronic venues and financial hubs. The Bank for International Settlements FX statistics and market research help give a valuable framework for the scope and structure of global FX trading.
The practical lesson for the individual trader is that “the market price” is not always a single universally executable price. Liquidity, quotes and execution conditions may vary from venue to venue and provider to provider. This is particularly important in instances of frequent price changes.
The Bank for International Settlements has also done some study looking at electronic trading and FX market structure. The bigger lesson for day traders: Execution quality depends on liquidity, order flow, market design, and the conditions at the time the order hits the market.
For traders working with highly liquid instruments, exchange-traded markets also provide useful lessons about liquidity and execution. CME Group’s market education resources explain core concepts around liquidity and market participation that apply to understanding why fast markets can produce a gap between an intended price and an actual fill.
What implications does this have for trading?
In most cases, slippage is not random as traders believe.
It tends to concentrate around certain conditions:
High effect economic releases.
Session open and fast liquidity changes.
Sudden volatility expansion.
Thin liquidity periods.
Large orders relative to immediately available liquidity.
Aggressive market orders.
Stop-loss activation during a fast directional move.
Your goal is to identify which of these conditions affects your own strategy.
The Four Numbers You Need Before You Can Estimate Real Slippage
Every serious execution review should start with four questions.
The first is the planned entry price. This is the price your trading plan expected before the order was sent.
The second is the actual entry fill.
The third is the planned exit or stop price.
The fourth is the actual exit fill.
For each trade, calculate adverse execution separately.
For a long trade:
Entry slippage = Actual entry − Planned entry
For a short position:
Entry slippage = Entry planned – Entry filled
This keeps the negative slippage positive in any direction.
For exits the calculation depends on kind of exit, target, discretionary close or stop loss. The principle remains the same:
Measure the difference between the price you reasonably planned to receive and the price you actually received, then adjust the sign so that unfavorable execution is positive.
Once you have that, calculate:
Total adverse slippage = Adverse entry slippage + Adverse exit slippage
Then convert the pip value into money.
For example, suppose your EUR/USD position size makes each pip worth $10.
If total adverse slippage is 1.8 pips:
Real slippage cost = 1.8 × $10 = $18
That is the direct monetary cost.
But the more useful calculation comes next.
Measure Slippage in R, Not Just Dollars
Suppose you risk $200 per trade.
The $18 execution cost above represents:
$18 ÷ $200 = 0.09R
Now imagine this happens on 100 trades.
If the average adverse slippage cost is 0.09R per trade, your strategy is giving up approximately 9R over those 100 trades before considering whether positive slippage offsets any of that cost.
That can materially change performance.
A strategy with an expected edge of 0.12R per trade is far more vulnerable to execution friction than a strategy with an expected edge of 0.60R per trade.
This leads to an important concept:
Execution-adjusted expectancy = Gross strategy expectancy – Average execution cost (in R)
Let’s say your backtested or projected expectancy is 0.35R/trade.
Average slippage + friction of execution = 0.08R.
Your execution-adjusted expectancy is approximately:
0.35R − 0.08R = 0.27R
That is a more realistic measure of the edge you are actually trading.
Why Forex Slippage Is More Complicated Than a Bad Fill
The structure of the FX market makes execution analysis more important than many retail traders realize. Spot FX is decentralized and fragmented, with trades executed through different dealer relationships, electronic venues, and liquidity arrangements rather than through one centralized exchange. Recent BIS analysis also notes that a large share of customer trading is handled within dealers’ own liquidity pools.
For a day trader, this means you should be careful about comparing your fill to a generic chart price and immediately calling the difference slippage.
The chart you see may be based on a different price feed, while your broker or liquidity provider may have been quoting a different executable bid or ask at that moment.
A more accurate process compares your actual fill with the executable price available to you when the order decision was made, whenever your platform provides that information.
That distinction can save you from blaming slippage for what was actually normal spread or feed variation.
The Three Types of Slippage You Need to Track
The first is entry slippage.
This is the difference between your planned executable entry and your actual fill.
The second is exit slippage.
This occurs when you close a trade at a worse price than expected. It can happen with market exits, partial closes, and rapidly changing prices.
The third is stop-loss slippage.
This deserves its own category because it behaves differently from normal entry slippage. A stop order can become a marketable order once triggered, meaning the actual fill may occur beyond the stop level if the market moves rapidly or available liquidity is insufficient at that price.
Do not combine all three categories immediately.
A strategy might have excellent entries but poor stop execution during high-volatility events. If you average everything into one number, you lose the diagnostic value.
A Practical Formula for Real Slippage Cost
Negative execution in pips per trade.
At that moment:
Net negative pips slippage = Adverse entry, exit, and stop slippage – Favorable slippage
Hence, real slippage cost = net unfavorable slippage * pip value * size multiplier.
If your platform reports the monetary P&L directly, you can identify account currency costs.
Best comparison:
Slippage Cost as % of Planned Risk = Real Slippage Cost ÷ Planned Monetary Risk × 100
This shows how much execution affected the trade compared to your risk threshold.
Example
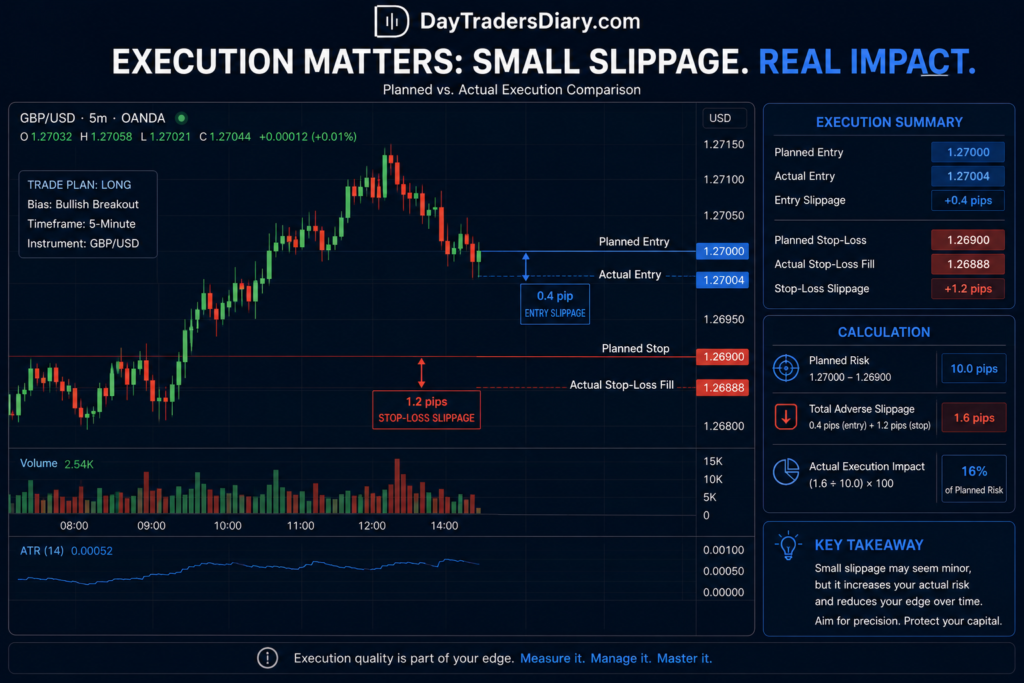
You want to trade GBP/USD with:
Entry: 1.2700 0
1.26900 Planned Stop
Target risk: 10 pips
Actual entry: 1.27004
Real stop fill: 1.26888
Entry slippage: 0.4 pip
Stop slippage: 1.2 pips
Total negative slippage 1.6 Pips
Your planned risk was 10 pips, so:
1.6 ÷ 10 = 0.16
Your execution friction added the equivalent of 16 percent of your original planned risk.
That is a meaningful difference.
If the same 1.6-pip cost occurred on a trade with a 40-pip stop, the effect would be only 4 percent of planned risk.
This is why fast scalping systems are often much more sensitive to slippage than wider-stop intraday strategies.
The Slippage-to-Edge Ratio
Here is a measurement that deserves more attention.
Calculate:
Slippage-to-Edge Ratio = Average Execution Cost in R ÷ Average Strategy Expectancy in R
Suppose your strategy has an average expectancy of 0.20R.
Your average total execution cost is 0.05R.
Your slippage-to-edge ratio is:
0.05 ÷ 0.20 = 25 percent
You are giving up one-quarter of your theoretical edge to execution.
Now, imagine another strategy has a 0.60R expectancy with the same 0.05R execution cost.
The second strategy loses only around 8.3 percent of its edge.
This tells you something important.
The same broker and the same amount of slippage can be acceptable for one strategy and destructive for another.
Before changing brokers or blaming execution, calculate how high the cost is relative to the edge you are trying to capture.
Measure the Difference Between Backtest and Live Execution
This is one of the most useful exercises for traders who have a strategy that looked excellent in testing but weakened in live trading.
For each trade, record:
The theoretical entry price.
The actual entry price.
The theoretical stop.
The actual stop fill is triggered.
The theoretical target.
The actual exit price.
The gross result in R based on theoretical execution.
Actual result in R after execution.
Then compute:
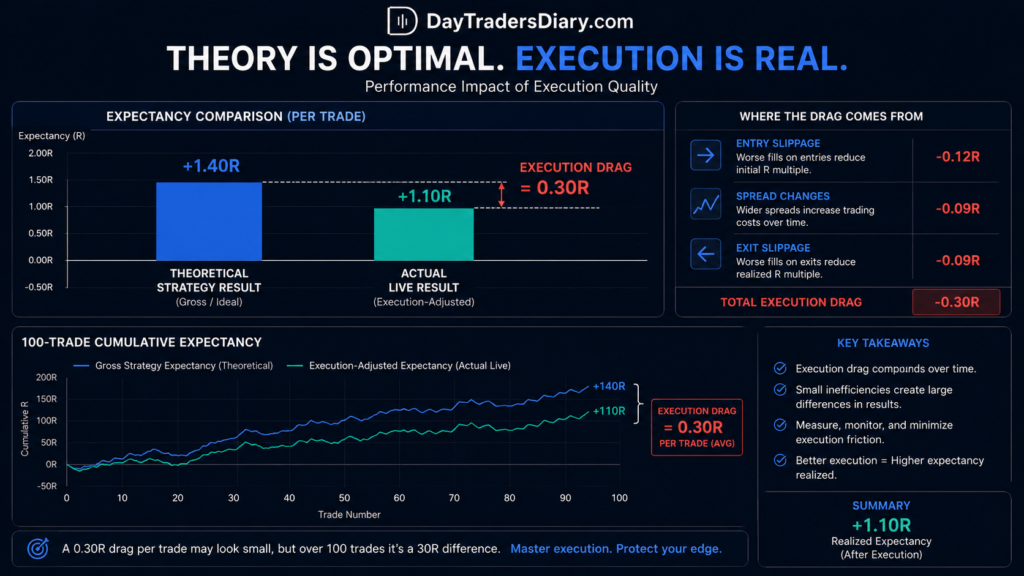
Execution Drag = Theoretical R – Actual R
Let’s say your strategy would have made +1.4R in theory.
In reality the result was +1.1R due to entry slippage, spread adjustments and a poorer exit.
The execution drag is:
1.4R − 1.1R = 0.3R
Now repeat this over 50 or 100 trades.
The average execution drag is far more informative than complaining about isolated bad fills.
You may discover that your live edge is still strong.
Or you may discover that a strategy with a paper expectancy of 0.25R becomes nearly breakeven after real-world execution.
That is not a small technical detail. It is a strategy-design problem.
Separate Slippage From Spread
This is where many forex traders make inaccurate calculations.
Suppose EUR/USD is quoted:
Bid: 1.10000
Ask: 1.10010
The spread is 1 pip.
If you buy at the market, you naturally transact at or near the ask. If you compare your 1.10010 fill with the bid shown on a chart and call the entire 1 pip difference slippage, you are measuring incorrectly.
Execution cost comes in two different forms: slippage and spread.
They should be defined independently in your analysis.
A working model is:
Total trading friction = Spread cost + Commission + Slippage cost + Other direct fees
For a complete round-trip analysis, estimate each component independently whenever possible.
This prevents the common mistake of double-counting spread.
The Hidden Cost of Slippage on Reward-to-Risk
Slippage not only makes losing trades larger.
It can also reduce the reward remaining in a trade.
Suppose your planned long trade is:
Entry: 1.20000
Stop: 1.19900
Target: 1.20200
The planned risk is 10 pips, and the reward is 20 pips.
Planned reward-to-risk ratio: 2:1.
Now you enter 3 pips late at 1.20030, but keep the same stop and target.
Your actual risk becomes 13 pips.
Your remaining reward becomes 17 pips.
Your new reward-to-risk ratio is:
17 ÷ 13 = 1.31
The chart may still look attractive.
The trade is no longer the same.
This is closely connected to the problem of entry delay risk. When the price moves while you hesitate or while execution is delayed, the deterioration should be measured against your original planned risk.
As a rule of thumb, specify the maximum allowable degradation.
I’m going to be a mom.”
If the adverse entrance slippage or delay is more than 20% of the planned beginning risk, then re-evaluate the transaction rather than accepting the fill automatically.
The exact percentage depends on the strategy. The important point is to define the rule before the pressure of a fast market appears.
Build a Slippage Profile by Market Condition
Average slippage is useful.
Conditional slippage is better.
Do not ask only, “What is my average slippage?”
Ask:
What is my average slippage during the London session?
What happens around the New York Open?
How does execution change during major economic releases?
Do stop losses slip more than normal market exits?
Does my slippage increase after large impulsive candles?
Does one currency pair create more execution drag than another?
This is where a session heatmap for entry timing can become more useful than simply studying volatility and trade performance.
Add execution quality to the heatmap.
You might discover that your strategy has strong gross expectancy during a particular session, but loses a significant part of that edge because fills deteriorate.
Alternatively, a quieter session might produce slightly lower gross returns but significantly better execution-adjusted expectancy.
That second environment is superior.
Create an Execution Heatmap
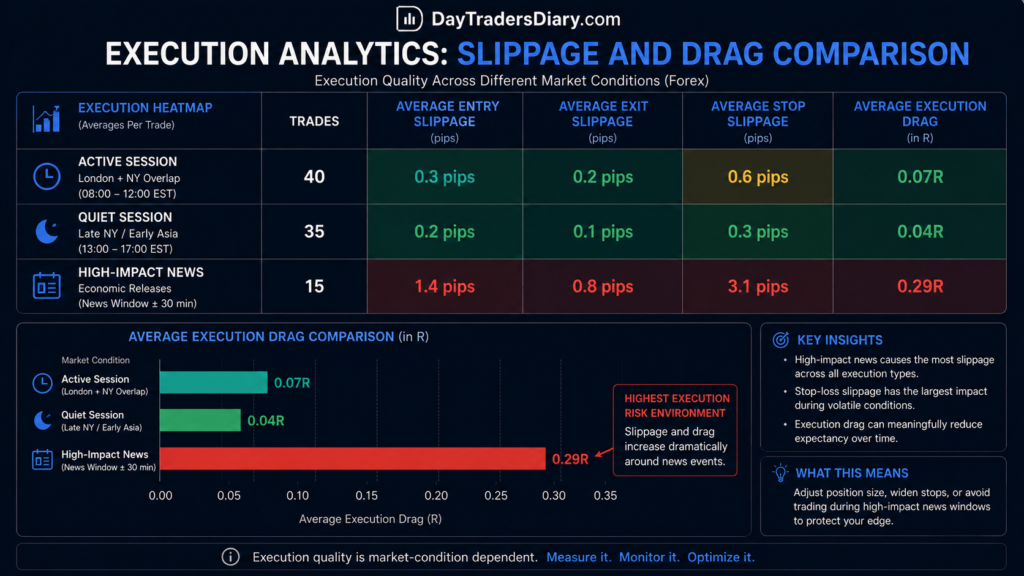
A useful execution heatmap can include:
ConditionTradesAvg. entry slipAvg. exit slipAvg. stop slipAvg. execution drag
Active session 40 0.3 pips 0.2 pips 0.6 pips 0.07R
Quiet session 35 0.2 pips 0.1 pips 0.3 pips 0.04R
High-impact news 15 1.4 pips 0.8 pips 3.1 pips 0.29R
The numbers are only an illustration, but the structure matters.
You are trying to discover where execution becomes materially different.
Research from the BIS highlights the fragmented nature of FX execution and the wide range of execution arrangements available to market participants. BIS research also shows that liquidity conditions and the cost of liquidity can change with dealer constraints and market conditions.
For a trader, that supports a practical conclusion: do not assume execution quality is constant just because your broker, position size, and trading strategy remain the same.
Why Stop-Loss Slippage Deserves Special Attention
Sometimes you can control entry slippage.
You can place limit orders, wait for a retracement, prevent chasing or cancel an order if the price moves too far.
Stop loss slippage is another thing.
It usually happens when you need protection the most.
Imagine a 15-pip stop.
Your strategy is designed to lose exactly 1R if the setup fails.
During a rapid market move, the stop is triggered but filled 5 pips beyond the intended level.
Your actual loss is now 20 pips.
If you continue calculating every losing trade as negative 1R in your journal, you are hiding execution risk.
Record the actual result.
Then separately record the planned loss.
The difference is your stop execution deviation.
But over time this might tell you whether your stops are structurally sound but execution sensitive, or if you are continuously exposing yourself to times where liquidity is too thin for your approach.
A Better Way to Analyze News Slippage
Many traders write “news caused slippage” in the journal.
That is too vague.
Instead, classify the timing.
Was the order entered before the release?
During the first minute?
One to five minutes later?
After the initial spike but before the stabilization?
Also, note whether the trade was:
A market entrance.
An entry halt.
Limit admission.
A stop-loss.
Market fall.
The reason this is important is that different order types can have different execution behaviors.
If you already study how to quantify news volatility before entry, add a slippage column to that framework.
High volatility is not automatically bad.
High volatility, combined with execution drag that consumes most of your expected edge, is the real problem.
Limit Orders Can Reduce Slippage, but They Create a Different Problem
The usual reaction to slippage is:
Limit orders only.
It may provide more price certainty, but it can also result in missed trades and selection bias.
Suppose your strategy needs to buy a breakout.
A limit order placed at the previous price may never fill once momentum begins.
Now your backtest includes every breakout winner, but your live execution captures only the trades that retrace.
The result can be very different.
The question is not whether market orders or limit orders are universally better.
The question is:
Which order type produces the best execution-adjusted expectancy for this specific setup?
Try both of them.
The market order might see average execution drag of 0.05R but might collect the bulk of genuine signals.
A limit order can lower execution cost but may lose enough successful trades to reduce overall expectation.
Only the data can resolve that trade-off.
Position Size Changes the Meaning of Slippage
A one-pip slip does not hurt every account equally.
As position size increases, the monetary cost rises.
This is why traders often encounter a new problem when they begin scaling.
The strategy still works.
The execution model may no longer work as efficiently at the larger size.
Before increasing exposure, estimate:
Expected monthly slippage cost = Average slippage cost per trade × Expected number of trades
Then compare that number to your current size and intended future size.
This is where most traders should revisit the Position Size Calculator on DayTradersDiary.com. Position size should be based on actual stop distance and defined monetary risk, not on a fixed lot size chosen because it “felt comfortable” at a smaller account balance.
Scaling without checking execution cost can create an unpleasant surprise.
You can improve your gross trading performance while your net performance improves much less than expected.
The Relationship Between Slippage and Small Stops
The smaller the planned stop, the more dangerous a fixed amount of slippage becomes.
A 1-pip execution cost on a 50-pip swing trade may be insignificant.
The same 1 pip on a 4-pip scalp is 25 percent of the planned risk.
This creates what I call an execution sensitivity problem.
Before trading a very tight stop strategy, calculate:
Execution Sensitivity = Average Adverse Execution in Pips ÷ Planned Stop in Pips
If the result is consistently high, your strategy may simply be operating with too little room for the actual market environment.
The answer is not automatically to widen the stop.
Widening the stop changes the position size and possibly the trade structure.
The correct response is to test whether the strategy can maintain positive execution-adjusted expectancy with realistic fills.
Journal the Planned Price, Not Just the Fill
Most trade journals begin after execution.
That is a problem if you want to measure slippage.
You need to record the original decision.
For every trade, your Trade Journal Template should ideally capture:
Intended entry price.
Real Entry Price.
Scheduled stop.
If stopped, actual stop fill.
Targeted. Planned.
Real exit.
Order Type
Entry Spread if available.
Market situation.
Session.
Proximity to news.
R planned.
Actual R.
Execution drag in R.
The most important field is often the one traders forget:
Why did the actual execution differ from the plan?
Possible categories include:
Price moved before order submission.
Platform/connection delay.
Market normal movement.
Expansion of spread.
News volatility
Halt execution.
Reluctance to manual.
Late discretionary admission.
These categories isolate market friction from the behavior of the trader.
That distinction is critical.
Not every bad fill is slippage.
Sometimes you chased the trade.
How to Review Slippage Every Month
At the end of each month, do not focus only on total pips or total profit.
Review your execution data.
Calculate your average adverse entry slippage.
Calculate average adverse exit slippage.
Calculate average stop-loss slippage.
Calculate favorable slippage separately.
Then calculate the average net execution drag in R.
Next, divide the data by setup.
You may find that one setup has nearly zero execution problems while another loses 0.12R per trade because entries occur during rapid momentum.
Then divide by session and volatility regime.
This process often reveals a solution that is much simpler than changing your entire strategy.
You only need to avoid chasing the third breakout.
You should not enter within seconds of a major release.
Perhaps your smallest stop strategy should only trade during periods with stable execution.
The solution should come from the data.
Do Not Confuse Broker Quality With Strategy Fragility
A broker can affect spreads, liquidity access, execution policy, and the prices available to you.
But changing brokers does not automatically solve an execution-sensitive strategy.
If your method requires entering after a five-pip impulse with a four-pip stop during high-volatility conditions, even excellent execution may not save the model.
Before blaming the broker, test the strategy under realistic assumptions.
At the same time, do not ignore persistent evidence of poor execution.
If your slippage profile is consistently worse than expected under normal market conditions, compare your own execution data across providers where possible.
The comparison should use identical or closely comparable conditions.
Do not compare one broker during a quiet week with another during a major volatility event.
Compare the data, not the marketing claims.
Scaling Capital Requires an Execution Edge Too
Finding a trading edge is only half the job.
You also need to know whether that edge survives larger capital and stricter risk constraints.
This is one reason evaluation programs can be useful for traders who have already validated their strategy. A professional evaluation account tests whether you can reproduce your process under defined loss limits and risk rules.
The5ers can be one option for traders whose strategy fits its current program structure and trading rules. It is also worth comparing alternatives such as FTMO and other proprietary trading programs, because daily loss limits, news rules, holding requirements, execution conditions, and scaling models can differ.
The key point is not that a funded account removes the need for execution analysis.
It makes that analysis more important.
If your average stop-loss slippage is 0.15R and you trade close to a daily loss limit, a sequence of fast losses can consume more risk capacity than your theoretical model predicts.
Before starting an evaluation, calculate your worst normal execution scenario, not just your average trade.
Ask whether your risk model still works after realistic execution friction.
If your edge has been validated, your execution process is documented, and the rules of the program fit your actual trading style, then considering a The5ers evaluation account can be a logical step toward scaling rather than simply increasing personal account exposure.
Frequently Asked Questions
How do you calculate real slippage cost in forex?
Calculate the bad difference between your anticipated executable price and actual fill at entrance and exit. Convert the total difference to pips. Multiply the total difference by the pip value of your position. Divide the cost by your planned risk . This will indicate slippage in R, which is more meaningful to compare .
What is considered normal forex slippage?
There is no magic figure. Typical slippage will vary depending on the currency pair, trading session, volatility, order type, broker execution and news conditions. A better criterion is your own past average in like circumstances.
Is spread the same as slippage?
No. Spread is the difference between the bid and ask price. Slippage is the difference between your expected executable price and the actual fill. They should be measured separately to avoid double-counting transaction costs.
How does slippage affect the risk-reward ratio?
Adverse entry slippage can increase the distance to the stop and reduce the distance remaining to the destination. This can have a meaningful effect on the real reward/risk ratio, especially for strategies with tight stops.
Can limit orders eliminate slippage?
Limit orders offer price protection . Limit orders should never fill at a worse price than the limit you choose , but they may not fill at all . The cost can move from price decay to opportunity cost.
Why is stop-loss slippage often worse?
In a rapid market, when a stop is triggered, there may not be liquidity at the targeted stop price or the market may have already moved past that level. The actual fill may consequently be at a worse price.
Should slippage be included in backtesting?
Yes. A realistic strategy evaluation should include assumptions for spread, commissions, and expected slippage. Better still, test different execution assumptions, including normal and adverse conditions.
How can I reduce slippage in day trading?
Avoid late entries. Define maximum allowable entry degradation. Review order types. Avoid scenarios where your data reveals high execution drag. Size positions correctly. If you do these things you will eliminate unnecessary slippage. The goal isn’t to remove all slippage, which is impossible, but to remove execution friction from eating away at the edge of the approach.
Final Takeaway
If you think about slippage as an occasional nuisance rather than a measured aspect of your trading system, it can be dangerous.
The simplest way is the best:
Measure the trade you desired.
Measure the trade you actually received.
Calculate the difference in pips, money, and R.
Then identify where that difference comes from.
You may discover that your broker is not the main problem. Your entries may be late. Your stop distances may be too tight for the volatility you trade. Your strategy may work during normal sessions but collapse when execution conditions deteriorate.
For your next 30 trades, record planned entry, actual entry, planned exit, actual exit, total execution drag, and execution drag as a percentage of planned risk.
Do not judge the results trade by trade. Review the pattern.
That evaluation can expose whether slippage is a little cost of doing business or a hidden element that is slowly killing your expectancy.
Next, read: Review the DayTradersDiary.com guide on How To Quantify News Volatility Before Entry to link volatility circumstances to the execution risk you are assessing.