
Every trader has been there: the breakthrough that seemed perfect, until it wasn’t.
The price cracks resistance on momentum. Candles stretch. Social media explodes with joy. And in a few minutes, the move completely reverses. Latecomers get caught, early buyers saw their riches evaporate betting momentum would go on forever.
The frustrating part is that breakout failures rarely happen without warning. The market usually leaves subtle clues that buying or selling pressure is running out. The problem is that most traders spend their time learning to identify breakouts rather than recognizing when a breakout is reaching exhaustion.
That distinction is between traders who always protect profits and traders who always give them back.
This article will focus on determining breakout tiredness based on practical market reasoning rather than recipe-book patterns. These are the findings that only become apparent after you’ve looked at hundreds of charts, studied losing trades, and figured out why momentum inevitably dies. Instead of asking, “Is this breakout real?” experienced traders start asking, “How much fuel is really left?
Why Breakout Exhaustion Matters More Than Breakout Confirmation
Most educational content teaches traders to wait for confirmation before entering a trade. While confirmation has value, it creates another problem.
By the time confirmation arrives, many traders are entering near the point where the strongest participants are already taking profits.
Institutions rarely chase extended moves. They often initiate positions before obvious breakouts become visible. Retail traders frequently enter after several momentum candles have already traveled a significant distance.
The outcome is predictable.
Liquidity for exiting profitable deals is provided by late buyers.
Understanding breakout depletion might assist solve questions such as:
How much momentum is left?
Is fresh participation entering the market?
Is volatility growing organically or is it getting emotional?
Are professional traders going to add to holdings or cut exposure?
Those inquiries are far more valuable than merely assessing whether the price has crossed a support or resistance level.
If you’ve already read our guide on identifying quality momentum moves, this topic naturally builds upon those concepts because strong breakouts and exhausted breakouts often look almost identical during the first few minutes.
What Research Says About Momentum and Breakout Failure
There are several renowned studies that help put important context around why breakthrough tiredness develops.
Research published by CME Group shows that volatility expansion generally clusters around large market events and then slowly mean-reverts. Markets cannot remain under severe volatility for long, as liquidity normalizes with time.
The Bank for International Settlements has also studied and found that liquidity conditions have a large impact on price continuation. In instances when liquidity is scarce, market moves may appear to be robust but are in fact becoming progressively fragile.
National Bureau of Economic Research academic research has shown time and time again that momentum benefits fade when participation and crowd positioning go beyond sustainable levels.
For active day traders, these results have a concrete meaning.
Price movement alone does not indicate strength.
Participation quality matters more than candle size.
Large candles generated by aggressive late buying often signal the onset of exhaustion rather than the continuation that many traders expect.
The First Question Experienced Traders Ask
Instead of asking whether the price broke resistance, experienced traders ask another question.
Who is still willing to buy here?
Every breakout requires new participants.
Without fresh buyers, the price cannot continue rising regardless of how impressive previous candles appear.
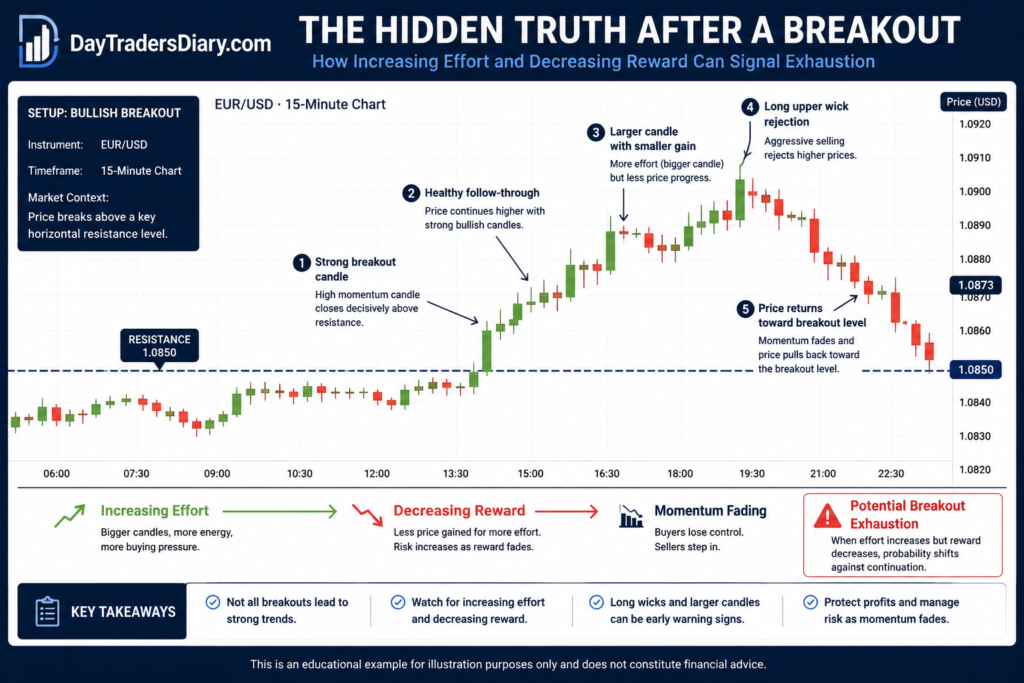
Imagine EUR/USD breaking above London session highs.
The first breakout candle closes strongly.
The second candle closes slightly higher.
The third candle becomes much larger but closes near its midpoint.
The fourth candle barely makes a new high, despite traveling 40% farther than the earlier candles.
Many traders interpret this as a sign of increasing strength.
An experienced trader sees increasing effort with decreasing reward.
That is often the earliest signal of breakout exhaustion.
A Practical Framework for Judging Breakout Exhaustion
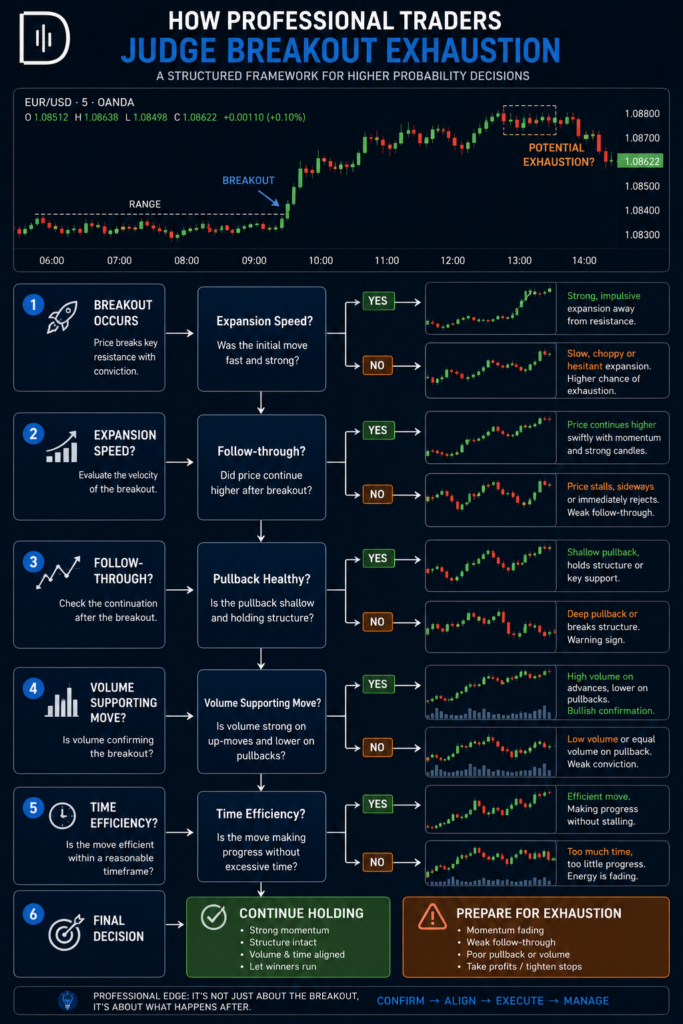
Construct a decision-making framework based on multiple observations instead of one signal.
First, calculate the rate of expansion.
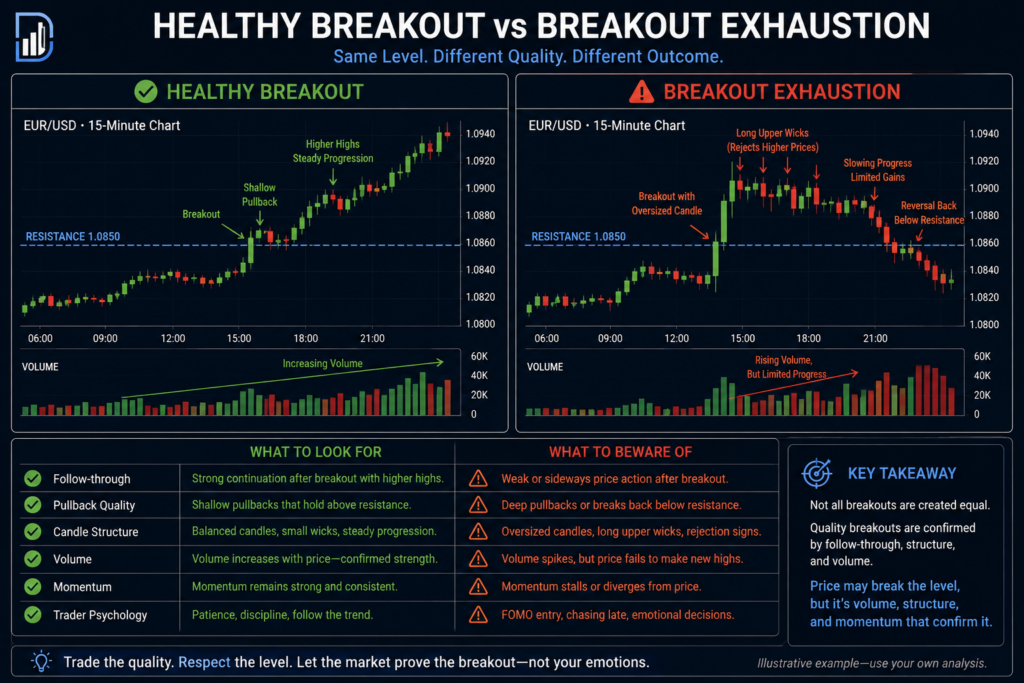
Health outbreaks happen smoothly, not chaotically. If the candle has already moved and then suddenly doubles in size, emotion usually takes over from methodical buying.
Watch for follow-through next.
Strong breakouts continue to close higher. Over-exhausted breakouts cause longer wicks, slower shuts, overlapping candles and reluctance just after expansion.
Then evaluate pullbacks.
Healthy momentum pulls back shallowly before continuing. It’s hard to retrace exhausted moves even a bit.
Lastly, evaluate involvement.
If your platform offers you with futures volume or reliable tick volume, compare current involvement to prior breakout periods.
“Frequent volume increases with little additional price progress are usually a sign of distribution, not accumulation.
No one thing ensures weariness.
But together they create probabilities that become remarkably consistent over hundreds of trades.
The Hidden Clue Most Traders Ignore
Many traders focus only on price.
Professional traders pay equal attention to time.
Suppose a breakout normally reaches twenty pips within fifteen minutes.
Today, after reaching eighteen pips, the price spends another twenty-five minutes fighting for only three additional pips.
Momentum has considerably slackened off.
While the price may continue to make marginal highs, the effort expended by buyers is so much higher for far less profit.
Time becomes proof.
Markets seldom hide tiredness.
They express it differently.
Sometimes they stop moving vertically and begin moving sideways.
Other times, they produce increasingly violent candles without achieving meaningful progress.
Both situations often indicate that breakout energy is fading.
Why Emotional Breakouts Often Fail
One of the biggest misconceptions is believing that stronger emotions create stronger trends.
Reality is usually more complicated.
When headlines, economic releases, or social media excitement attract large numbers of late participants, emotional buying often peaks near the end of a move rather than at the beginning.
Experienced traders become cautious when they notice:
Very large candles appear after several consecutive bullish candles.
Rapid expansion immediately after retail enthusiasm increases.
Repeated failures to hold fresh highs.
Long upper shadows are developing despite continued buying attempts.
These observations suggest demand may be becoming exhausted instead of expanding.
When Breakout Exhaustion Is Not Actually Exhaustion
One dangerous mistake is to confuse consolidation with weakening.
Markets typically pause before moving forward.
How do you tell the two apart?
Healthy pauses tend to maintain structure.
Higher lows stay in place.
Selling pressure is still somewhat under control.
Instead of faltering, momentum indicators stabilized.
Price still above crucial breakout levels.
True weariness is destructive of structure rather than preservative of it.
Support is not working consistently.
Attempts to recover are fading.
The sense of direction is lost and volatility increases.
Knowing the difference can help traders avoid the premature closing out of good trades.
A Forex Example That Happens Almost Every Week
Imagine GBP/USD breaking above an important resistance level shortly after London opens.
The first breakout covers fifteen pips.
The second reaches another twelve.
The third pushes only six additional pips despite becoming the largest candle of the sequence.
The next candle immediately rejects higher prices.
Volume increases.
Price closes back inside the previous range.
Many breakout traders continue buying because the price technically remains above resistance.
A more experienced trader sees something different.
Each new push requires more buying pressure while producing less progress.
The market is becoming less efficient.
That declining efficiency often marks breakout exhaustion.
The Relationship Between Liquidity and Exhaustion
Breakout exhaustion is ultimately a liquidity problem.
Every trend depends on matching buyers and sellers.
As trends mature, willing buyers become increasingly difficult to find.
Professional traders begin scaling out.
Countertrend participants gradually become more active.
Liquidity moves.
The price can still make new highs but it gets harder and harder to hold such highs.
When you understand liquidity then breakout analysis is not pattern recognition it is auction logic.
Instead of watching candles, you begin observing the balance between aggressive buyers and available sellers.
That perspective dramatically improves trade management.
Executing Around Breakout Exhaustion
Analysis is vital but so is execution.
Many traders perceive weariness but still lose money because they do lousy executions. “Don’t buy just because the price looks insurmountable.
Look instead for the places where momentum is slowing, where follow-through is weakening, and where reward no longer justifies the risk.
Sometimes the highest-probability decision is to do nothing.
That is difficult psychologically because inactivity feels unproductive.
In reality, avoiding low-quality entries often contributes more to long-term profitability than finding one extra winning trade.
This is also where many traders miscalculate exposure. Using the Position Size Calculator on DayTradersDiary.com helps remove guesswork by matching position size to the actual stop distance rather than emotion.
Building a Journal Around Breakout Exhaustion
Most trading journals record wins and losses.
Few record the quality of breakout conditions.
That is a missed opportunity.
After every breakout trade, document how many expansion candles occurred before entry.
Candle size compared to previous volatility.
Indicate whether the price accelerated or slowed following the breakout.
How long did momentum last until it stalled?
Back to screenshots in 1 month.
The patterns appear soon.
You may discover your best trades occur during the first breakout attempt, while your worst trades consistently happen after the fourth momentum candle.
That insight is impossible to discover without a structured review.
The downloadable Trade Journal Template on DayTradersDiary.com provides an excellent framework for consistently tracking these observations.
Scaling an Edge Beyond Personal Capital
Eventually, traders face another limitation.
Capital.
A trader with a genuine edge in recognizing breakout exhaustion can still experience slow account growth simply because position sizing remains limited.
This explains why many experienced traders eventually evaluate proprietary trading firms.
Programs from firms such as The5ers, FTMO, FundedNext, and Topstep allow disciplined traders to demonstrate consistency before accessing larger trading capital.
Among these, The5ers has built a strong reputation for flexible evaluation models, opportunities for scaling, and trader-focused account growth. The evaluation process is not a shortcut or a guarantee of success. It simply rewards traders who already possess repeatable decision-making and disciplined execution.
If your breakout strategy has been profitable over a meaningful sample of trades, exploring a The5ers evaluation account may be a logical next step toward increasing capital without substantially increasing personal financial exposure.
Frequently Asked Questions
What is breakout exhaustion in forex?
Breakout exhaustion is when a breakout is starting to run out of gas as the participation in buying or selling wanes. Price can go to new highs and new lows. But the continuation becomes harder and harder.
How do you identify breakout exhaustion early?
Look for: reduced follow through, Smaller gains, larger candles, Longer wicks, Momentum decreasing, More work with little price improvement.
Is breakout exhaustion the same as a false breakout?
No. False breakouts fail rapidly once they break through support or resistance. Breakout exhaustion could still produce minor fresh highs before eventually reversing or consolidating.
Should traders fade every exhausted breakout?
Nope. The more tired you are the more likely you are to reverse. You should combine it with market structure, liquidity, session timing and risk management before taking a countertrend position.
Which markets show breakout exhaustion most clearly?
Fatigue characteristics are different across forex, index futures and very liquid stock indices, when changes in liquidity are reflected in price behavior and participation.
Can indicators identify breakout exhaustion?
Indicators can be useful for analysis, but price structure, volatility, time and participation usually give earlier and more reliable information than lagging indicators alone.
Final Thoughts
You learn to judge breakout tiredness and that changes your view of momentum.
You learn to judge the level of involvement behind each move rather than chasing every new high or low. You learn to not confuse excitement with strength, and to know when markets are calling for caution, not commitment.
Your challenge over the next twenty trades is simple.
Do not focus on whether the breakout worked.
Focus on when momentum began fading. Record the first clue that suggested buyers or sellers were running out of conviction. That single habit will improve your timing far more than searching for another indicator.
For your next read, explore DayTradersDiary.com’s article on momentum confirmation and trade management to strengthen the framework you’ve built here.