
One of the most frustrating experiences in trading is watching a setup play out exactly as expected, only for your stop-loss to get hit.
The trade idea was right.
The direction was right.
The analysis was right.
The stop placement was wrong.
I’ve seen this happen countless times when reviewing trader journals. A trader identifies a strong trend, enters at a logical level, and places a stop-loss based on a random number of pips.
Ten minutes later, normal market noise takes them out.
An hour later, the market moves directly back to its original target.
The problem wasn’t the setup.
The problem was using a stop-loss that ignored market volatility.
This is where the Average True Range, better known as ATR, becomes one of the most practical tools a trader can use.
Not because it predicts direction.
It doesn’t.
But it measures how much the market is actually moving.
In this guide, you’ll learn a step-by-step ATR stop placement method, how professional traders use ATR for stop loss decisions, the best ATR trailing stop settings for different conditions, and how to integrate ATR into a complete risk management framework.
Why Most Stop Losses Fail
Most traders place stops based on round numbers.
Ten pips.
Twenty pips.
Thirty pips.
The market doesn’t care.
Volatility changes constantly.
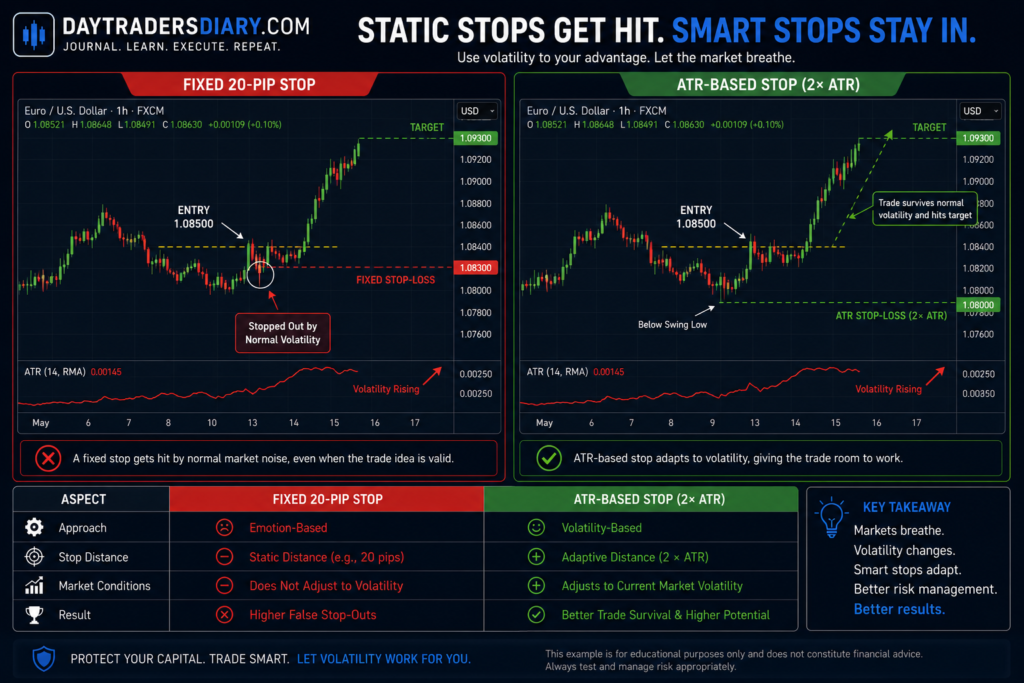
A 20-pip stop may be huge during quiet Asian session trading but insignificant during a major London breakout.
ATR was established by the famed expert J. Welles Wilder in his book New Concepts in Technical Trading Systems to quantify market volatility instead of price direction.
Today, ATR remains one of the most widely used volatility tools among professional traders.
It’s straightforward enough.
Markets expand and decrease.
Adjust stop losses accordingly.
Research-Backed Insight: Why Volatility-Based Stops Work
Research published by the CFA Institute has repeatedly emphasized that risk-adjusted performance often improves when traders adapt position sizing and stop placement to changing market volatility.
The Chicago Mercantile Exchange (CME) also highlights volatility measurement as a critical component of professional risk management.
For active day traders, this means one important thing.
Markets should determine the stop distance.
Not emotions.
ATR provides an objective way to accomplish that.
Instead of asking:
“How many pips should I risk?”
You begin asking:
“How much room does the market normally need?”
That shift alone changes how traders think about risk.
What ATR Actually Measures
ATR calculates the average price movement over a specified number of periods.
The standard setting is 14 periods.
If EUR/USD shows an ATR reading of 0.0012 on a one-hour chart, that means the pair has averaged roughly 12 pips of movement per candle over the previous 14 hours.
ATR does not predict where the price will go.
It measures how far the price tends to move.
That distinction matters.
The indicator is designed for risk management rather than signal generation.
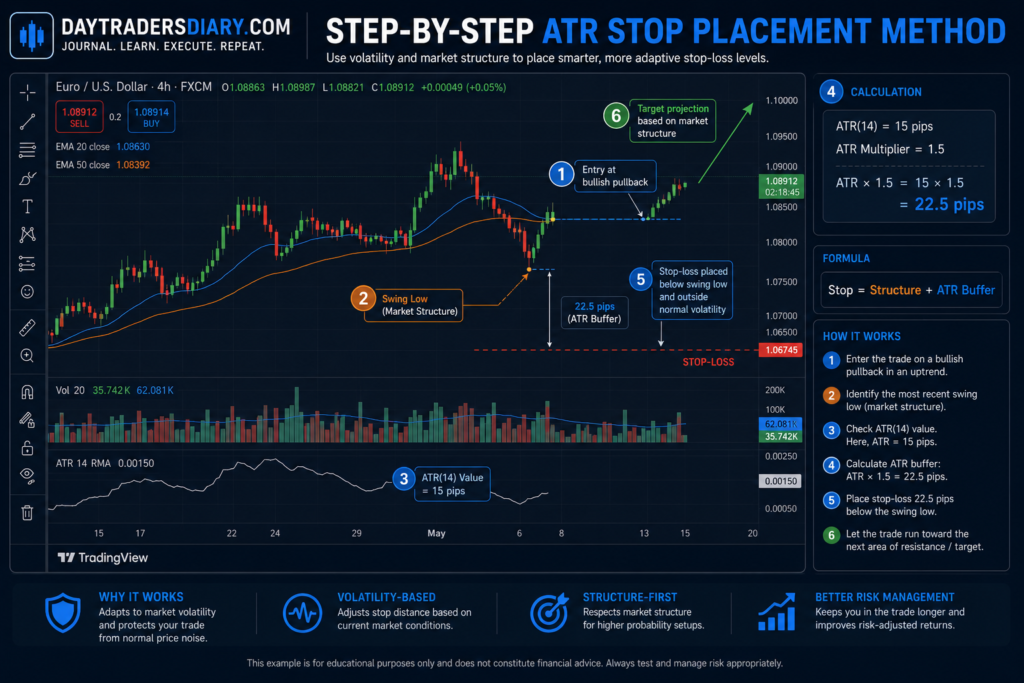
The Step-by-Step ATR Stop Placement Method
Let’s walk through a practical process used by many experienced traders.
Step 1: Identify the Trade Setup
ATR should never determine your entry.
The trade setup comes first.
Perhaps you’re trading:
A pullback in a trend.
A breakout.
A support and resistance reversal.
A price action continuation pattern.
The setup creates the opportunity.
ATR helps manage the risk.
This principle aligns closely with our article on How to Use Price Action Only Trading, where market structure drives decisions rather than indicators.
Step 2: Locate the Logical Invalidation Point
Before checking ATR, determine where the trade idea becomes invalid.
For a long time, this may be:
A swing low.
A support level.
A market structure break.
For a short trade, it may be:
A swing high.
A resistance level.
A failed breakout area.
This step is crucial.
ATR should enhance structure-based stops.
Do not replace them.
Step 3: Check the Current ATR Reading
Open your ATR indicator.
Most platforms default to ATR(14).
Suppose EUR/USD displays:
ATR = 15 pips
This means recent volatility averages approximately 15 pips per candle on your chosen timeframe.
Now you have objective volatility data.
Step 4: Apply an ATR Multiplier
This is where the real distance of the stop-loss is computed.
Several traders employ:
1 ATR
1.5 ATR
2 ATR (2)
The right multiplier is a function of market conditions and approach type.
For instance:
ATR = 15 points
1.5 ATR stop = 22.5 pips.
ATR stop 2 = 30 pips
Need 2 ATR for trend following trade.
All you need for a good breakout setup is 1 ATR.
The option is dictated by the market situation.
Not preference.
Step 5: Compare ATR Distance with Market Structure
This step is where many traders gain a real edge.
Suppose:
Market structure stop = 18 pips
ATR stop = 30 pips
Using the smaller stop might place you inside normal volatility.
Using the larger stop better reflects actual market conditions.
On the other hand:
Structure stop = 35 pips
ATR stop = 15 pips
The structure-based stop may be more logical.
The goal is to combine volatility and structure.
Neither should be used blindly.
Best ATR Trailing Stop Settings
Trailing stops create another challenge.
Move too quickly, and you’ll exit winning trades prematurely.
Move too slowly, and you give back profits.
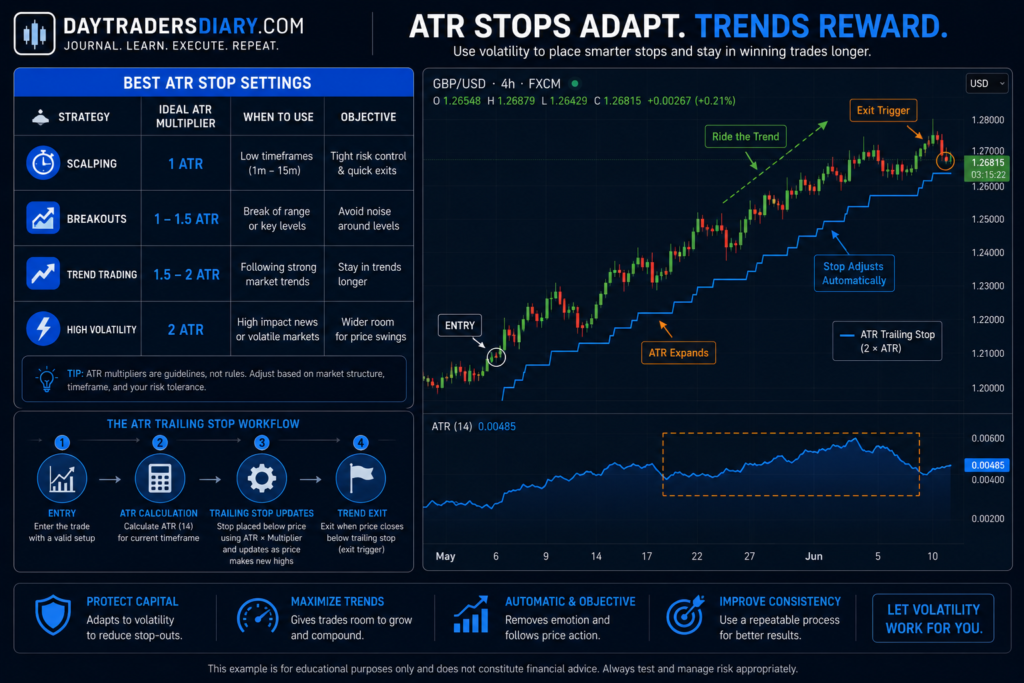
Many experienced trend traders prefer:
1.5 ATR trailing stop in strong trends.
2 ATR trailing stop during highly volatile conditions.
1 ATR trailing stop for aggressive trade management.
Consider a trending GBP/USD position.
As the price advances, the stop remains 2 ATRs behind the current price.
The stop naturally adapts as volatility expands and contracts.
This creates a dynamic exit process rather than relying on fixed pip values.
When ATR Stops Work Best
The ATR-based stops operate very effectively during:
Hot markets.
Breakout conditions are fickle.
News-based extensions
Play trades on the swing.
This indicator is great since in these circumstances, volatility is the most important.
The stop adjusts to what the market is actually doing.
When the ATR stops, it can fail
ATR isn’t perfect.
During prolonged consolidation, ATR often contracts significantly.
This can create stops that are too tight.
A trader using ATR without considering market structure may experience frequent stop-outs during ranging conditions.
This is why context matters.
Our guide, How to Trade Flat Markets, explains why volatility indicators behave differently in flat markets.
The best traders adapt accordingly.
Position Size Must Adjust with ATR
One mistake traders make is widening their ATR stop while keeping the same lot size.
That increases risk.
Suppose:
Trade A uses a 15-pip stop.
Trade B uses a 45-pip stop.
Using identical position sizes means Trade B risks three times more money.
Professional traders adjust their position sizes whenever the stop distance changes.
This is where most traders miscalculate risk.
Using a Position Size Calculator removes guesswork by automatically calculating the optimal lot size based on an ATR-derived stop distance and an account risk percentage.
Using ATR During Losing Streaks
Interestingly, ATR becomes even more valuable during difficult periods.
Many losing streaks occur because traders force normal stop sizes into abnormal volatility conditions.
Markets change.
Risk management should, too.
If ATR suddenly doubles following major news events, maintaining the same stop distance may no longer make sense.
This concept connects directly with our article on How to Handle Losing Streaks in Forex, where adapting to changing market conditions becomes critical.
Track ATR Data in Your Journal
Most traders record entries and exits.
Few record volatility conditions.
That’s a missed opportunity.
Your Trade Journal Template should include:
ATR reading at entry.
ATR multiplier used.
Stop-loss distance.
Market condition.
Trade outcome.
After reviewing several months of trades, you’ll often discover specific ATR ranges where your strategy performs best.
Those insights can dramatically improve consistency.
Scaling an ATR-Based Trading Edge
A trader who consistently applies volatility-based risk management develops something valuable.
Predictability.
Not market prediction.
Process predictability.
Professional evaluation firms look for traders who manage uncertainty effectively.
They want traders who understand risk, position sizing, and execution discipline.
Firms such as The5ers, FTMO, and FundedNext all reward consistency over aggression.
A trader who properly calculates ATR stops, adjusts position size accordingly, and follows a repeatable process often fits the profile these firms seek.
The5ers evaluation account could be the way to go for trading bigger capital if your diary shows consistent execution and managed drawdowns using the same disciplined approach you’ve already proved on your own account.
Final Thoughts
Most traders spend years searching for better entries.
Many never realize their exits are the real problem.
ATR won’t predict the next market move.
It won’t improve a weak strategy.
But it can help ensure that good trades have enough room to develop before market noise pushes you out.
Over the next twenty trades, record your ATR reading, stop-loss distance, and trade outcome.
Look for patterns.
You may discover that improving stop placement produces more progress than changing your strategy.
For your next read, explore How Traders Use ATR and Volatility Together to understand how volatility analysis can improve both trade selection and risk management.
Frequently Asked Questions
How do you use ATR to place a stop loss?
Calculate the ATR value, apply a multiplier such as 1.5 or 2, and combine that distance with market structure levels to determine a logical stop-loss location.
What is the best ATR stop-loss multiplier?
Many traders use 1.5 ATR to 2 ATR for trend trades. The best setting depends on market volatility, the timeframe, and the strategy’s characteristics.
Is ATR better than fixed pip stops?
In many situations, yes. ATR adapts to changing volatility while fixed pip stops remain static, which can result in stops that are either too tight or unnecessarily wide.
What ATR setting is most commonly used?
ATR(14) is the standard setting used by most traders because it provides a balanced view of recent market volatility.
Can ATR be used for trailing stops?
Yes. ATR trailing stops dynamically adjust as price moves, helping traders stay in trends longer while adapting to changing volatility.
Should ATR replace support and resistance levels?
No. ATR should be a supplement to market structure, not a replacement. The best stop placements are often volatility assessments along with important technical levels.