
You look at your charts, see a familiar trade setup, and enter the trade. The thing is, not much is happening price-wise. Candles blend into each other, breakouts don’t break out, and your position just sits there, with spreads and little wobbles eating away at your potential profit.
A little later, the market suddenly starts moving. The opportunity you were waiting for finally appears, but you are either already stuck in a trade or have stopped paying attention.
This is where volatility suppression filters can make a difference.
Instead of treating every quiet market as a trading opportunity, these filters help you recognise when price movement has become unusually compressed. You can then adjust your approach, avoid forcing entries, and prepare for a possible increase in activity.
The important point is that low volatility does not tell you which direction price will move next. It tells you something about the current market environment. Your job is to use that information without jumping into a breakout simply because the market has gone quiet.
What Are Volatility Suppression Filters?
Volatility suppression filters are indicators or rule-based conditions that identify periods when price movement has contracted compared with its recent behaviour.
You may notice this when candles become smaller, trading ranges narrow, and price repeatedly moves between nearby levels. The market is still active, but it is covering less ground.
Traders often call this condition volatility compression or a volatility squeeze.
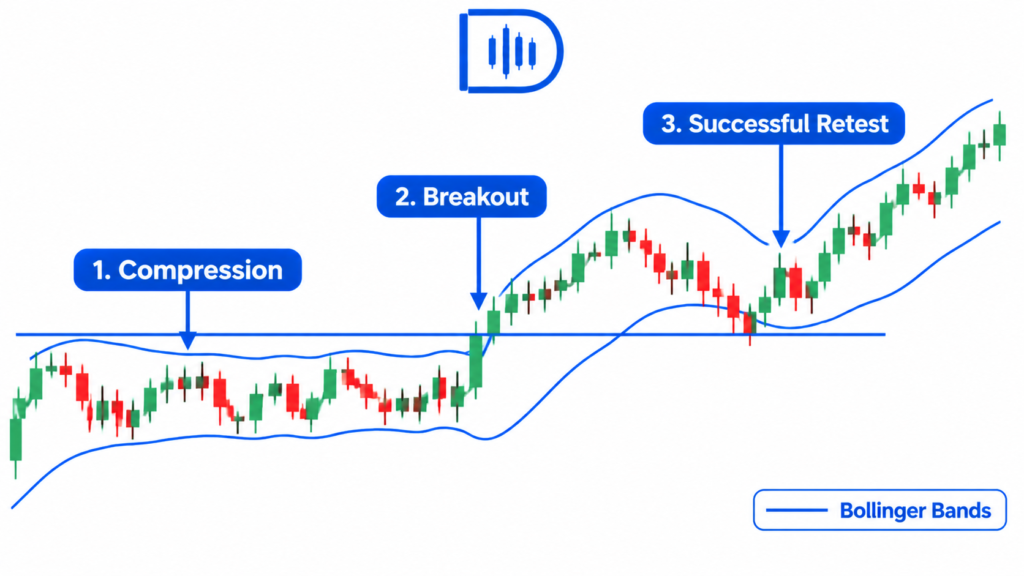
A popular one is the Bollinger Band Squeeze. The upper and lower Bollinger Bands converge as price variations decrease. Narrowing bands show that volatility has recently decreased.
However, a squeeze is not a buy or sell signal. It simply tells you that the market is quieter than it has been. Price could eventually break higher, move lower, or remain compressed longer than you expect.
A useful volatility suppression filter should therefore do more than highlight narrow candles. It should help you decide whether to trade normally, become more selective, or wait for conditions to change.

Why Traders Need Volatility Suppression Filters
One problem with many intraday strategies is that they assume the market will provide enough movement for an entry to develop.
That assumption does not always hold.
A breakout strategy may perform well when price is moving through a clear range with expanding participation. During a quiet period, the same strategy can produce repeated entries that go nowhere.
Pullback traders face a similar problem. Price may keep returning to the entry area without producing meaningful follow-through. What looks like a healthy retracement can simply be part of a narrow, directionless market.
Cost is not usually just one huge losing trade. It’s the aggregate effect of modest losses, unnecessary commissions/spreads, missed opportunities, and constant trading when conditions weren’t right for your strategy.
A suppression filter gives you a way to recognise this environment before you commit capital.
What Research Tells Us About Volatility Compression
The relationship between quiet and active market conditions has been studied extensively.
In Structural Attribution of Observed Volatility Clustering, Clive Granger and Mark Machina examine volatility clustering, a pattern in which financial markets experience periods of changing volatility rather than maintaining a constant level of price variation.
For a day trader, the practical implication is straightforward: a quiet market does not necessarily mean conditions will remain quiet, just as a volatile period does not guarantee that large moves will continue indefinitely. Monitoring changes in volatility can help you recognise when the trading environment is shifting.
The StockCharts guide to Bollinger BandWidth explains how BandWidth measures the distance between the upper and lower Bollinger Bands relative to the middle band. It also describes how historically narrow readings can identify a volatility squeeze.
One important detail is that BandWidth should be compared with its own historical readings. A naturally quiet instrument and a highly volatile instrument will not produce identical values.
The CME Group’s guide to futures profit and loss provides another useful perspective. It explains how average true range and contract specifications influence the financial impact of price movements.
This matters because a reduction in price range can change the opportunities available to your strategy, while a later expansion can increase the amount of money at stake. A volatility filter should therefore influence both trade selection and risk planning.
How to Set Up Volatility Suppression Filters
Start With Bollinger BandWidth
Bollinger BandWidth is one of the simplest ways to identify volatility compression.
It measures the distance between the upper and lower Bollinger Bands relative to the middle band. When the bands narrow, BandWidth falls. When price movement expands, BandWidth generally rises.
Start with the standard 20-period Bollinger Bands using two standard deviations. Add BandWidth to your chart and observe how it behaves during quiet and active periods.
Do not immediately copy a fixed threshold from another trader. A BandWidth reading that signals compression on one stock may be normal for another instrument.
Instead, compare the current reading with its recent history. You could test a rule that identifies a squeeze when BandWidth reaches the lowest 10% of its readings over the previous 100 bars.
That is an example to test, not a universal setting. The lookback period and threshold should reflect the instrument and timeframe you trade.
Add ATR to Confirm the Change in Price Range
Bollinger BandWidth measures changes in the width of the bands. Average True Range (ATR) offers another way to assess recent price movement.
When ATR begins falling alongside BandWidth, you have two different measurements pointing towards reduced volatility.
For example, imagine the 15-minute ATR on EUR/USD normally sits around 12 pips. It gradually falls to 7 pips while Bollinger BandWidth moves towards the lower end of its recent range.
This combination suggests that the market is covering less ground than usual.
You could use this as a condition for reducing the number of breakout entries you take. However, do not assume that two indicators agreeing means a breakout is guaranteed. Both are measuring aspects of past price behaviour, not predicting the next move.
Use a Higher Timeframe for Context
A compression signal on a five-minute chart can be useful, but it may be nothing more than a short pause within a larger move.
Check the 15-minute or hourly chart before deciding how to interpret it.
For example, a five-minute squeeze forming near hourly resistance deserves a different response from one developing above a well-established support zone. The first may be approaching an area where sellers could become active. The second may be forming in a location where buyers have previously defended price.
Higher-timeframe context will not tell you exactly when a breakout happens, but it helps you avoid treating every small compression pattern as an important market event.

Wait for Expansion and a Meaningful Break
This is where patience becomes important.
Once your filter identifies compression, mark the boundaries of the range. Then wait for price to show that it is moving beyond those boundaries.
A bullish setup becomes more interesting when price breaks above the range, closes beyond it, and holds the area during a pullback. For a bearish setup, look for a break below the range followed by a failed attempt to recover.
You can also watch whether ATR and BandWidth begin rising as price moves out of compression. That provides additional evidence that market activity is increasing.
Avoid entering simply because a candle touches the upper or lower Bollinger Band. The first break can fail, particularly when price briefly moves outside the range and then returns.
Your high-probability setup process can help you combine the volatility signal with market structure, entry confirmation, and a clear invalidation point.
Know When to Ignore the Squeeze
Not every period of low volatility deserves your attention.
Sometimes the market becomes quiet because there is little participation. Other times, it is waiting for an economic announcement. A narrow range before major news may produce a sharp move, but the initial reaction can also be difficult to trade because spreads and execution conditions change.
There is another situation worth recognising: compression against a strong trend. Price may pause briefly before continuing in the same direction. If you automatically expect a reversal or trade against the prevailing trend, the filter can lead you into poor decisions.
Treat compression as a condition to investigate, not an instruction to place an order.
Risk Management and Execution During Volatility Expansion
One mistake traders make after identifying a squeeze is increasing their position size because they expect a large breakout.
The problem is that you do not know how far price will move or whether the first break will hold.
A better approach is to plan the trade before the expansion happens. Identify the range boundary, decide where the setup becomes invalid, and calculate the position size using that stop distance.
The Position Size Calculator can help you match your position to your chosen risk amount. If the breakout requires a wider stop, adjust the position size rather than increasing your potential loss.
Also check the spread before entering. A narrow market range can make trading costs a significant part of the potential target. If the spread is unusually large relative to the expected move, waiting may be the better decision.
Journaling and Improving Your Filter
A volatility suppression filter needs to be justified by performance, not looks, to have a place on your chart.
For each setup, note the BandWidth reading, the ATR, the duration, session, range size, and the direction of the ultimate breakout. Also note whether price retained outside the range or came back inside it.
It is equally important to record the squeezes you ignored. Some of those may have produced strong moves, while others may have gone nowhere. Reviewing both helps you understand whether your filter is keeping you out of poor trades or making you unnecessarily cautious.
Compare the results under different market situations and over different sessions after 20 to 30 examples. You could discover that your filter performs better during active trading hours than in slow periods. You may also find that waiting for a retest enhances your entries.
Use the Trade Journal Template to keep these observations organised. Change one setting at a time and test it again before making another adjustment.
Scaling a Tested Strategy With More Capital
Once your volatility filters have been tested and you can follow them consistently, you may start looking at ways to increase your trading capital.
Proprietary trading proofs can provide a formalized method for traders to prove themselves within established risk limits. They are not a shortcut to skip the task of developing a strategy.
The5ers offers evaluation and funded-account programs for forex traders. FTMO provides another option in the forex and CFD space, while TradeThePool focuses on stock trading.
Compare their evaluation requirements, maximum drawdown, daily loss limits, news restrictions, and payout conditions before choosing a program.
This is particularly important for a volatility-based strategy. A trader who waits patiently through compression but then takes oversized positions during expansion may struggle to meet a firm’s risk requirements.
If you have solid trading experience and you are able to trade in both tranquil and fast-moving situations, then check out a The5ers evaluation account.
Frequently Asked Questions
What are volatility suppression filters?
They are indicators or trading rules that identify periods when price movement has become unusually narrow compared with recent market behaviour. Traders use them to recognise compression and avoid forcing entries during quiet conditions.
Which are the best volatility suppression filters?
ATR, Bollinger BandWidth, and previous volatility are good. Bollinger BandWidth shows band narrowing; ATR shows price movement. The best combination depends on the instrument and timeframe.
Does low volatility mean a breakout is coming?
No. Low volatility indicates that price movement has contracted. A later expansion is possible, but the market can remain quiet or break in either direction. You still need confirmation from price action.
What is the Bollinger Band Squeeze?
It occurs when the upper and lower Bollinger Bands move closer together because recent price volatility has declined. Traders watch for a possible expansion after the squeeze, but the indicator does not predict the breakout direction.
Can I use volatility suppression filters for forex and stocks?
Yes. They can be applied to forex, stocks, futures, and other markets. However, the settings should be adjusted to the instrument’s normal behaviour. A threshold that works for one market may be unsuitable for another.
Should I trade immediately when volatility starts expanding?
It shouldn’t be like that. Observe a significant range boundary breakout, then check for confirmation of it holding on the other side. A short failure of an initial breakout is not confirmation.
Final Thoughts
Volatility suppression filters are most useful when they help you stop taking trades that your strategy is not suited to handle.
A quiet chart is not automatically a bad chart, and a squeeze is not a promise of a major move. It simply tells you that the market has changed its behaviour and that your next decision deserves more attention.
Start with Bollinger BandWidth and ATR on one instrument. Record the compression periods, watch how price leaves the range, and review which breakouts actually follow through.
For your next 20 setups, focus on one improvement: stop entering before price has shown that it can hold beyond the compression range.
For your next read, explore How to Assess Session Momentum Overlap. It will help you understand how activity across trading sessions can influence the strength and timing of a volatility expansion.