
You see EUR/USD move 40 pips during the London session and assume the market is unusually active. You start looking for a continuation trade, only to discover that price has already exhausted most of its movement and begins reversing.
The problem is not necessarily your market analysis. It is the way you judged the session.
A 40-pip move might be significant during a quiet period but completely ordinary during an active London session. Without comparing current movement with historical behaviour, it is easy to mistake normal activity for unusual strength.
Session strength ratios help solve that problem. They give you a way to measure how much a market has moved compared with its usual behaviour and whether that movement has produced meaningful directional progress.
There is no single universal formula for session strength. In this guide, we will build a practical calculation method that combines session range, historical averages, and directional efficiency. You can use it in a spreadsheet or turn it into your own session strength ratios calculator.
What Are Session Strength Ratios?
A session strength ratio compares the current movement of a market session with its typical movement over a selected historical period.
For example, you might compare today’s London session range with the average London range over the previous 20 trading days. If today’s range is considerably larger, the session is more active than usual.
But range alone does not tell the whole story. Price could move 70 pips in both directions and finish close to where it started. That is high activity, but not necessarily strong directional movement.
A useful session strength analysis therefore looks at two things: how far price has travelled and how much progress it has made in one direction.
This distinction helps you avoid chasing a market simply because the candles look impressive.
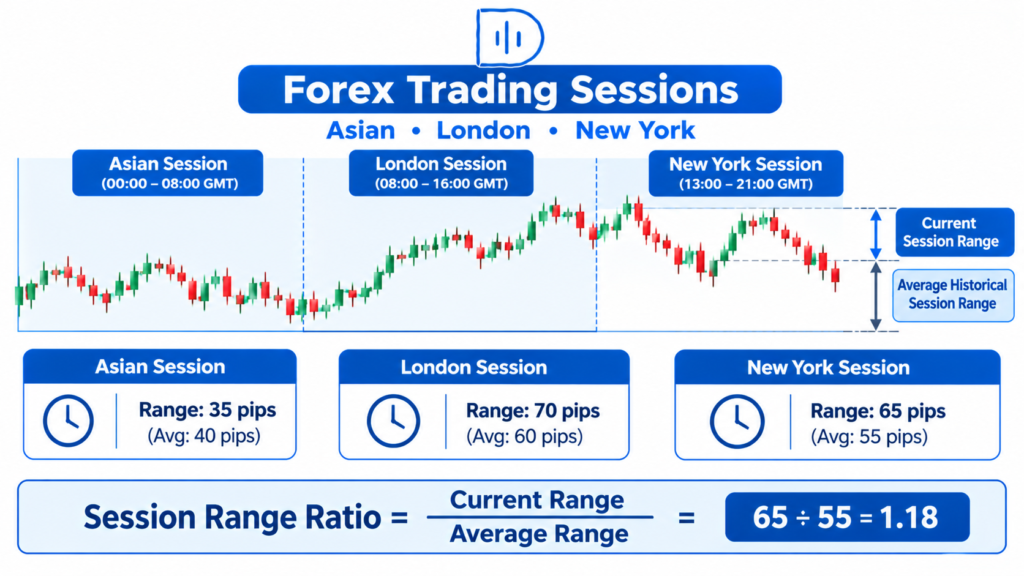
Why Trading Sessions Behave Differently
The Asian, London, and New York sessions have distinct participation. Price is affected by liquidity, trade, economic developments, and the opening of key financial centers.
Research by Takatoshi Ito and Yuko Hashimoto, published by the National Bureau of Economic Research, examined recurring patterns in foreign exchange market activity. Their paper, Intra-Day Seasonality in Activities of the Foreign Exchange Markets, provides useful evidence that trading activity changes throughout the day.
For day traders, the practical lesson is straightforward. You should not judge every session against the same expectation. A movement that is unusual during one session may be normal during another.
Research by Ahmet Sensoy and Süleyman Serdengeçti also examined the relationship between intraday volume and volatility in foreign exchange markets. Their study, Intraday Volume-Volatility Nexus in the FX Markets, highlights why volume and volatility should not be treated as identical measurements.
CME Group’s educational guide to trading volume makes another useful distinction: volume tells you how much trading activity has taken place, but it does not independently establish market direction.
This is why a session strength ratio should be treated as context, not a buy or sell signal.
How To Calculate Session Strength Ratios
Start with the session range ratio. It is straightforward and gives you a useful first reading.
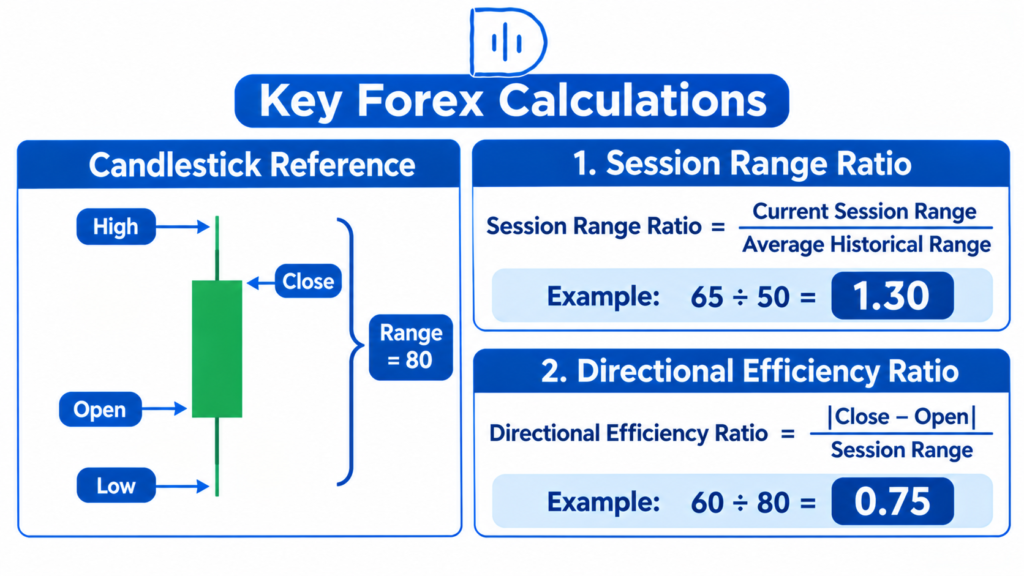
Session Range Ratio = Current Session Range ÷ Average Historical Session Range
The current session range is the highest price minus the lowest price recorded during that session.
Suppose EUR/USD has an average London session range of 50 pips over the previous 20 comparable sessions. Today’s London session has already covered 65 pips.
The calculation is:
65 ÷ 50 = 1.30
Your session range ratio is 1.30. In other words, price has covered 130% of its usual session range.
A reading below 1.00 means the current range is smaller than the historical average. A reading around 1.00 is close to normal, while a reading above 1.00 indicates greater movement.
Do not interpret a higher number as a guarantee of continuation. It tells you how much price has moved, not what it will do next.
Measure Whether Price Is Actually Moving in One Direction
This is where many traders get a more useful understanding of session strength.
A market can have a large range without making much progress. To measure directional efficiency, compare the distance between the session open and close with the full session range.
Directional Efficiency Ratio = Absolute (Session Close − Session Open) ÷ Session Range
Imagine a session opens at 1.0850, reaches 1.0920, falls to 1.0840, and closes at 1.0910.
The full range is 80 pips, while the distance between the open and close is 60 pips.
60 ÷ 80 = 0.75
The directional efficiency ratio is 0.75. Price has finished relatively far from its opening level compared with the distance it travelled.
Now imagine another session covers the same 80-pip range but closes only 5 pips above its open. Its directional efficiency ratio is 0.0625.
The second session was active, but price made very little net progress. This may indicate a two-sided market where buyers and sellers repeatedly pushed price in opposite directions.
Remember that this calculation measures the size of the net move, not its direction. Check whether the session closed above or below its open to establish the bullish or bearish side.
Build a Simple Session Strength Ratios Calculator
You do not need an expensive indicator to start. A basic spreadsheet can calculate the ratios using historical session data.
Record the session open, high, low, and close for your chosen instrument. Keep separate records for the Asian, London, and New York sessions. Calculate the range for each session and compare it with the average range of the previous 20 comparable sessions.
Then calculate directional efficiency using the session open, close, and range.
For example, if GBP/USD has an average New York session range of 45 pips and today’s session has moved 30 pips, the range ratio is:
30 ÷ 45 = 0.67
The session has covered around 67% of its normal range.
That reading means something different depending on when you measure it. If New York has only been open for two hours, there may still be time for movement to develop. If the session is nearly finished, the same reading may simply indicate a quieter day.
For better comparisons, measure the current session against the same amount of elapsed time in previous sessions. Comparing the first two hours of today’s London session with the full range of previous London sessions can give you a misleading result.
Consistency matters more than complexity. Use the same session boundaries and account for daylight saving changes when comparing London and New York activity.
How To Read a Session Strength Ratios Chart
A session strength ratios chart should make comparisons easier. Use 1.00 as a baseline and chart the range ratio as a line or bar chart. Rather than putting everything into one figure, present directional efficiency as an additional reading.
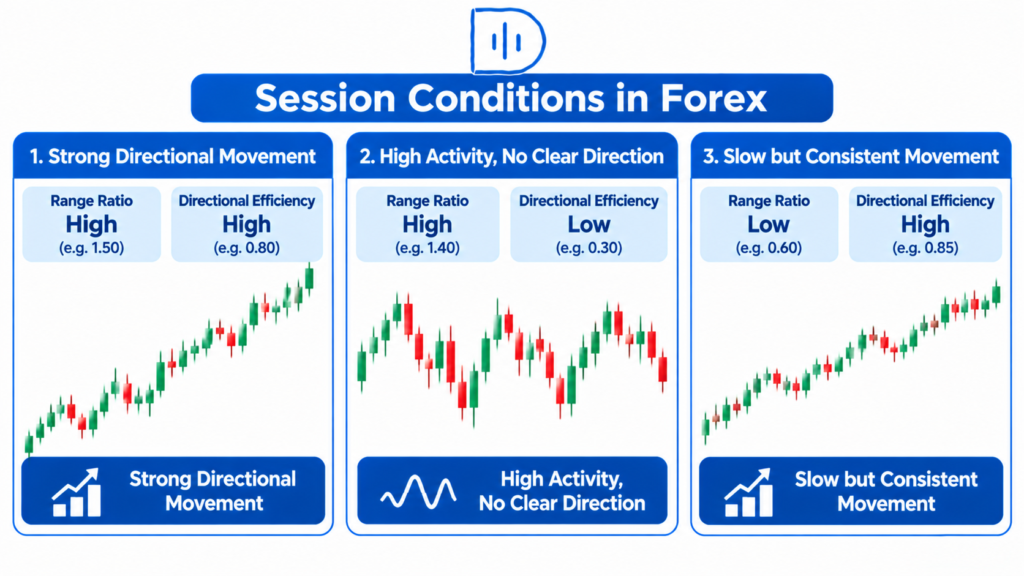
Consider three situations.
When both the range ratio and directional efficiency are high, price is moving more than usual and making clear progress in one direction. This may support a trend-following setup, provided the market still has room to move.
A high range ratio and low direction ratio imply an active but directionless session. This may be due to news-driven movement or sharp reversals. This environment can be costly if you chase the last candle.
If the range ratio is low, but the directional efficiency is high, then the price is moving in one direction consistently but not covering much ground. This may be a slower trading opportunity, but it is for you to decide whether the movement available to you merits the risk.
The value of the chart is not in producing a colourful signal. It is in helping you understand what kind of market you are dealing with.
Use Session Strength to Improve Your Trade Selection
Imagine London opens and EUR/USD develops a range ratio of 1.20. Directional efficiency is also strong, and price is forming higher highs and higher lows.
Then, later on, the price bases off a previous breakout area. Instead of blindly buying just because the session is strong, you may determine whether they are in a good spot to enter after the retreat, with buyers returning and room to the next resistance region.
Now look at another scenario. The range ratio is still 1.20, but price has moved quite a bit in opposite directions and is back around its starting level. Buyers aren’t firmly in charge, but the session is underway.
A breakout strategy may struggle in this environment. Waiting for a cleaner structure could be the better decision.
This is how session strength ratios should influence your trading. They help you decide which conditions deserve attention rather than telling you exactly when to enter.
You can build on this approach with our guide to finding high-probability trading setups.
Risk Management and Execution Still Matter
A high session strength reading can tempt traders to increase their position size or chase a move that has already travelled too far.
Be careful with that reaction. If price has already covered more than its usual session range, a continuation trade may have less room to develop, especially near an important daily high or low.
Identify the level that invalidates your trade idea first. Then calculate your position size based on the stop distance and the amount you are prepared to risk.
The Day Traders Diary Position Size Calculator can help you calculate a suitable position without guessing.
Also record your planned entry and actual fill. During fast sessions, spreads and slippage can make a good-looking setup less attractive once execution costs are included.
Track Your Results and Improve the Calculation
The ratios become more useful when you compare them with your own trading results.
Record the instrument, session, range ratio, directional efficiency, setup type, entry time, exit time, and final result in R. After collecting a reasonable sample, look for patterns.
You may find that your continuation trades perform better when both measurements are elevated. Perhaps your breakout strategy struggles when the session has already used most of its average range. You might also discover that a particular currency pair produces cleaner movement during London than during New York.
Do not assume these patterns apply to every market. Let your own records guide your decisions.
Use the Trade Journal Template to keep your observations organised. Screenshots of the session at entry and exit can help you review whether the ratios matched the actual price behaviour.
If you want to test whether these measurements improve your strategy, read our guide on how to backtest a day-trading strategy.
Can Session Strength Help You Scale?
Once you have tested your approach and understand which market conditions suit your strategy, you can consider whether additional trading capital makes sense.
If you have a consistent strategy but no personal capital, an evaluation account may be the way to go. But session strength ratios are not an edge by themselves. Session strength ratios are not an edge in and of itself; you’ll need a back-tested approach with draw downs you can manage as well as the discipline to respect your rules even in busy session times.
You can explore the The5ers evaluation program and compare its conditions with providers such as FTMO. Stock traders may also want to research TradeThePool.
Compare evaluation costs, profit targets, drawdown rules, and payout conditions before making a decision. Choose a program that fits your existing trading approach rather than changing your approach to chase an evaluation target.
Frequently Asked Questions
What are session strength ratios in trading?
Session strength ratios compare current market movement with the normal behaviour of a specific trading session. They measure whether pricing is running stronger than normal and whether that strength is making for good directional advancement.
How do you calculate a session strength ratio?
Divide the current session range by the average range of the same session over a selected historical period. If today’s London range is 60 pips and its 20-session average is 50 pips, the ratio is 1.20.
What does a session strength ratio above 1 mean?
It means the current session has covered more range than its historical average. A reading of 1.20 indicates that the current range is 120% of the average. It does not guarantee further movement in the same direction.
Can I use session strength ratios for gold and forex?
Yes. The calculations can be applied to forex pairs, gold, indices, and futures. Use separate historical averages for each instrument because their volatility and session behaviour can differ.
What is the difference between session strength and volatility?
Volatility describes how much price moves. Session strength should also consider whether price makes meaningful progress in one direction. A session can be highly volatile but finish close to its opening level.
How many days should I use for the average session range?
Twenty such sessions should suffice as a good start. You can experiment with longer or shorter durations to find what is a better reference for your instrument. Calculate findings in the same manner for comparison.
Is there a session strength ratios indicator?
Some trading platforms and bespoke indicators reflect session ranges, relative volatility, or direction. There is no universal session strength indicator, but you may develop simple calculator utilizing the session open, high, low, close, and historical averages.
Final Thoughts
Strength ratios for a session let you kill the visual estimate of market action. They show you if a session is becoming more active than usual, and if that activity is making substantive progress in one direction.
Begin with the directional efficiency ratio and session range ratio. Use these two to track your principal trading instrument for the next 20 sessions. Notice how your best and worst configurations perform at various readings.
You may discover that your strongest trading opportunities do not come during the sessions with the biggest ranges. They may come when volatility is healthy, direction is clear, and price still has room to move.
That is the information worth using.
Next read: How To Assess Session Momentum Overlap.