
A Stochastic crossover can look almost irresistible when you are staring at a fast-moving chart.
The oscillator drops below 20. %K crosses above %D. Price has already sold off. The market is permitting you to buy.
Then the price keeps falling.
A few minutes later, the Stochastic is still oversold, but your long position is stopped out.
The same problem happens in reverse. Traders see the indicator above 80, sell because the market looks overbought, and discover that a strong trend can remain overbought far longer than their account can tolerate.
The failure is usually not the Stochastic itself. The failure is asking an oscillator to do a trend filter’s job.
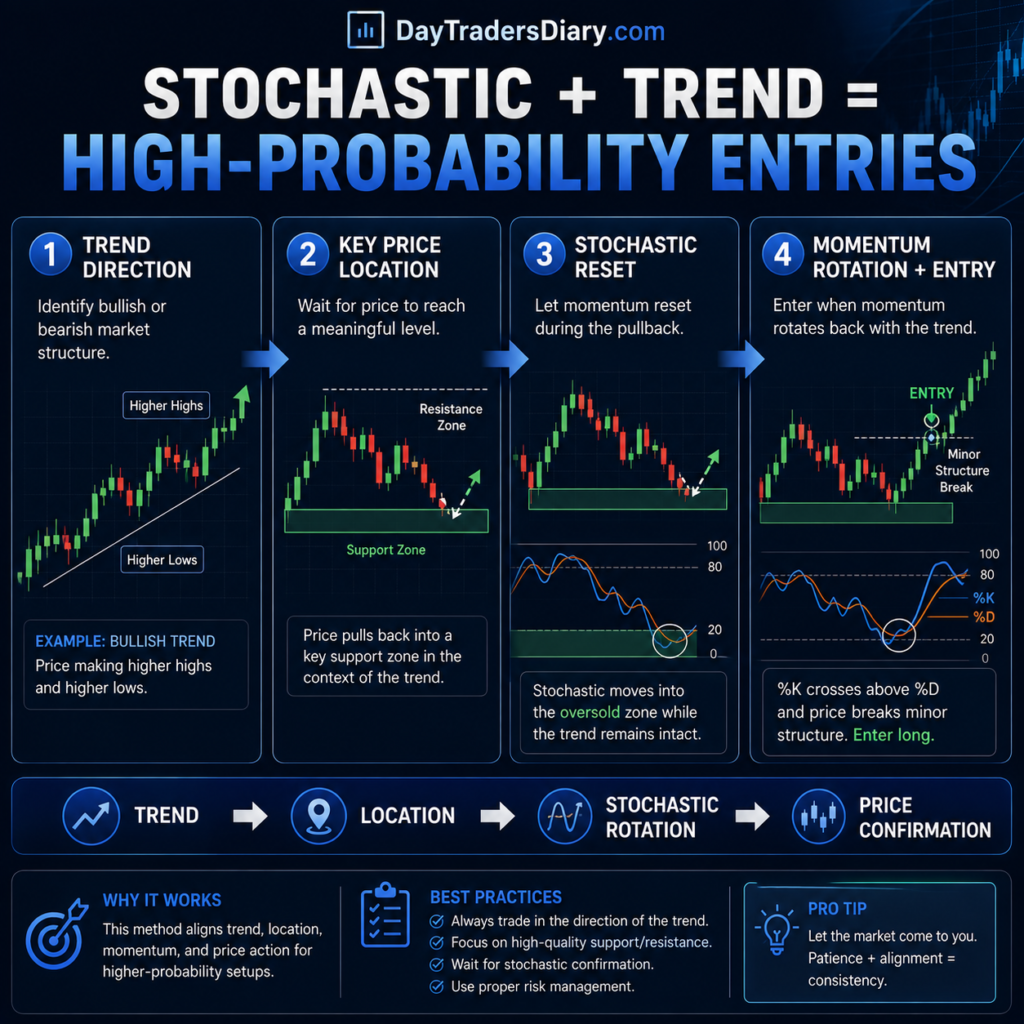
This is where stochastic trend fusion becomes useful. Instead of treating the Stochastic as a standalone buy-and-sell machine, you give it a narrower job. Trend structure decides direction. Market location decides whether the trade is worth considering. The Stochastic helps time the return of momentum.
That sounds simple, but the real edge is in defining what each component is allowed to do.
A high-probability entry is rarely created by adding more indicators. It is created by preventing one piece of information from overriding another.
The basis of this article is for active day trading:
Trend answers: Which way should I be looking?
Location answers: Is the pricing moving back into a major area?
Stochastic Answers: Is the trend regaining momentum?
The sequence matters. When traders reverse that sequence and let the oscillator choose direction first, they often end up fighting the strongest part of the market.
Why the Stochastic Oscillator Is Commonly Misused
The Stochastic Oscillator measures the relationship between the current closing price and the recent high-low range. In simple terms, it helps show where the price is closing relative to its recent range.
That is not the same as measuring whether a market is fundamentally or structurally overvalued.
George Lane, who developed the Stochastic Oscillator, emphasized momentum and the tendency for momentum to change direction before price. The indicator was never a guarantee that every reading above 80 should be sold or every reading below 20 should be bought.
This difference is important for the day trader.
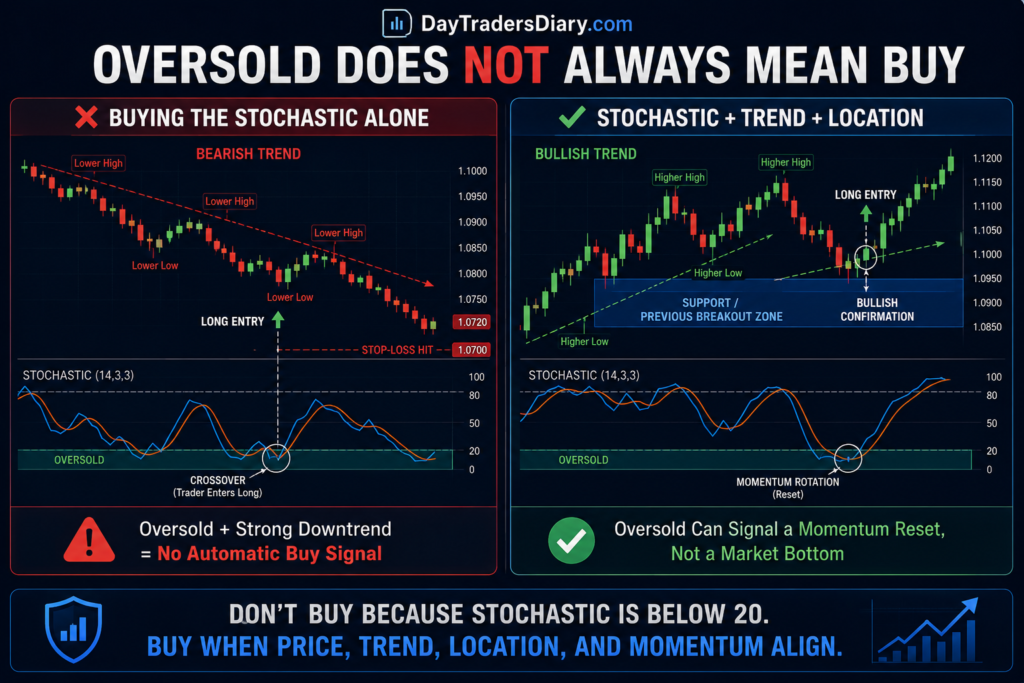
In a strong uptrend price regularly closes at the top of its recent range. The Stochastic can remain high if the purchasing pressure continues to produce strong closes. An overbought reading is a measure of trend strength, but necessarily a signal of an imminent reversal.
The same logic applies during strong downtrends. An oversold reading may describe persistent selling rather than exhaustion.
The real question is not:
Is the Stochastic overbought or oversold?
The better question is:
What does this Stochastic reading mean in the current trend and at the current price location?
That is the foundation of a usable Stochastic trend strategy.
What Research and Market Evidence Suggest About Trend and Technical Signals
Technical indicators do not operate in a vacuum. Their usefulness changes with the market environment.
Research associated with the Federal Reserve Bank of New York has examined technical trading rules in currency markets and the way profitability and performance can vary across market conditions. The practical lesson for a day trader is not that one indicator will always work. It is that rules can behave differently when market conditions change.
The interaction of technical trading rules and shifting market conditions has also been studied in academic studies released by the National Bureau of Economic studies. The key point for traders is simple: a signal that looks effective in one regime might break down when volatility, trends or market structure change.
The CME Group educational resources on technical analysis also emphasize that indicators are tools for interpreting market behavior rather than independent guarantees of future price movement.
For practical day trading, these ideas lead to an important conclusion.
The Stochastic should be regime-dependent.
If the market is trending, use it primarily to time pullbacks and momentum re-entry.
If the market is ranging, overbought and oversold zones may have more value for reversal setups.
Trying to apply the same Stochastic rule to both environments is where many strategies quietly lose their edge.
The Core Stochastic Trend Fusion Framework
The method uses three confirmations, but they are not three random indicators stacked together.
Each confirmation answers a different question.
The first confirmation is trend permission.
The second confirmation is pullback quality.
The third confirmation is momentum rotation.
The Stochastic only becomes actionable after the first two conditions are present.
Step One: Establish Trend Permission
Before looking for an entry, define whether the market deserves a long bias, a short bias, or no directional bias.
There are several ways to do this. Market structure is usually the cleanest starting point.
For a bullish environment, look for a sequence of higher highs and higher lows. For a bearish environment, look for lower highs and lower lows.
You can add a moving average or an ADX-based trend filter, but the indicator should support the structure rather than replace it.
A practical approach is to classify the market into three states.
Expansion trend: Price is making directional progress, pullbacks are relatively controlled, and the market repeatedly accepts new highs or lows.
The transitional market structure is becoming opaque, swings overlap, trend momentum is decreasing.
Price continually oscillates within set bounds without sustained directional movement.
The Stochastic should be interpreted differently in each state.
This connects naturally with our guide on how to classify trend strength with ADX clusters. Before using momentum to time an entry, it helps to know whether the market is actually trending strongly enough to justify buying dips or selling rallies.
Step Two: Wait for Price to Pull Back to a Location That Matters
This is where many Stochastic strategies become too mechanical.
A trader sees the oscillator turn up and immediately buys.
But where is the price?
If the answer is “somewhere in the middle of a chart,” the signal may have little structural value.
A better Stochastic trend fusion entry occurs when the pullback reaches an area that already has a reason to matter.
This could be a previous breakout level, a higher low, a moving average that has repeatedly acted as dynamic support, or a defined intraday structure zone.
The key idea is simple.
The Stochastic should confirm a decision zone, not create one.
Imagine EUR/USD has been trending upward on the 15-minute chart. Price breaks above a previous resistance level, extends higher, and then pulls back toward that breakout area.
Now the Stochastic falls below 30.
That oversold reading alone does not create the trade.
The location does the important work.
The oscillator tells you that the pullback has generated enough short-term downside momentum to create a potential reset. You then wait for evidence that momentum is rotating back upward.
That is very different from buying every oversold reading.
Step Three: Use the Stochastic to Detect Momentum Rotation
Once trend and location are aligned, the Stochastic becomes an execution tool.
For a long setup, you might wait for the oscillator to decline during the pullback and then observe %K crossing back above %D while both begin turning upward.
But even here, the crossover should not be treated as an automatic entry.
The strongest signals often show a relationship between the oscillator and price behavior.
Suppose the Stochastic turns upward, but the price continues making lower lows through the support area.
That is a warning.
Now suppose the Stochastic turns upward while price stops making lower lows, forms a higher intraday low, or reclaims a minor structure level.
That is a stronger confirmation because price and momentum are now telling a similar story.
The fusion reads like follows:
Trend direction -> retracement -> momentum change -> price confirmation.
This second layer of price confirmation is often what separates the good Stochastic crossovers from a random twitch of the oscillator.
The Most Important Insight: Oversold Is Often a Reset, Not a Reversal
This is one of the most useful mindset changes a trader can make.
In an established uptrend, an oversold Stochastic can be interpreted as a momentum reset.
The market has pulled back.
Short-term selling has pushed closing prices lower within the recent range.
The oscillator reflects that temporary weakness.
Your job is not to predict the exact bottom.
Your job is to determine whether the pullback is ending before the larger trend structure fails.
That means the best long setup is often not when the Stochastic first reaches 20.
It may occur after the oscillator has already been oversold and begins rotating upward while price confirms that sellers are losing control.
The same principle works in reverse during a downtrend.
An overbought Stochastic may represent a rally within bearish structure, not the beginning of a new bullish trend.
This is why unthinkingly fading readings above 80 or below 20 can become expensive.
A Practical Long Entry Scenario
Consider a 15-minute bullish trend.
Price has formed a higher high and then begins pulling back.
The previous breakout zone sits 20 pips below the recent high. Price retraces into that zone—the Stochastic drops from 85 to 18.
At this point, there is still no trade.
You now watch what happens next.
Price briefly tests below the zone but quickly recovers. The next candle closes back above the level. The Stochastic %K crosses above %D, and both lines begin rising.
Now you have four pieces of information:
The broader trend is bullish.
Price has returned to a meaningful area.
The pullback has lost some downside momentum.
Short-term momentum is rotating upward.
The entry can be taken above the confirmation candle, with the stop positioned beyond the structural level that would invalidate the trade.
The important detail is that the Stochastic did not predict the reversal.
It helped identify when the pullback was transitioning.
That is a much more realistic use of an oscillator.
When the Same Setup Should Be Rejected
Now change one detail.
The market is still bullish, and the Stochastic becomes oversold.
But price slices directly through the previous support level with expanding momentum. It continues making lower lows. The Stochastic briefly crosses upward, then immediately rolls back down.
This is not a high-quality fusion entry.
The oscillator may be giving a short-term signal, but the price has not confirmed that the pullback is ending.
A useful rule is:
Never allow the Stochastic to overrule structural failure.
If the level breaks decisively, reassess the trend and wait for a new setup.
This principle also helps prevent the kind of premature entries discussed in our article on entry delay risk in Forex trading. The solution to entering too late is not entering at the first possible signal. The goal is to define the amount of confirmation required before the quality of the trade deteriorates.
Choosing Stochastic Settings for Day Trading
The traditional Stochastic settings are commonly written as 14, 3, 3.
They can work, but there is no reason to assume they are automatically optimal for every market and timeframe.
Shorter settings react faster and generate more signals. The cost is more noise.
Longer settings react more slowly and filter some noise. The cost is a delayed entry.
The important question is not which setting is universally best.
Ask instead:
How much of the pullback do I need the indicator to capture before I consider a momentum reset?
A trader operating on a five-minute chart may need a more responsive oscillator than someone using 30-minute pullbacks.
But changing settings should be done carefully.
Do not optimize until every losing trade disappears. That usually creates a strategy fitted to historical noise.
Instead, test a small number of parameter combinations and focus on whether the logic remains stable.
If 14, 3, 3 works only on one month of data while another setting performs reasonably well across different conditions, the more stable version may be more useful even if its backtest looks less impressive.
The Two-Timeframe Stochastic Trend Model
One practical method is to separate trend identification from execution.
For example, use the 15-minute chart to establish the directional structure and the 5-minute chart to time the entry.
The 15-minute chart answers whether you should prioritize longs or shorts.
The 5-minute chart shows the pullback and Stochastic rotation.
This prevents the oscillator on a very short timeframe from constantly changing your larger directional bias.
15 min structure stays bullish assuming
5 min chart is having a sharp decline.
The Stochastic on the 5 minute chart is in oversold territory.
If you don’t want to believe the trend has flipped because of a short term fall then you can take it to be a pullback of the wider structure.
You still need price confirmation, but the higher timeframe prevents every five-minute oscillator move from becoming a new trade idea.
This framework works particularly well alongside a structured approach to estimating the likely retracement after a breakout. If you expect where a normal pullback may reach, the Stochastic can help time the transition once the price enters that area.
The Stochastic Failure Zone
Every strategy needs a condition where you deliberately stop trusting the signal.
For Stochastic trend fusion, there are three common failure zones.
The first is structural failure. If the pullback breaks the level that defines the trend, the original setup may no longer exist.
The second is volatility distortion. In case of sudden liquidity shocks or major news, the oscillator could jump from one extreme to the other, with the price ignoring the normal retreat pattern.
Congestion of signals, third. If the Stochastic keeps crossing over and the price is going nowhere, the market may not have a directional impetus.
This is why the best Stochastic signals usually have space to move.
A crossover inside a congested range is not equivalent to a crossover occurring after a controlled pullback into a trend-supporting level.
Context determines the quality of the same technical event.
Why Traders Often Enter Too Early
The psychology behind early Stochastic entries is predictable.
The trader sees the oscillator approaching 20 and starts imagining the reversal before it happens.
Then the fear of missing the move appears.
The trader buys while the Stochastic is still falling.
Price drops further.
The trader either exits at a loss or adds to the position, hoping the oversold reading will eventually force a reversal.
The solution is to replace anticipation with a rule.
Do not enter because the oscillator is extreme.
Enter when the oscillator has completed the behavior your strategy requires.
For example, your rule might require:
Price reaches a predefined pullback zone.
The larger trend remains intact.
The Stochastic rotates back in the trend direction.
Price confirms with a minor break of short-term structure.
That sequence reduces the emotional pressure to predict the exact turning point.
You are no longer trying to buy the lowest tick.
You are trying to enter when the probability distribution begins improving.
Stochastic Trend Fusion and Trend Strength
Not every trend should be traded with the same pullback expectations.
A strong trend can produce shallow pullbacks.
A moderate trend may produce deeper retracements.
A weak trend may repeatedly look like a trend until the next pullback becomes a reversal.
This is where trend classification matters.
If ADX and price structure suggest strong directional expansion, waiting for a deeply oversold Stochastic reading may cause you to miss most of the move.
The market may only reset from 90 to 50 before continuing.
In a slower, more mature trend, deeper oscillator pullbacks may occur more frequently.
This creates an important adjustment:
Do not demand the same Stochastic depth in every trend.
Instead, study how your chosen market normally pulls back during strong, moderate, and weak trend conditions.
It may be that the sequence of momentum contraction and rotation is more important than the threshold itself.
A More Advanced Framework: Measure the Pullback Against the Trend
Rather than looking only at whether the Stochastic reaches 20 or 80, compare the pullback with the preceding impulse.
Suppose an uptrend produces a 60-pip impulse.
The pullback retraces 12 pips.
The Stochastic falls to 25.
That may represent a shallow price retracement with a deep momentum reset.
Now imagine another setup.
A 45-pip pullback follows the same 60-pip impulse.
The Stochastic also reaches 25.
The oscillator reading is similar.
The market condition is not.
In the second example, the price has surrendered far more of the previous move.
That’s when oscillator readings should come in with the price measurements.
You can follow:
Pullback size as a percentage of prior impulse.
Pullback length.
Candles against the trend.
Distance from the key structural level.
Stochastic depth.
The relationship between these variables can reveal far more than the oscillator alone.
A pullback that takes a long time but gives back little price distance may indicate controlled profit-taking.
A pullback that rapidly erases most of the previous impulse may indicate a more serious change in order flow.
The 3-Condition Entry Model
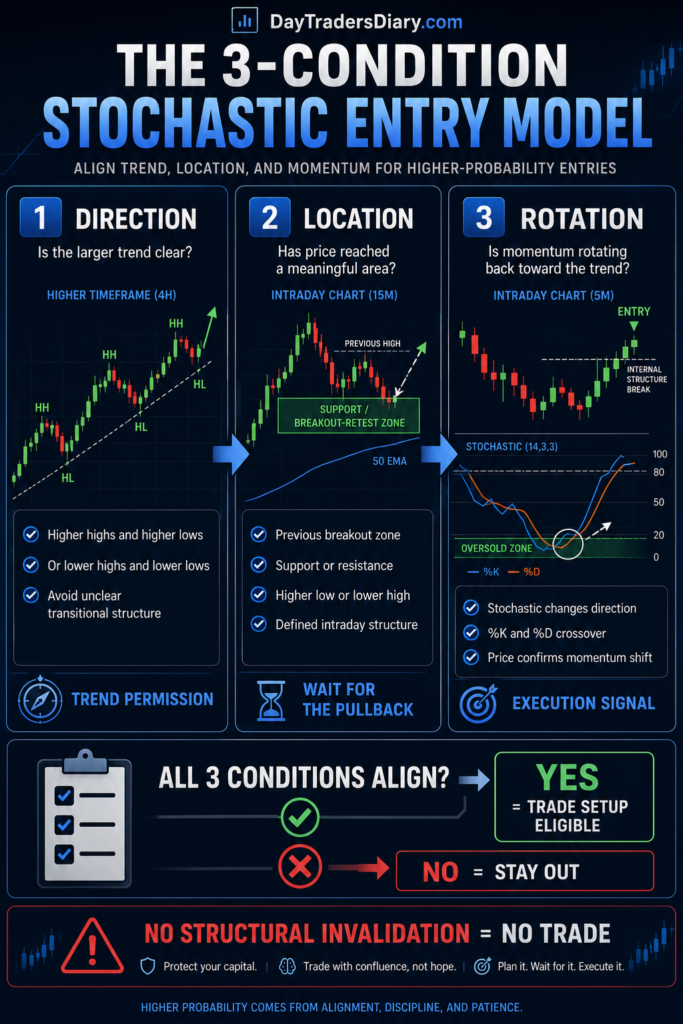
For traders who want a repeatable process, use this decision model.
Condition 1: Direction
The greater execution context should have a trend or directional bias.
Condition 2: Location
Price needs to pull back into an area to be identified before the entry signal is given.
Condition 3: Rotation
Price points to some evidence that the downturn is no longer becoming worse. The Stochastic needs to go back toward the trend.
If all three conditions are satisfied then the setup can be run.
If one is missing, the trade is incomplete.
This framework is deliberately simple because speed matters in day trading. A complicated checklist that cannot be applied in real time is often worse than a shorter process that you can execute consistently.
Risk and Execution: Where Good Signals Become Bad Trades
A technically sound setup can still become a poor trade if the stop placement and position size are wrong.
Suppose your long setup appears after a Stochastic rotation at support.
You enter before calculating where the trade is actually invalidated.
Your stop ends up inside normal pullback noise.
You get stopped out.
Price then continues in the original direction.
The Stochastic was not necessarily wrong.
Your risk placement was disconnected from the market structure.
The stop should generally sit at the point where your trade thesis is invalidated, not at an arbitrary number of pips chosen because it feels comfortable.
Once that distance is known, position size should be calculated from the actual stop distance.
This is where most traders miscalculate risk. They adjust the stop to fit their preferred lot size instead of adjusting the lot size to fit the logical stop.
DayTradersDiary.com’s Position Size Calculator takes a lot of that uncertainty out of it. Input the account risk, stop distance and instrument details, then let the position size dictate the structure of the trade, instead of pushing the structure to meet a preconceived position.
The same logic applies when the Stochastic signal is late.
If you need several candles for confirmation and the entry is not around the pullback bottom, assess if the potential gain left is worth the extra risk.
A verified entry is not necessarily a good entry.
Still, execution quality counts.
How to Handle Late Stochastic Signals
Sometimes the great-looking crossover occurs after the motion has been made.
This creates a common psychological trap.
You waited for confirmation, and now you feel punished for being patient.
The temptation is to chase.
Instead, measure the deterioration.
If your planned entry was near 1.2000, your stop is 1.1980, and the Stochastic confirmation only appears after the price reaches 1.2015, the trade structure has changed.
Your risk may now be larger, while the available reward is smaller.
This is where a predefined entry deterioration rule becomes useful.
For example, you might decide not to take a trade if delayed confirmation increases the initial risk beyond a certain percentage of the original planned risk.
That prevents patience from turning into late chasing.
A useful strategy does not require you to take every confirmed signal.
How to Journal a Stochastic Trend Strategy
Most traders journal whether the trade won or lost.
That is not enough if you are trying to improve a setup.
For each stochastic trend fusion entry, record the trend classification, pullback depth, location type, Stochastic reading at the beginning of the pullback, Stochastic reading at entry, and whether price confirmation was present.
Also document the market condition.
How volatile was it?
Coming up something big in the news?
Was the flow growing or getting clogged?
Was the pullback shallow, typical or deep compared to recent impulses?
The downloadable Trade Journal Template can become much more useful when you tag trades this way.
After enough samples, review the results by category.
You may discover that your best trades do not occur when the Stochastic reaches below 20.
They may occur when a strong trend experiences only a pullback to the 35 to 45 region before rotating higher.
That would be a valuable discovery because it challenges the standard rule many traders follow without testing.
You may also find that the strategy performs well only during certain sessions or volatility conditions.
The journal turns a familiar indicator into a strategy with measurable behavior.
Measure the Quality of the Setup, Not Just the Result
A good trade can lose.
A poor trade can win.
This matters because Stochastic strategies are especially vulnerable to outcome bias.
If you buy every oversold reading and one produces a large winner, you may believe the method works.
But the journal may reveal that the winner ignored your trend rules and occurred during an unusually strong reversal.
Separate your review into setup quality and outcome.
For example, score each trade based on:
Trend clarity.
Quality of the pullback location.
Momentum rotation.
Price confirmation.
Execution quality.
A five-point or ten-point scoring system is enough.
The objective is to determine whether higher-quality fusion setups actually produce better expectancy.
If they do not, investigate why.
Your trend filter may be too slow.
Your Stochastic confirmation may create excessive entry delay.
The pullback zone may be too broadly defined.
The strategy improves through these questions, not by endlessly changing indicator settings.
When Stochastic Trend Fusion Works Best
This method is most logical when the market has enough directional structure for pullbacks to have meaning.
It can be particularly useful in liquid sessions where price is producing identifiable impulses and retracements.
It becomes less reliable when the market is rotating randomly through a narrow range or when a major news event temporarily overrides normal technical behavior.
The method can also struggle when traders force it onto every instrument.
Different markets have different volatility characteristics. A Stochastic setting or pullback rule that works reasonably on EUR/USD may behave differently on gold, an index, or a highly volatile currency pair.
The answer is not to create a separate complicated system for every instrument.
Start with the same logic and test whether the behavior is stable.
Scaling a Strategy Requires More Than Finding Entries
Eventually, the challenge changes.
When your account is small, finding a few good setups may be the main problem.
As your trading develops, capital efficiency and risk control become more important.
A strategy with a positive expectancy is still limited by the amount of capital you can responsibly deploy.
This is why some serious traders consider proprietary trading evaluations.
The5ers evaluation program can be viewed as a structured pathway for traders who already have a tested process and want to demonstrate that they can operate within defined risk limits. The appeal is not simply access to larger capital. The evaluation process can also expose weaknesses in execution, position sizing, and emotional discipline.
It is worth comparing different models. FTMO and Topstep, for example, have different program structures, instruments, and rule frameworks. The right choice depends on what you trade and whether the rules fit your actual strategy.
A Stochastic trend fusion method that requires waiting for selective pullbacks may be well-suited to a trader who values quality over trade frequency. But the evaluation rules still need to match the strategy.
Before considering any evaluation account, ask whether your historical performance has been achieved while respecting limits similar to the program you are evaluating.
If the answer is yes, exploring a The5ers evaluation account may be a logical next step for a trader looking to scale a proven process rather than searching for a shortcut.
Frequently Asked Questions
Is the Stochastic Oscillator good for day trading?
Used as a momentum and timing tool rather than a stand alone buy or sell signal, it might be effective for day trading. Its value usually improves when the trend direction and price location are determined first.
What is the best Stochastic setting for day trading?
There is no one best setting for all. The standard 14, 3, 3 setup is a good baseline, but shorter ones are more responsive, and longer ones filter out more noise. Which is better depends on the instrument, the time frame and the holding period.
Should I buy when the Stochastic is below 20?
No, not by default. If the market is in a strong decline, an oversold reading can stay that way while the price keeps decreasing. A stronger setup has a definable trend, relevant price location, momentum rotation, and price confirmation.
Should I sell when the Stochastic is above 80?
No, it’s not automated. A strong uptrend can signal that an overbought reading will continue the upward momentum. Unless you are trading against the trend , simply selling because the indicator is above 80 is frequently a bad idea .
How do you combine Stochastic with trend?
First, define the market direction using price structure or similar trend filter. Then wait for a pullback to some meaningful area. Identify momentum turning back toward the existing trend using the Stochastic and confirm the entry with price behavior.
Can Stochastic be used with moving averages?
Yes. A moving average can help define directional bias, while the Stochastic helps time pullbacks. However, price structure should still be monitored because moving averages can lag after a trend change.
Why does the Stochastic give false signals?
False signals are typically generated by the indication being utilized without context. A crossover inside a range, on a news shock, or against a strong trend may have quite different consequences than the same crossover at a designed pullback level.
Is Stochastic better in a trending or ranging market?
The interpretation changes. In a range, overbought and oversold levels may be useful for identifying potential reversals. In a trend, the oscillator is often more useful for timing pullbacks in the direction of the larger move.
The Final Takeaway
The Stochastic Oscillator becomes far more useful when you stop asking it to predict reversals.
Its real value for an active day trader is often in showing when a pullback has created a momentum reset and when that momentum may be rotating back toward an established trend.
For your next 20 trades, try one change.
Do not take a Stochastic crossover unless you can identify the trend, define the price location before the signal appears, and explain exactly what price behavior would invalidate the setup.
Then journal the difference between shallow and deep pullbacks.
You may find that your edge is not hidden in a new Stochastic setting at all. It may be hidden in the market conditions you were previously ignoring.
Next read: Explore How To Trade Retrace With Three Confirmation Steps to build a more structured process for deciding when a pullback is actually ready for entry.