
Two forex trades can look completely different on the chart and still represent almost the same market bet.
That is where many active traders get caught.
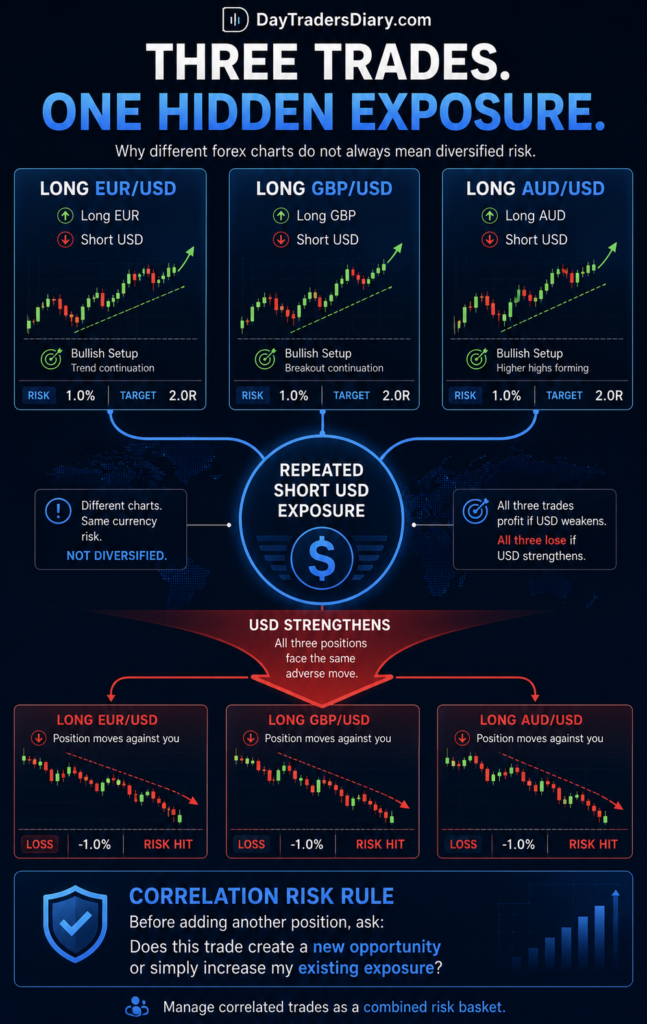
A trader buys EUR/USD because the setup looks bullish. A few minutes later, GBP/USD forms another clean long setup. Then AUD/USD breaks higher, so another position is added. The trader sees three independent opportunities.
The market may see one large short-dollar position.
If the U.S. dollar suddenly strengthens, all three trades can lose together. The problem was not necessarily bad analysis on any individual chart. The problem was hidden correlation exposure.
This is why judging FX correlation strength matters. A forex correlation matrix can tell you which instruments have moved together, but the number itself is not the trading decision. The real skill is understanding whether that relationship is stable enough, recent enough, and relevant enough to affect the position you are about to take.
A correlation of 0.85 can be useful information. It can also be almost useless if it was calculated over the wrong period or if the relationship is breaking down.
The practical objective is not to find two currency pairs with a high correlation coefficient and unquestioningly trade them. It is to answer four better questions:
What is actually driving the relationship?
How strong is it in the timeframe I trade?
Is the correlation stable or already changing?
How much hidden exposure am I creating if both trades move against me?
This guide approaches the forex correlation matrix as a risk and decision-making tool rather than another indicator to add to the chart.
Why FX Correlations Exist in the First Place
The most serious mistake is treating correlation as if it were a permanent property of two currency pairs.
It is not.
Correlation is an observation about how two return series moved over a selected period. Change the lookback period, timeframe, or market regime, and the number can change significantly.
The relationship usually comes from common drivers.
The US dollar is obvious. In April 2025, 89.2% of FX trades involved dollars, according to the BIS Triennial Survey. The dollar’s supremacy allows many USD pairings to react to the same broad dollar impulse.
Universal exposure doesn’t guarantee association.
Dollar depreciation could help EUR/USD and GBP/USD. If the Bank of England surprises, GBP/USD may increase quickly. EUR/USD barely moves. Both pairs have USD but can fall apart.
That is why a useful FX correlation strategy starts with the driver and only then checks the statistical relationship.
The BIS has also documented how higher-volatility environments can change FX market activity and trading behavior. More broadly, financial-market research on regime changes shows that volatility and cross-market relationships can vary across regimes rather than remaining stable through time.
The lesson for day traders is that a correlation matrix is a snapshot, not a market law.
What FX Correlation Strength Actually Means
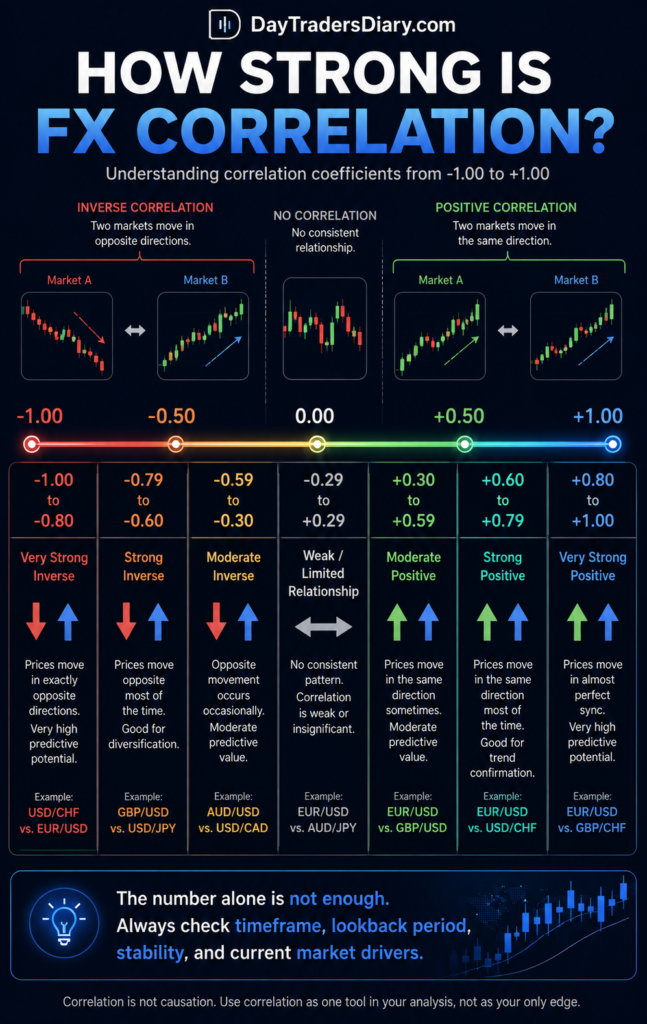
The most frequent statistic used is the Pearson correlation coefficient, generally denoted as r.
The coefficient ranges from -1 to +1.
A value near +1 means the two return series have tended to move in the same direction.
A value near -1 means they have tended to move in opposite directions.
A value near 0 means there has been little linear relationship over the selected sample.
The basic FX correlation strength formula:
r = Cov(X, Y) ÷ [σX × σY].
In this equation, Cov(X, Y) reflects the covariance of two instrument values, whereas σX and σY show their standard deviations.
You do not need to calculate covariance manually before every trading session. A spreadsheet, trading platform, or FX correlation strength calculator can do the arithmetic.
What matters is understanding what the number is telling you.
A practical interpretation might look like this:
Correlation coefficient: Practical interpretation
+0.80 to +1.00 Very strong positive relationship
+0.60 to +0.79 Strong positive relationship
+0.30 to +0.59 Moderate positive relationship
-0.29 to +0.29 Weak or limited linear relationship
-0.30 to -0.59 Moderate inverse relationship
-0.60 to -0.79 Strong inverse relationship
-0.80 to -1.00 Very strong inverse relationship
These ranges are only a starting point.
A correlation of +0.70 calculated from 250 daily observations has a different practical meaning from +0.70 calculated from the last 20 five-minute candles.
Sample size, timeframe, volatility, and stability all matter.
Use Returns, Not Raw Prices
This is one of the most overlooked parts of building a forex correlation matrix.
Correlation should generally be calculated from returns or percentage changes, rather than simply comparing raw price levels.
For example:
Return = (Current Price − Previous Price) ÷ Previous Price
For very short-term trading, log returns can also be used.
Why does this matter?
Two price series can appear visually related simply because both have trended over the selected period. Calculating correlation from returns gives you a cleaner measure of how their actual movements relate from observation to observation.
Day traders can calculate correlations using:
Five-minute short-term returns.
Hourly or 15-minute intraday returns.
Portfolio-wide daily returns.
There is no universally correct timeframe.
The correct timeframe is the one that matches the decision you are making.
If you hold trades for 20 minutes, a 90-day daily correlation may be interesting background information, but it may not be the most useful measure of current intraday exposure.
The Forex Correlation Matrix Is Only the Starting Point
A forex correlation matrix displays multiple pairwise relationships at once.
Imagine you trade EUR/USD, GBP/USD, AUD/USD, USD/JPY, and USD/CHF.
Instead of checking each relationship manually, the matrix allows you to However, the matrix should answer a query, not offer a trading technique.
Ask before taking numerous jobs:
Do these trades share currency risk?
Does my trading timeline have high correlations?
Have they remained stable recently?
Does one macro event affect all of them in the same direction?
A trader who is long EUR/USD, long GBP/USD, and long AUD/USD may have three different technical setups but one dominant theme: broad USD weakness.
The charts are separate.
The risk may not be.
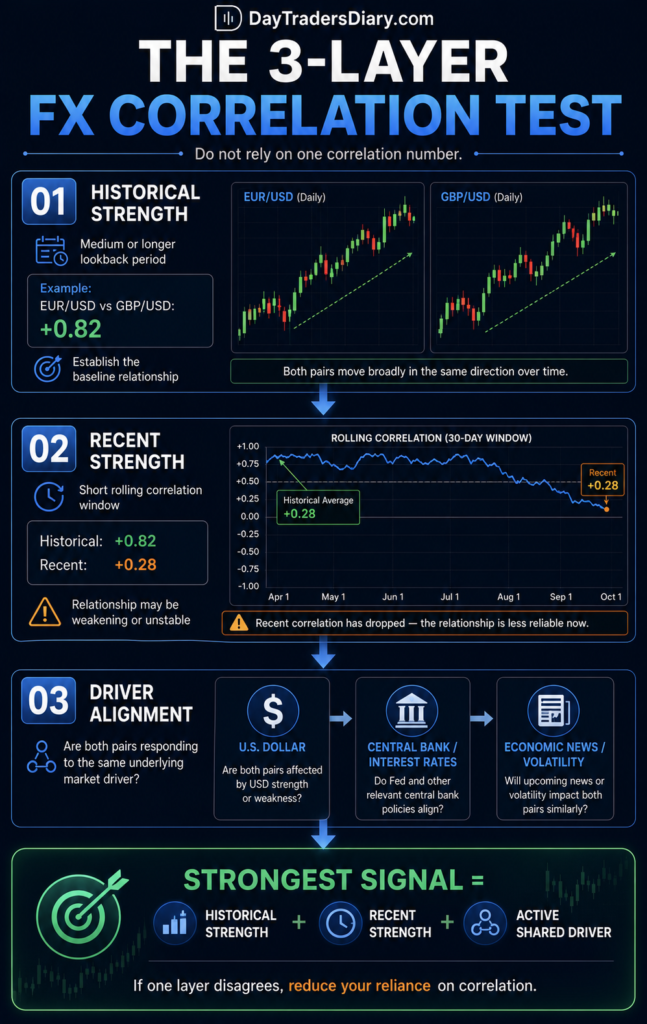
A Better Way to Judge Correlation Strength: The Three-Layer Test
Instead of looking at one correlation number, use three layers.
Layer One: Historical Strength
Start with a medium lookback period appropriate for your style.
For an intraday trader, this might be the previous 100 to 200 hourly observations.
For a swing trader, it might be 60 to 120 daily observations.
This gives you the baseline relationship.
Suppose EUR/USD and GBP/USD show a correlation of +0.82.
That tells you they have moved strongly together during the sample.
Do not trade yet.
Move to the second layer.
Layer Two: Recent Strength
Now, calculate the same relationship using a shorter rolling window.
Perhaps the last 20 or 30 observations.
Suppose the longer correlation is +0.82, but the recent correlation has fallen to +0.28.
That is important.
The historical relationship is strong, but the current market is behaving differently.
This can happen when one currency develops its own catalyst.
For example, EUR may be responding primarily to ECB expectations while GBP is reacting to domestic inflation data.
The common USD element may no longer drive short-term price movement.
Layer Three: Driver Alignment
This is where pure statistical analysis becomes practical trading analysis.
Ask what is currently moving the pairs.
If EUR/USD and GBP/USD have a strong positive correlation and both are moving because of a broad shift in U.S. rate expectations, the relationship has a logical driver.
If the correlation is high but the current session contains separate EUR and GBP catalysts, the relationship may be more fragile.
A correlation number becomes more useful when the statistical evidence and market driver tell the same story.
The Correlation Stability Score
A single correlation reading can hide instability.
A more useful method is to compare multiple rolling periods.
For example:
Longer-term correlation: +0.84
Medium-term correlation: +0.76
Recent correlation: +0.71
This relationship is not only strong. It is relatively stable across the selected windows.
Now compare:
Longer-term correlation: +0.82
Medium-term correlation: +0.47
Recent correlation: -0.10
The average historical number may still look impressive, but the relationship is deteriorating.
A basic Correlation Stability Score:
Stability Score = One minus the average absolute difference between rolling correlations.
The concept is more important than mathematical correctness, but the formula can be adjusted.
The association is more reliable if the correlation is consistent across windows.
If the number changes dramatically, reduce your reliance on it.
This is particularly useful for traders who build a forex correlation strategy around hedging, confirmation, or exposure control.
Correlation Can Change Faster Than Your Spreadsheet
One of the weaknesses of correlation calculators is that they can create a false sense of precision.
The formula may be mathematically perfect, while the trading interpretation is outdated.
Suppose your correlation matrix updates every morning.
At 08:00, EUR/USD and GBP/USD show +0.88.
At 10:00, unexpected UK data creates a sharp independent move in sterling.
Your morning number has not become mathematically wrong.
It has become less relevant.
That is why correlation should be treated as a rolling market condition.
During major news periods, a pair can temporarily detach from its normal relationships.
This connects directly with our guide on how to quantify news volatility before entry. A highly correlated environment can change quickly when one currency receives an unexpected fundamental shock.
Correlation Is Not the Same as Causation
This is obvious, but sometimes traders break it.
If EUR/USD and GBP/USD are highly correlated, you can buy one and not push the other.
The same thing may influence both.
The difference is important because the common element can drop out.
A dealer might say:
“EUR/USD is breaking up, and GBP/USD should follow.
Such logic is bad.
A better wording:
EUR/USD and GBP/USD are reacting to broad USD weakness and have had strong sustained positive connection recently. “GBP/USD has not confirmed the rise so I will watch to see if the underlying factor impacts sterling.
That is a much more professional use of correlation.
Correlation should create a hypothesis.
Price action still needs to confirm or reject it.
How to Use FX Correlation as a Trade Confirmation Tool
Correlation works best as a secondary filter.
Imagine you are considering a long EUR/USD trade after a breakout.
Before entering, you check GBP/USD.
If both pairs are historically and recently positively correlated, and GBP/USD is also showing strength, the broader signal may support your idea.
But it does not require perfect synchronization.
Different pairs have different volatility characteristics and may react at different speeds.
The more useful question is:
Is the correlated market confirming the same underlying currency theme?
For example, if EUR/USD breaks higher but GBP/USD and AUD/USD are both falling, broad USD weakness is not strongly confirmed.
That does not automatically invalidate the EUR/USD trade.
It may mean the move is being driven by EUR-specific demand rather than a broad dollar theme.
That distinction can help you adjust your confidence, position size, or target expectations.
How to Use Negative Correlation
Inverse relationships can be just as useful.
A classic example is holding positions that represent opposing exposure to the same currency.
Suppose you are long EUR/USD and considering a long USD/CHF position.
Depending on the current relationship between EUR/USD and USD/CHF, the second trade may offset some of the first trade’s exposure rather than add more directional risk.
But do not assume historical inverse correlation will function as a perfect hedge.
The hedge ratio matters.
The stability matters.
The current driver matters.
A poor hedge can create the illusion of diversification while adding unnecessary complexity.
The Hidden Exposure Test
Turn the trading idea into currency exposure before you open a second or third FX position.
Think about:
Bought EUR/USD.
Buy GBP/USD.
AUD/USD Long.
Not three random long balls.
They stand for:
Long EUR and short USD.
Long GBP and short USD.
Long AUD and short USD.
The currencies on the left are different.
The short-dollar exposure is repeated.
Now, imagine each trade risks 1R.
You may have three independent 1R trades.
If correlation is high and the dollar suddenly strengthens, the practical outcome can resemble a concentrated multi-R loss.
A useful question before adding positions is:
If the shared currency experiences a sudden one-directional move, how many of my trades are vulnerable at the same time?
This is often more valuable than the correlation coefficient itself.
Build a Correlation-Adjusted Risk Model
Here is a simple framework.
Suppose you have three open positions.
Trade A risk: 1R.
Trade B risk: 1R.
Trade C risk: 1R.
Nominal portfolio risk: 3R.
But if all three trades are highly positively correlated, your diversification benefit is limited.
You can create a rough Correlation-Adjusted Exposure Score by weighting additional trades according to their correlation with existing exposure.
For example, if Trade B has a correlation of +0.90 with Trade A, you might not treat the second trade as a completely independent 1R opportunity.
You could reduce its size.
Or you could establish a maximum combined risk for the correlated group.
A practical approach is to group trades into themes.
For example:
USD weakness basket.
JPY strength basket.
Commodity currency basket.
Risk-on basket.
Instead of allowing 1R risk on every trade, set a maximum total risk per basket.
That is often easier to execute than trying to calculate a perfect portfolio variance model during a fast trading session.
When High Correlation Is Useful and When It Is Dangerous
High correlation is useful when you want confirmation.
It can help you determine whether a move is broad or isolated.
It is useful when monitoring hidden exposure.
It is useful when deciding whether a second trade adds diversification or increases the same bet.
High correlation becomes dangerous when traders confuse multiple positions with diversification.
Three charts do not equal three independent opportunities.
The danger increases when the trader enters all positions after seeing the same catalyst.
If the setups are driven by one macro factor, one unexpected reversal can damage the entire group.
This is especially important around high-impact events. Market relationships can become tighter when one dominant macro force controls several pairs, then rapidly diverge when currency-specific information takes over.
A Practical FX Correlation Trading Routine
Before the trading session, identify the currencies and pairs you are most likely to trade.
Calculate your medium-term and recent correlations.
Then identify the current dominant drivers.
During the session, do not continuously stare at the matrix. Use it when a portfolio decision needs to be made.
Before adding a correlated trade, ask whether it improves opportunity or duplicates exposure.
If the new trade is highly correlated with an existing position, choose one of three actions.
Take only the stronger setup.
Reduce the position size.
Add the trade, but treat both positions as one combined risk basket.
This approach is more practical than trying to predict every correlation change.
Correlation and Breakout Trading
Correlation becomes particularly useful during breakouts.
Suppose EUR/USD breaks above a major intraday level.
If GBP/USD and AUD/USD are also breaking higher while the dollar is broadly weakening, the breakout has broader participation behind it.
If EUR/USD breaks higher alone while the other major USD pairs remain unchanged or move lower, the breakout may be currency-specific.
Again, this does not mean the isolated breakout must fail.
It tells you what type of move you may be trading.
A broad theme can support continuation.
An isolated theme may be more dependent on the specific currency catalyst.
This can also complement the framework in our guide on how to estimate the likely retracement after a breakout. The breadth of correlated confirmation can help frame whether a pullback is occurring inside a broad market move or whether the breakout itself lacks wider support.
The Most Common Correlation Mistake: Using the Wrong Timeframe
A day trader using a weekly correlation to manage a five-minute trade is often working with irrelevant information.
A five-minute trader using only the last 10 candles can have the opposite problem.
The sample is too small and too noisy.
A practical solution is to use a hierarchy.
Use a higher timeframe correlation to understand the broader relationship.
Use a medium timeframe to evaluate the current regime.
Only track immediate alignment to the execution schedule.
A day trader could use:
Correlation of daily structural context.
Correlation per hour: current regime
Confirmation: short-term. 5-15 minutes correlation.
You do not need all three numbers to agree perfectly.
You are looking for evidence of stability or evidence of change.
Correlation Can Help You Avoid Overtrading
Many traders think overtrading means taking too many setups.
Sometimes it means taking the same setup repeatedly under different names.
You buy EUR/USD.
Then GBP/USD forms a similar pattern.
Then AUD/USD produces another signal.
Psychologically, each new chart feels like a fresh opportunity.
But the exposure may be nearly identical.
This creates a dangerous form of confirmation bias.
The trader sees the same market idea appearing everywhere and mistakes repetition for diversification.
A correlation check introduces friction into that process.
Before selecting buy or sell, ask: Would I still take this trade if I already examined all associated holdings as one combined idea? That inquiry alone can prevent a startling amount of unwanted trades.
Risk Management and Position Sizing With Correlated Trades
This is where correlation analysis becomes operational.
Suppose your normal risk per trade is 1 percent.
You already hold a long EUR/USD position.
A highly correlated GBP/USD setup appears.
Taking another full 1 percent risk may create more concentrated exposure than your plan intended.
You could split the risk.
For example, 0.6 percent on EUR/USD and 0.4 percent on GBP/USD.
Or you could keep the original trade and skip the second.
The correct choice depends on setup quality and your testing.
This is where most traders miscalculate risk. They calculate position size separately for each chart but ignore the relationship between the positions.
Position Size Calculator on DayTradersDiary.com eliminates trade calculation guesswork. Next, add a portfolio-level rule to prevent connected investments from silently increasing exposure.
Individual position sizing is necessary.
Correlation-adjusted exposure management is what connects those individual decisions.
What to Record in Your Trade Journal
If correlation is part of your decision process, it should be part of your journal.
The downloadable Trade Journal Template can be used to add a few simple fields:
The primary currency exposure.
Correlation with existing positions.
Correlation lookback period.
Recent versus historical correlation.
Trade basket or market theme.
Combined risk at entry.
Whether the correlated market confirmed or contradicted the setup.
After 30 to 50 trades, review the results.
You may discover that your best trades occur when correlation confirms the broader move.
Or you may find the opposite.
Your strongest setups occur when one pair temporarily diverges from its normal relationship because of a currency-specific catalyst.
That would be valuable information.
The objective of journaling is not to prove that correlation works.
It is to discover how correlation interacts with your specific strategy.
Measure Correlation Performance, Not Just Correlation Accuracy
A trader can correctly identify a +0.85 correlation and still lose money using it.
The correlation number is not the outcome.
Track the performance of trades by correlation condition.
For example:
Trades with strong positive confirmation.
Trades with weak confirmation.
Trades where correlated pairs diverged.
Trades with many linked securities.
Then compare:
Winning rate.
R. average.
Maximum Adverse Excursion (MAE) .
Average drop .
Quality of execution.
A strong correlation improves the win rate but decreases the average payment when the move becomes crowded.
Or you may discover that divergence produces fewer winners but larger trends.
These are strategy-specific findings that no generic forex correlation matrix can provide.
A More Advanced Metric: Correlation Drift
Instead of asking only, “What is the correlation now?” measure how quickly it is changing.
A simple approach is:
Correlation Drift = Current Rolling Correlation − Previous Rolling Correlation
Suppose the 20-period correlation was +0.82 and has fallen to +0.50.
The drift is:
+0.50 − +0.82 = -0.32
A sharp negative drift tells you the relationship is weakening.
Now suppose the longer-term correlation is +0.70, but recent values move:
+0.42
+0.55
+0.68
+0.76
The relationship is strengthening.
This can be useful when deciding whether a common market factor is becoming dominant again.
Correlation drift should not be traded mechanically. It is a context signal.
But it can prevent you from relying on a relationship that is already breaking down.
How a Forex Correlation Strength Calculator Should Be Used
A good calculator should allow you to change:
The instruments.
The timeframe.
The lookback period.
The return interval.
You should compare more than one window.
For example, instead of asking for one EUR/USD versus GBP/USD number, calculate:
20-period correlation.
50-period correlation.
100-period correlation.
Then compare the results.
If all three show strong positive correlation, the relationship is more stable than if they show +0.90, +0.42, and -0.15.
The calculator gives you the measurement.
Your process determines whether that measurement is useful.
Scaling an Edge Requires Better Exposure Control
A trader can have a genuine edge and still struggle to scale because the risk process does not expand with the account.
This is particularly relevant when moving from a small personal account to a larger trading allocation.
A three-position correlated mistake that costs 3R on a small account can become psychologically and financially more significant when the same process is repeated with larger capital.
That’s why serious traders consider evaluation accounts. Professional reviews force traders to trade within loss limits and expose overtrading, common exposure and inconsistent sizing.
The 5ers can be worth considering if their current evaluation structure and rules fit your trading style. It is sensible to compare it with FTMO and other proprietary trading firms rather than assuming one model fits every strategy.
Comparisons should focus on practical issues. To what extent can you risk associated positions? What are the daily and overall loss limits? Does your typical holding style follow program rules?
Does your strategy involve a lot of news trading or holding during volatile periods?
An evaluation account is not a shortcut to bad risk management. In many ways, it makes discipline more important, as correlated losses can eat into risk limits faster than a trader anticipates.
If your technique is previously tested and you can show that your edge survives realistic execution and correlation adjusted risk, a The5ers evaluation account can be a reasonable approach to explore larger trading capital.
Frequently Asked Questions About FX Correlation Strength
What is a strong forex correlation?
A correlation close to +1 or -1 suggests a stronger linear relationship. In practical terms, numbers over about +0.70 or below -0.70 are frequently regarded strong, although the number should always be analyzed in combination with the time frame, lookback period, sample size, and current market regime.
How do you calculate FX correlation strength?
Pearson correlation formula:
r = Cov (X,Y)/(σX*σY). X and Y in forex research represent returns or percent price movements, not raw prices.
What is the best timeframe for a forex correlation matrix?
It is contingent upon your holding duration … optimum time frame. A day trader should normally be focused on correlations seen in intraday data . But you should still look at greater periods for context .
Can forex correlation change?
Yes. Correlations change. Central bank policies, economic data, geopolitical events, volatility fluctuations and currency specific catalysts can all weaken or strengthen previously steady ties.
Can correlated forex pairs be used as confirmation?
Yes, however confirmation should not replace technical or fundamental analysis, it should reinforce the underlying market concept. If a linked pair is moving in the expected direction it may corroborate a broader currency theme while divergence may be an indication that the move is currency specific.
How can correlation help manage forex risk?
Correlation discovers hidden concentration. Although trades could look diverse as they include multiple pairs, they could all be exposed to the same currency or macro factor. Grouping a set of strongly linked holdings in a single risk basket may provide better exposure control.
Is a correlation of 1 always good for trading?
No. A correlation of +1 indicates an extremely strong same-direction relationship in the sample. From a portfolio perspective, holding both instruments provides little diversification.
What is the biggest mistake when using forex correlation?
The biggest mistake is treating a historical correlation as permanent. A correlation matrix describes a selected period. Traders need to check whether the relationship remains stable and whether the same underlying driver is still active.
The Final Takeaway
The best use of FX correlation is not prediction.
It is exposure awareness.
A forex correlation matrix can show you which markets have been moving together. A correlation strength formula can quantify that relationship. A correlation strength calculator can make the measurement easy.
But the edge comes from asking the next question.
Why are these markets moving together, and is that reason still active?
Before your next trading session, choose the five currency pairs you trade most often. Calculate their medium-term and recent correlations. Then identify the shared currency exposure behind each potential position.
For the next 20 trades, record whether your setup had strong correlation confirmation, weak confirmation, or active divergence.
At the end of those trades, do not judge correlation by whether the number looked accurate.
Judge it by whether it improved your decisions.
Next read: Review our guide on How To Classify Trend Strength With ADX Clusters. Correlation tells you whether related markets are moving together. Trend strength helps you judge whether the move is actually strong enough to trade.