
A trader sees ADX at 28 and immediately thinks, “Strong trend. Time to buy.”
That is one of the easiest ways to misuse the Average Directional Index.
ADX does not tell you whether the market is bullish or bearish. It does not tell you where to enter. It does not tell you whether the next candle will continue in the same direction.
It tells you something more specific: how directional the recent price movement has been and whether that directional behavior is strengthening or weakening.
The problem is that most traders treat ADX as a single number.
Twenty-five means trending.
Thirty means strong.
Forty means very strong.
That approach throws away much of the information contained in the indicator.
A better method is to classify ADX clusters.
Instead of asking, “What is ADX right now?”, ask:
Where has ADX been? Where is it going? How long has it been there? What is price doing while it is there?
That transforms ADX from a simple trend strength filter to a market state framework.
The method below is designed for active day traders who want to distinguish among emerging, established, and exhausted trends, as well as markets that appear strong only because of a temporary volatility burst.
What an ADX Cluster Actually Means
An ADX cluster is a series of ADX readings that remain within a specific strength zone, or act in a similar fashion throughout multiple candles.
Take, for example, ADX values on a five-minute chart:
18, 19, 20, 21, 23, 25, 27, 29, 31, 32.
That is not simply an ADX reading of 32.
It is a transition from non-trending conditions into expanding directional strength.
Now compare it with:
34, 36, 38, 39, 38, 37, 35, 33, 31.
The current ADX may still be 31, which looks strong.
But the cluster tells a different story.
The market has already experienced a substantial expansion in strength, and ADX is now contracting.
That distinction can completely change how you manage a trade.
The first sequence can represent the development of a trend.
The second can represent trend maturity or deterioration.
This is why I prefer to analyze ADX as a sequence rather than a snapshot.
Why ADX Alone Is Not Enough
The ADX is part of the Directional Movement Index system, which also comprises ADX, +DI and -DI. The ADX assesses the strength of a trend, and the directional indicators assist determine if positive or negative directional movement is dominant. Fidelity explains that ADX is on a scale of 0 to 100, with values over around 25 often seen to indicate a stronger trend and values lower than about 20 often seen as a trendless environment.
That distinction matters.
Suppose ADX is 30.
You still need to know whether +DI is above -DI or vice versa.
You also need to know whether ADX is rising or falling.
And as a day trader, you need to know what the price structure is doing.
An ADX value of 30 during a sequence of higher highs and higher lows is a completely different trading environment from an ADX value of 30 when price repeatedly fails at resistance.
The number is identical.
The market state is not.
What the Research and Professional Sources Tell Us
Fidelity’s current ADX research notes that a rising ADX generally indicates a strengthening trend, while a falling ADX suggests weakening directional strength. It also emphasizes that ADX determines strength rather than direction, with +DI and -DI providing the directional context.
That is the first important lesson for day traders.
A rising ADX is not automatically bullish.
If -DI is dominating +DI, rising ADX can mean the bearish move is becoming more directional.
Charles Schwab similarly describes ADX as a gauge of trend strength rather than direction. Its current educational material identifies readings below 20 as generally non-trending, readings in the 20 to 25 range as potentially developing trends, readings above 25 as stronger trends, and readings above 40 as very strong conditions that can also coincide with a mature move.
Notice the wording.
Very strong does not automatically mean a better entry.
That is where many traders go wrong.
A market can become extremely directional after the best entry has already passed.
Fidelity’s technical analysis material also explains that Welles Wilder developed ADX and can be applied across timeframes, while emphasizing that the indicator measures trend strength rather than direction.
For a day trader, that means ADX should be treated as a context filter rather than an entry trigger.
The Five ADX Strength Clusters
Rather than using only the classic 20 and 25 thresholds, you can divide ADX behavior into five practical clusters.
These are not the laws of the market for all time. They are working categories that make the indicator easier to interpret consistently.
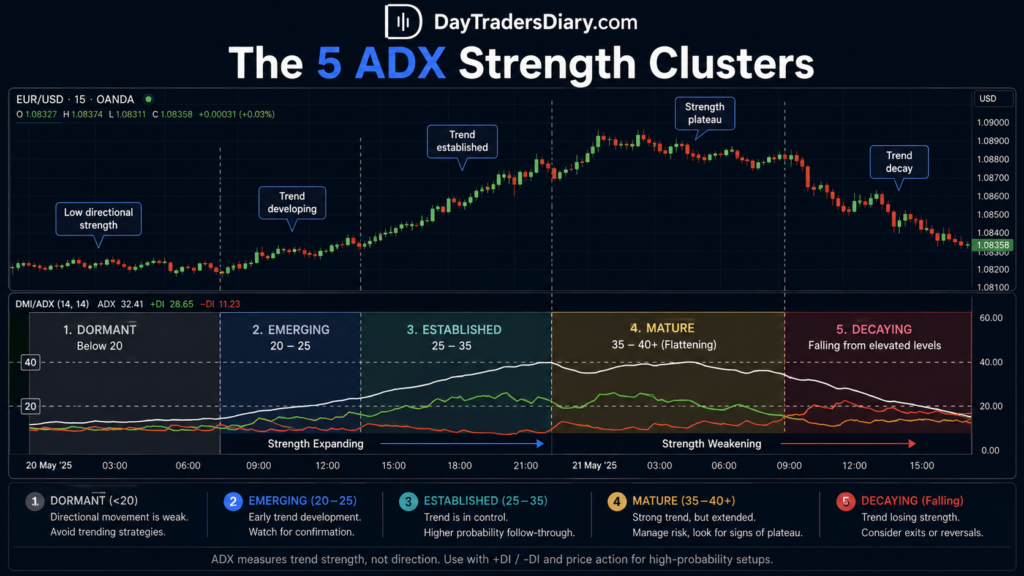
Cluster One: Dormant ADX
ADX below approximately 20.
This is the environment in which trend-following signals warrant skepticism.
The price can still move substantially, but there is little directional persistence.
You could see:
Price over a moving average
Bull Cross.
Candle breakout.
A few green candles lined up.
But if ADX stays subdued, then the move might not have the durability needed for a sustained trend.
This does not mean you cannot trade.
It means your strategy should recognize that the market may still be in a rotation.
This is where range trading, mean reversion, or waiting for directional expansion may make more sense than unthinkingly following breakouts.
Cluster Two: Emerging Trend
ADX moves from below 20 toward 25.
This is one of the most interesting zones for active traders.
Why?
Because you are not looking at an already mature trend.
You are looking at a change in market state.
Imagine ADX moves:
17
18
19
21
22
24
26
At the same time, price breaks a well-defined resistance level, and +DI moves above -DI.
That combination is far more informative than simply seeing ADX at 26.
You have:
A previous low-strength environment.
An expansion in ADX.
Directional confirmation from DMI.
Price structure confirming the move.
This is the type of cluster that can identify the early stages of a trend.
Cluster Three: Established Trend
ADX remains above 25 and continues to climb or stays at high levels.
For instance:
25 27 29 31 33 34 35
This is where trend-following systems can become more enticing.
But there is an important distinction.
An established trend does not mean chase.
If the price has already moved several ATRs from its original breakout, entering simply because ADX is high may put you in a poor position.
Instead, use the strong ADX cluster to change how you interpret pullbacks.
A pullback that would concern you during a low-ADX market may be completely normal during a strong trend.
This is one of the best practical uses of ADX.
It can change the meaning of price behavior.
Cluster Four: Mature Trend
ADX remains high but begins flattening.
For example:
35
37
39
40
40
39
38
37
The market may still be trending.
That is important.
A falling ADX does not automatically mean the price is reversing.
It can simply mean the rate of directional expansion is slowing.
Imagine EUR/USD has risen for 90 minutes.
It continues making higher highs.
But each new high is smaller.
Pullbacks become deeper.
ADX reaches 39 and begins falling.
That is not necessarily a short signal.
It is a warning that the trend may be moving from expansion into maturity.
Your trade management should respond accordingly.
You might stop adding to positions.
You might tighten a trailing stop.
You might demand stronger confirmation for a new entry.
Cluster Five: Trend Decay
ADX falls materially from elevated levels while the price loses structural quality.
For example:
42
40
37
34
30
27
24
At the same time, price stops making clean higher highs and begins breaking recent higher lows.
Now the ADX cluster is telling a much more important story.
Directional strength is fading.
Price structure is deteriorating.
The trend may be transitioning toward consolidation or reversal.
This is the environment where holding a trend-following position indefinitely can become expensive.
The Most Important Variable Is the Slope
Traders often focus on the ADX level.
I pay more attention to the relationship between level and slope.
Consider two markets.
Market A:
ADX = 22 and rising rapidly.
Market B:
ADX = 38 and falling rapidly.
Which one has a stronger improving trend strength?
Market A.
Which one currently has the higher absolute trend strength?
Market B.
Those are two different questions.
This is why an ADX cluster needs at least three dimensions:
Level.
Slope.
Persistence.
Then add direction and price structure.
Now you have a much more useful framework.
Build the ADX Cluster With Five Variables
For each cluster, classify:
What is the ADX level?
Is the ADX slope up, flat or down?
Cluster duration: How many candles has it remained in the zone?
DMI relationship: dominant + DI or – DI?
Price structure: is the price really in a trend?
That avoids one-number decisions.
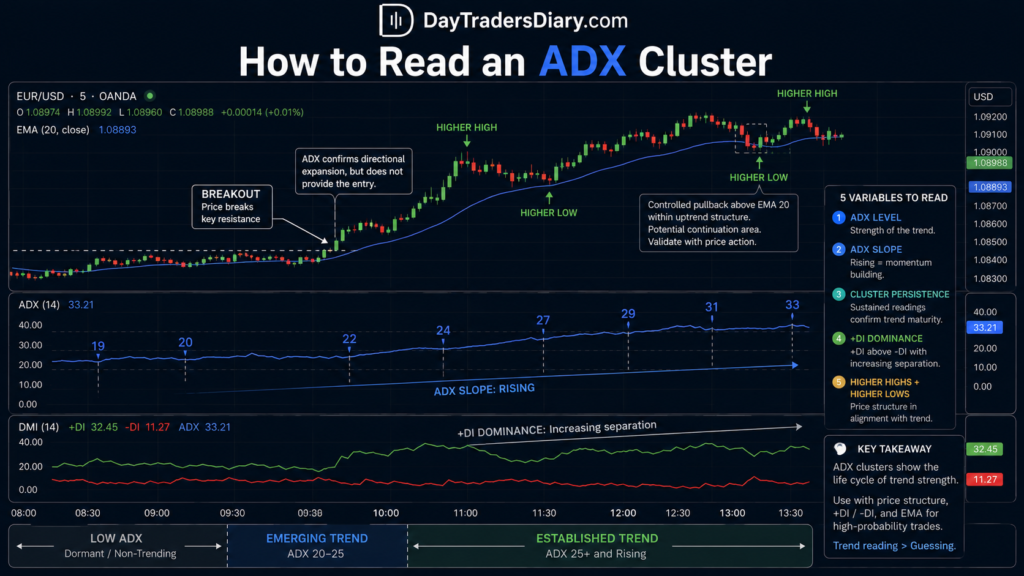
Example: Bullish Trend Expansion
Say you have EUR/USD on a 5-minute chart that shows you:
ADX:
19 20 22 24 27 29 31 33 +DI is above -DI.
The price breaks resistance and makes a series of higher highs and higher lows.
This is a high-quality trend-expansion cluster.
The ADX itself does not give you the entry.
The cluster tells you that pullback and breakout strategies may deserve more weight.
A trader could wait for a controlled retracement rather than buying the 33 ADX reading.
That is a crucial distinction.
Example: False Strength
Now consider:
ADX:
19
22
28
34
38
41
43
+DI is dominant.
Price has already moved 2.5 times its recent ATR.
The market is sitting directly beneath a major higher-timeframe resistance zone.
The ADX reading looks fantastic.
The location does not.
This is where traders get trapped by indicators.
They see “strong trend” and assume “good long.”
But a strong trend can be a terrible entry environment.
Trend strength and entry quality are different variables.
ADX Clusters and Price Structure
The best use of ADX is to validate what price is already doing.
Suppose price creates:
Higher high.
Higher low.
Higher high.
Higher low.
At the same time, ADX moves from 18 to 27 to 32.
That is coherent.
Price is becoming more directional, and the indicator confirms the strengthening trend.
Now imagine:
Price creates a higher high.
Then another higher high.
But ADX goes:
34
32
30
The price is still rising.
Yet the trend-strength cluster is deteriorating.
This can happen because the price is still moving upward, but with less directional efficiency.
That is a very different environment.
Directional Efficiency Is the Missing Concept
A market can move upward without becoming more efficient.
Imagine a stock rises 2% during the morning but does so through violent back-and-forth candles.
It technically trends higher.
But the path is inefficient.
ADX helps distinguish this type of behavior from sustained directional movement.
This is one reason I like combining ADX with price structure rather than treating it as a standalone signal.
ADX Clusters and Moving Averages
Moving averages are asking a different question.
They help to define the price, location, and direction of the trend.
ADX measures the strength of direction.
So they are complementary.
Suppose the price is above the 20 EMA.
The 20 EMA is rising.
+DI is above -DI.
ADX is rising from 21 to 29.
That is a coherent bullish environment.
Now suppose price remains above the EMA, but ADX falls from 39 to 25.
You don’t short automatically.
Recognize the market could be shifting from an extended period of growth into a more moderate trend or a period of consolidation.
This distinction can keep you out of countertrend trades ahead of their time.
ADX Clusters and Breakouts
Breakouts are one of the best applications for this framework.
Imagine a price spends two hours inside a tight range.
ADX remains between 15 and 18.
Then, the price breaks resistance.
ADX moves:
17
18
20
23
26
This is a classic transition.
The important information is not that ADX eventually reached 29.
The important information is that trend strength expanded immediately after compression.
That sequence can be more valuable than the final reading.
The Compression-to-Expansion Pattern
A particularly useful pattern is:
Low ADX cluster.
Price compression.
Range expansion.
ADX begins rising.
DMI separation.
Price holding the breakout.
ADX is still increasing.
This is telling you that the market is changing from equilibrium to directional behavior.
No guaranty of continuation.
But it puts the breakout in better context.
ADX Clusters and Pullbacks
This is where the framework becomes even more useful.
Suppose ADX is 35 and rising.
Price pulls back toward the 20 EMA.
The pullback looks bearish on a one-minute chart.
A trader might panic and exit.
But the higher-timeframe cluster says the market remains in a strong directional phase.
Now, suppose the pullback occurs while ADX is collapsing from 40 to 27, and price breaks the previous higher low.
That pullback deserves much more suspicion.
The same-looking retracement has a different meaning because the ADX state changed.
Use ADX to Change Your Trading Behavior
This is the real objective.
You should not use ADX to say:
Buy.
Use it to say instead:
“How do I trade this market?
Require more breakout confirmation when the ADX is sleeping.
Watch for early trend possibilities when ADX is rising.
When ADX is set up, focus on continuation setups.
When ADX is mature, avoid chasing extended moves.
When ADX is decaying and structure is breaking, reduce trend-following exposure.
That is a much more professional use of the indicator.
Create an ADX Cluster Score
You can formalize this without creating an unnecessarily complicated system.
Suppose you give the market a score based on five conditions.
ADX above 25.
ADX rising.
+DI above -DI for longs.
Price above the relevant trend structure.
ADX has been rising for at least three candles.
If all five are present, the environment receives a strong bullish trend score.
If only two are present, the setup may deserve less confidence.
The important part is consistency.
You are converting a subjective impression into a repeatable decision framework.
Example Scoring Framework
Imagine a 5 minute chart of EUR/USD.
ADX:28
ADX is going up. +DI is above -DI.
Price over 20 EMA.
Higher highs and higher lows.
That is five confirmations.
Now imagine:
ADX = 29.
ADX falling.
+DI > -DI.
Price below 20 EMA.
Recent higher low broken.
You technically still have an ADX above 25.
But the cluster is no longer bullish.
This is why threshold-based systems can be misleading.
Cluster Duration Matters
One ADX spike does not signal strength of the trend.
If ADX climbs from 19 to 31 on one candle owing to a huge news release.
That is very different from:
20
22
24
26
28
30
The first is a sudden shock.
The second is progressive trend development.
You can classify this as cluster persistence.
For example, require at least three consecutive readings within your strength zone before treating the state as established.
That does not automatically make the signal better.
It simply reduces the influence of isolated spikes.
News Can Distort ADX
This is especially important for day traders.
A major economic release can produce an enormous directional candle.
ADX responds to the price movement.
But the resulting reading does not necessarily mean a sustainable trend has developed.
The market may be repricing.
It may also reverse violently after the initial reaction.
Therefore, separate news-driven ADX clusters from ordinary session clusters in your journal.
A 35 ADX produced by a CPI shock should not automatically be classified the same way as a 35 ADX produced through 90 minutes of orderly trend development.
Timeframe Matters More Than Most Traders Realize
An ADX cluster on a one-minute chart can be completely different from an ADX cluster on a one-hour chart.
A one-minute ADX of 35 tells you about short-term directional behavior.
It does not necessarily tell you that the broader market is trending.
This is why multi-timeframe analysis can be useful.
You might use the one-hour ADX to determine the broader regime and the five-minute ADX cluster to determine intraday strength.
For example:
1-hour ADX ascending
5 min ADX coming out.
Price matched for both time spans.
That’s a better trend-continuation scenario than a 5-minute ADX cluster fighting a weakening higher-timeframe trend.
Do Not Mix ADX Periods Without Testing
Usually the default ADX calculation uses 14 periods. Fidelity’s DMI documentation gives details of the standard computation using Wilder’s smoothing and a given time, usually 14.
But changing the period changes the behavior of your clusters.
A 7-period ADX reacts faster.
A 14-period ADX is slower.
A 21-period ADX smooths more noise.
None is automatically superior.
The shorter setting may identify trend transitions earlier, but can also generate more false transitions.
The longer setting may filter noise but enter the classification later.
For active day trading, the question is not “which ADX setting is the best?”
This is:
What ADX level yields the most useful market condition classification for my setup?
ADX Clusters and Volatility
ADX and ATR are often confused because both respond to price movement.
They are not measuring the same thing.
ATR measures volatility.
ADX measures directional strength.
A market can have high ATR and low ADX.
That means the price is moving a lot but without a consistent direction.
This is common during volatile ranges.
A market can also have moderate ATR and high ADX.
That means movement may be relatively controlled but directionally persistent.
This distinction is extremely valuable.
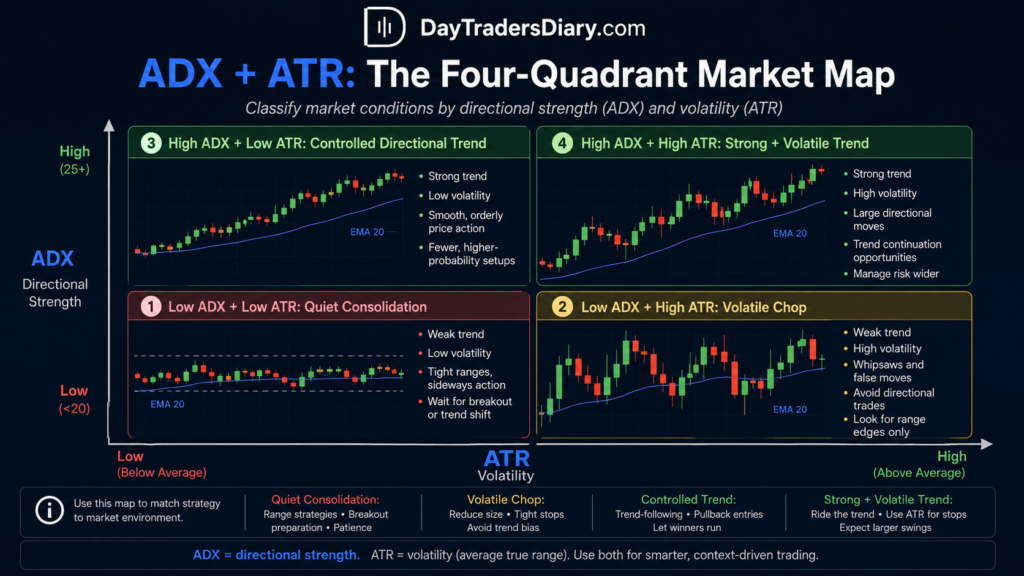
The Four-Quadrant Market Map
You can combine ADX and ATR to classify the environment.
Low ADX + low ATR means quiet consolidation.
Low ADX + high ATR means volatile chop.
High ADX + low ATR means controlled directional movement.
High ADX + high ATR indicate strong, volatile trend conditions.
These environments require different execution decisions.
A breakout strategy may perform very differently in each quadrant.
This is one of the biggest gaps in simplistic ADX tutorials.
Trend strength should not be interpreted independently of volatility.
Risk Management and ADX
ADX should never determine your position size on its own.
Suppose ADX jumps from 22 to 34.
That does not justify doubling your risk.
The market may be strengthening.
It may also be entering a high-volatility phase, in which your stop needs to be wider.
Position size should be calculated from the distance to invalidation and your predefined account risk.
This is where most traders miscalculate risk. Using the Position Size Calculator on DayTradersDiary.com removes much of the guesswork when the stop distance changes between low- and high-volatility environments.
A strong ADX reading should influence your strategy selection and trade management, not encourage uncontrolled leverage.
ADX and Stop Placement
A strong trend often produces shallow pullbacks.
That can tempt traders to place extremely tight stops.
But an ADX cluster tells you trend strength, not the exact location of market invalidation.
If the structural stop is 25 pips away, placing a 10-pip stop simply because ADX is strong does not improve the trade.
It changes the trade.
Use structure to determine invalidation.
Use ADX to understand the probability and character of directional continuation.
Then size the position accordingly.
ADX and Profit Targets
ADX clusters can also influence how aggressively you manage winners.
Suppose you enter during an emerging cluster and ADX rises steadily.
Consider giving the position more room, as the trend-strength environment is improving.
Now, ADX reaches a historical extreme and begins flattening.
You may start treating the trade as mature.
That does not necessarily mean exiting immediately.
It can mean:
Reduce new entries.
Take partial profit.
Tighten trailing management.
Demand stronger confirmation before adding.
The point is to make the management decision conditional on the market state.
Journaling ADX Clusters
If you want this method to become an actual edge, your journal needs to record more than “ADX was 27.”
Record:
entry ADX;
ADX 3 candles before entering.
ADX – 5 candles after admission.
Slope of ADX
ADX Clusters Classification. +DI and -DI Relation.
Price structure. ATR.
Session.
Type of installation.
MFE.
MAE.
Exit reason.
Then review your trades by cluster.
You may discover something surprising.
Your breakout strategy may work extremely well when ADX moves from 18 to 25.
But it performs poorly when entering with ADX already above 40.
That would be a valuable finding.
Your indicator has become a timing filter rather than an entry signal.
Use the Trade Journal Template
The Trade Journal Template on DayTradersDiary.com can be adapted to include an ADX cluster field.
Instead of saying:
ADX. 29
Write:
Emerging to established bullish cluster, ADX 21 to 29 over 6 candles, +DI dominant, ATR increasing.
That explanation is far more beneficial when you are doing a monthly evaluation.
You are recording the market situation, not the indicator value.
What to Look for During Review
After 50 or 100 trades, separate results by cluster.
You might find:
Emerging clusters produce 0.55R expectancy.
Established clusters produce 0.42R.
Mature clusters produce 0.10R.
Decaying clusters produce -0.18R.
Now you have something actionable.
You might stop chasing mature trends.
Focus your entries around emerging clusters.
You might use established clusters for continuation trades.
That is how indicator research becomes a trading process.
Avoid Overfitting the Thresholds
Do not spend months trying to determine whether 24.5 is better than 25.0.
The market is not that precise.
The difference between ADX 24 and 25 is rarely the real edge.
The sequence matters more.
The transition from 17 to 25 can be meaningful.
The transition from 38 to 31 can be meaningful.
The exact decimal value is usually less important than the cluster’s behavior.
This is also why I prefer broad regimes rather than overly precise thresholds.
The Psychological Advantage of ADX Clusters
There is a psychological benefit to this method.
It permits you to stop fighting the market.
One of the most expensive habits I have seen among active traders is trying to trade every market in the same way.
They scalp ranges during strong trends.
They chase breakouts during exhaustion.
They trend-follow during low-ADX chop.
They short every overbought reading during a powerful bullish trend.
ADX clusters create a framework for deciding what type of market you are dealing with before deciding how to trade it.
That can eliminate a tremendous amount of unnecessary decision-making.
ADX Does Not Predict the Future
This point deserves emphasis.
ADX is descriptive.
It summarizes the directional price behavior.
It does not know what the next candle will do.
A reversal can follow a rising ADX.
A falling ADX can be followed by trend continuation.
A low ADX can remain low for hours.
A high ADX can remain high longer than expected.
Therefore, use ADX clusters to classify the current environment, not to make deterministic predictions.
A Complete ADX Cluster Routine
Before taking a trend-following trade, ask yourself:
What is the current ADX zone?
Is ADX rising, flat, or falling?
How long has it remained in this cluster?
Which DMI line is dominant?
Is price structure actually trending?
What is ATR doing?
Has the market already made an unusually large move?
Where is the structural invalidation?
Does the potential reward justify the risk?
If you cannot answer those questions, the ADX number alone should not convince you.
A Practical Example
See GBP/USD on the 5-minute chart.
ADX has been between 16 and 19 for the last hour.
Price is stuck in a range.
Then volatility in London picks up.
Price breaks the range high.
ADX rises:
18
19
21
23
26
28
+DI crosses above -DI and stays above it.
Price forms a higher high followed by a controlled higher low.
ATR expands moderately.
This is a strong emerging-to-established bullish ADX cluster.
Instead of buying the initial spike unthinkingly, you can wait for the first controlled pullback.
Now consider what happens next.
ADX reaches 38.
Price accelerates vertically.
ATR expands sharply.
Price is several standard intraday ranges away from the original breakout.
At this point, the market may still be bullish.
But the entry quality has deteriorated.
You have moved from:
Trend development
to
Trend maturity and extension.
That distinction can save you from buying the strongest-looking candle at the worst possible location.
Scaling and Capital Growth
Once you begin classifying market states consistently, you can start thinking about whether your strategy is scalable.
This matters because a genuine trading edge can still have a limited financial impact when your personal capital is small.
But scaling should come after validation.
If your ADX-cluster strategy has not been tested across different market regimes, increasing capital increases the consequences of uncertainty.
Professional traders often use evaluation programs because they can provide a framework for demonstrating consistency before accessing larger notional capital.
The important part is choosing a program whose rules do not conflict with the strategy.
For example, The5ers currently offers its High Stakes program with a two-step evaluation, an unlimited maximum trading period, a 5% maximum daily loss, a 10% maximum loss, and scaling based on 10% profit milestones. The program permits overnight and weekend holding while restricting order execution around high-impact news events.
That can be relevant to an ADX-based trader because your strategy may hold positions through multiple sessions while waiting for a trend-strength cluster to mature.
The5ers also currently offers futures programs with separate Day Trade and Swing structures, including different holding requirements and risk parameters.
The point is not that one firm is automatically right for every trader.
The point is that capital allocation should fit the strategy.
A trader who relies on overnight trend continuation needs different rules from a trader who closes everything intraday.
If your ADX cluster method is already profitable and repeatable, consider researching the The5ers evaluation program as one possible route toward scaling.
Compare the rules with alternatives such as other forex evaluation firms, futures programs, or stock-focused prop firms before committing.
The evaluation should serve your process, not force your process to change.
The Real Edge Is Market-State Recognition
The strongest traders I know do not necessarily have the most indicators.
They are often better at recognizing the kind of market they are currently trading in.
They know when the market is:
Quiet.
Expanding.
Trending.
Overextended.
Rotational.
Losing direction.
ADX clusters can help turn that recognition into something measurable.
That is far more valuable than simply adding another indicator to the chart.
Frequently Asked Questions
What is an ADX cluster?
A cluster of ADX is a series of successive ADX readings that either stay within a specific strength zone or follow a consistent pattern of activity. Traders do not just look at the value of one ADX but its level, slope, persistence, link with DMI and price structure.
What ADX level indicates a strong trend?
There is no universal cut-off, however 25 is generally used as a reference for a greater trend while readings below 20 are often associated with non-trending situations. These broad zones are outlined by Fidelity and Schwab, and note that ADX measures strength, not direction.
Is ADX above 25 bullish?
An ADX might be high in a strong uptrend or downtrend. Use +DI and -DI with pricing structure to identify directional context.
What does rising ADX mean?
Rising ADX generally means directional strength is increasing. It does not tell you whether buyers or sellers are responsible for that strength. Direction must be assessed separately using DMI and price action.
What does falling ADX mean?
A falling ADX often implies that the strength of direction is lessening. That doesn’t mean an automatic turnaround. In this case, ADX is falling but Price can keep trending if the expansion is slowing down.
Is ADX useful for day trading?
Yes, especially as a filter of market regimes. It can help traders identify the difference between low directional situations, nascent trends, established trends and weakening trends. It is better as a context filter than as an entry signal on its own.
What is the best ADX period for day trading?
The ADX is typically set to 14 periods, but you can test shorter and longer intervals. Shorter settings are faster, but can produce more noise. Longer settings are smoother . But may detect regime changes later . Best setting depends on your plan and time frame.
Should I combine ADX with ATR?
Yes, this can be useful because the two indicators answer different questions. ADX measures directional strength, while ATR measures volatility. A high-ADX, high-ATR market behaves very differently from a high-ADX, low-ATR market.
Can ADX identify trend reversals?
The ADX does not immediately predict reversals. However, if a high ADX is followed by a long move down, especially when accompanied by a degradation in the price structure and a change in DMI dominance, it can be evidence that the current trend is losing strength.
Should I enter when ADX crosses 25?
Not on its own. A move through 25 can be indicative of strengthening directional momentum yet the trade quality will be dependent on price location, structure, DMI direction, volatility, liquidity and the particular setup being traded.
Final Takeaway
The biggest mistake with ADX is treating it like a traffic light.
Below 20 means stop.
Above 25 means go.
Above 40 means go faster.
Markets do not work that way.
The useful information is in the sequence.
An ADX moving from 17 to 28 tells a different story from an ADX falling from 42 to 28.
An ADX holding around 30 while price forms clean higher highs tells a different story from an ADX at 30 while price repeatedly fails at resistance.
The number is only one piece of the information.
The cluster tells you what the number is doing.
For your next 30 to 50 trades, stop recording only the ADX value.
Record the ADX state.
Was it dormant?
Emerging?
Established?
Mature?
Decaying?
Then combine that classification with DMI, ATR, and price structure.
You may discover that your best trades do not occur when ADX is at its highest.
They may occur when ADX is transitioning from weak to strong.
That is a much more interesting edge.
And once you can identify that transition consistently, your next challenge is to study how your entry delay, stop placement, and profit-target decisions behave inside each ADX cluster.
That is where an indicator stops being something you watch and becomes part of a trading process.